Goldipucks And The Three Skaters: Byfuglien, Carlson, and Jones
Rick Roos
2018-02-07

Is Seth Jones' offensive success this season sustainable?
Good news Dobberites! The reappearance of Goldipucks and the Three Skaters last month was so popular and well-received, Dobber has given me the go ahead for it to appear as often as every two or three weeks for at least the remainder of the regular season!
For first time readers, or those who missed its recent return, the concept is a play on Goldilocks and the Three Bears, except instead of bowls of porridge I’m covering skaters and declaring one too hot (i.e., doing unsustainably better than he should), another too cold (i.e., doing unsustainably worse), and a third “just right” (i.e., producing where he should). Each skater also receives a 1-10 rating, indicating, on a relative scale, how hot (rated 7-10, where 10 is the most unsustainably hot), cold (rated 1-3, where 1 is the most unsustainably cold), or just right (rated 4-6, where 5 is the most “just right”) he is.
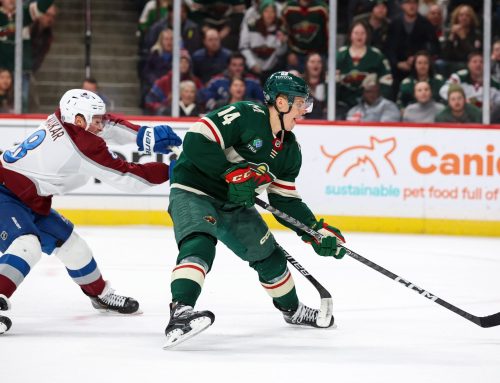
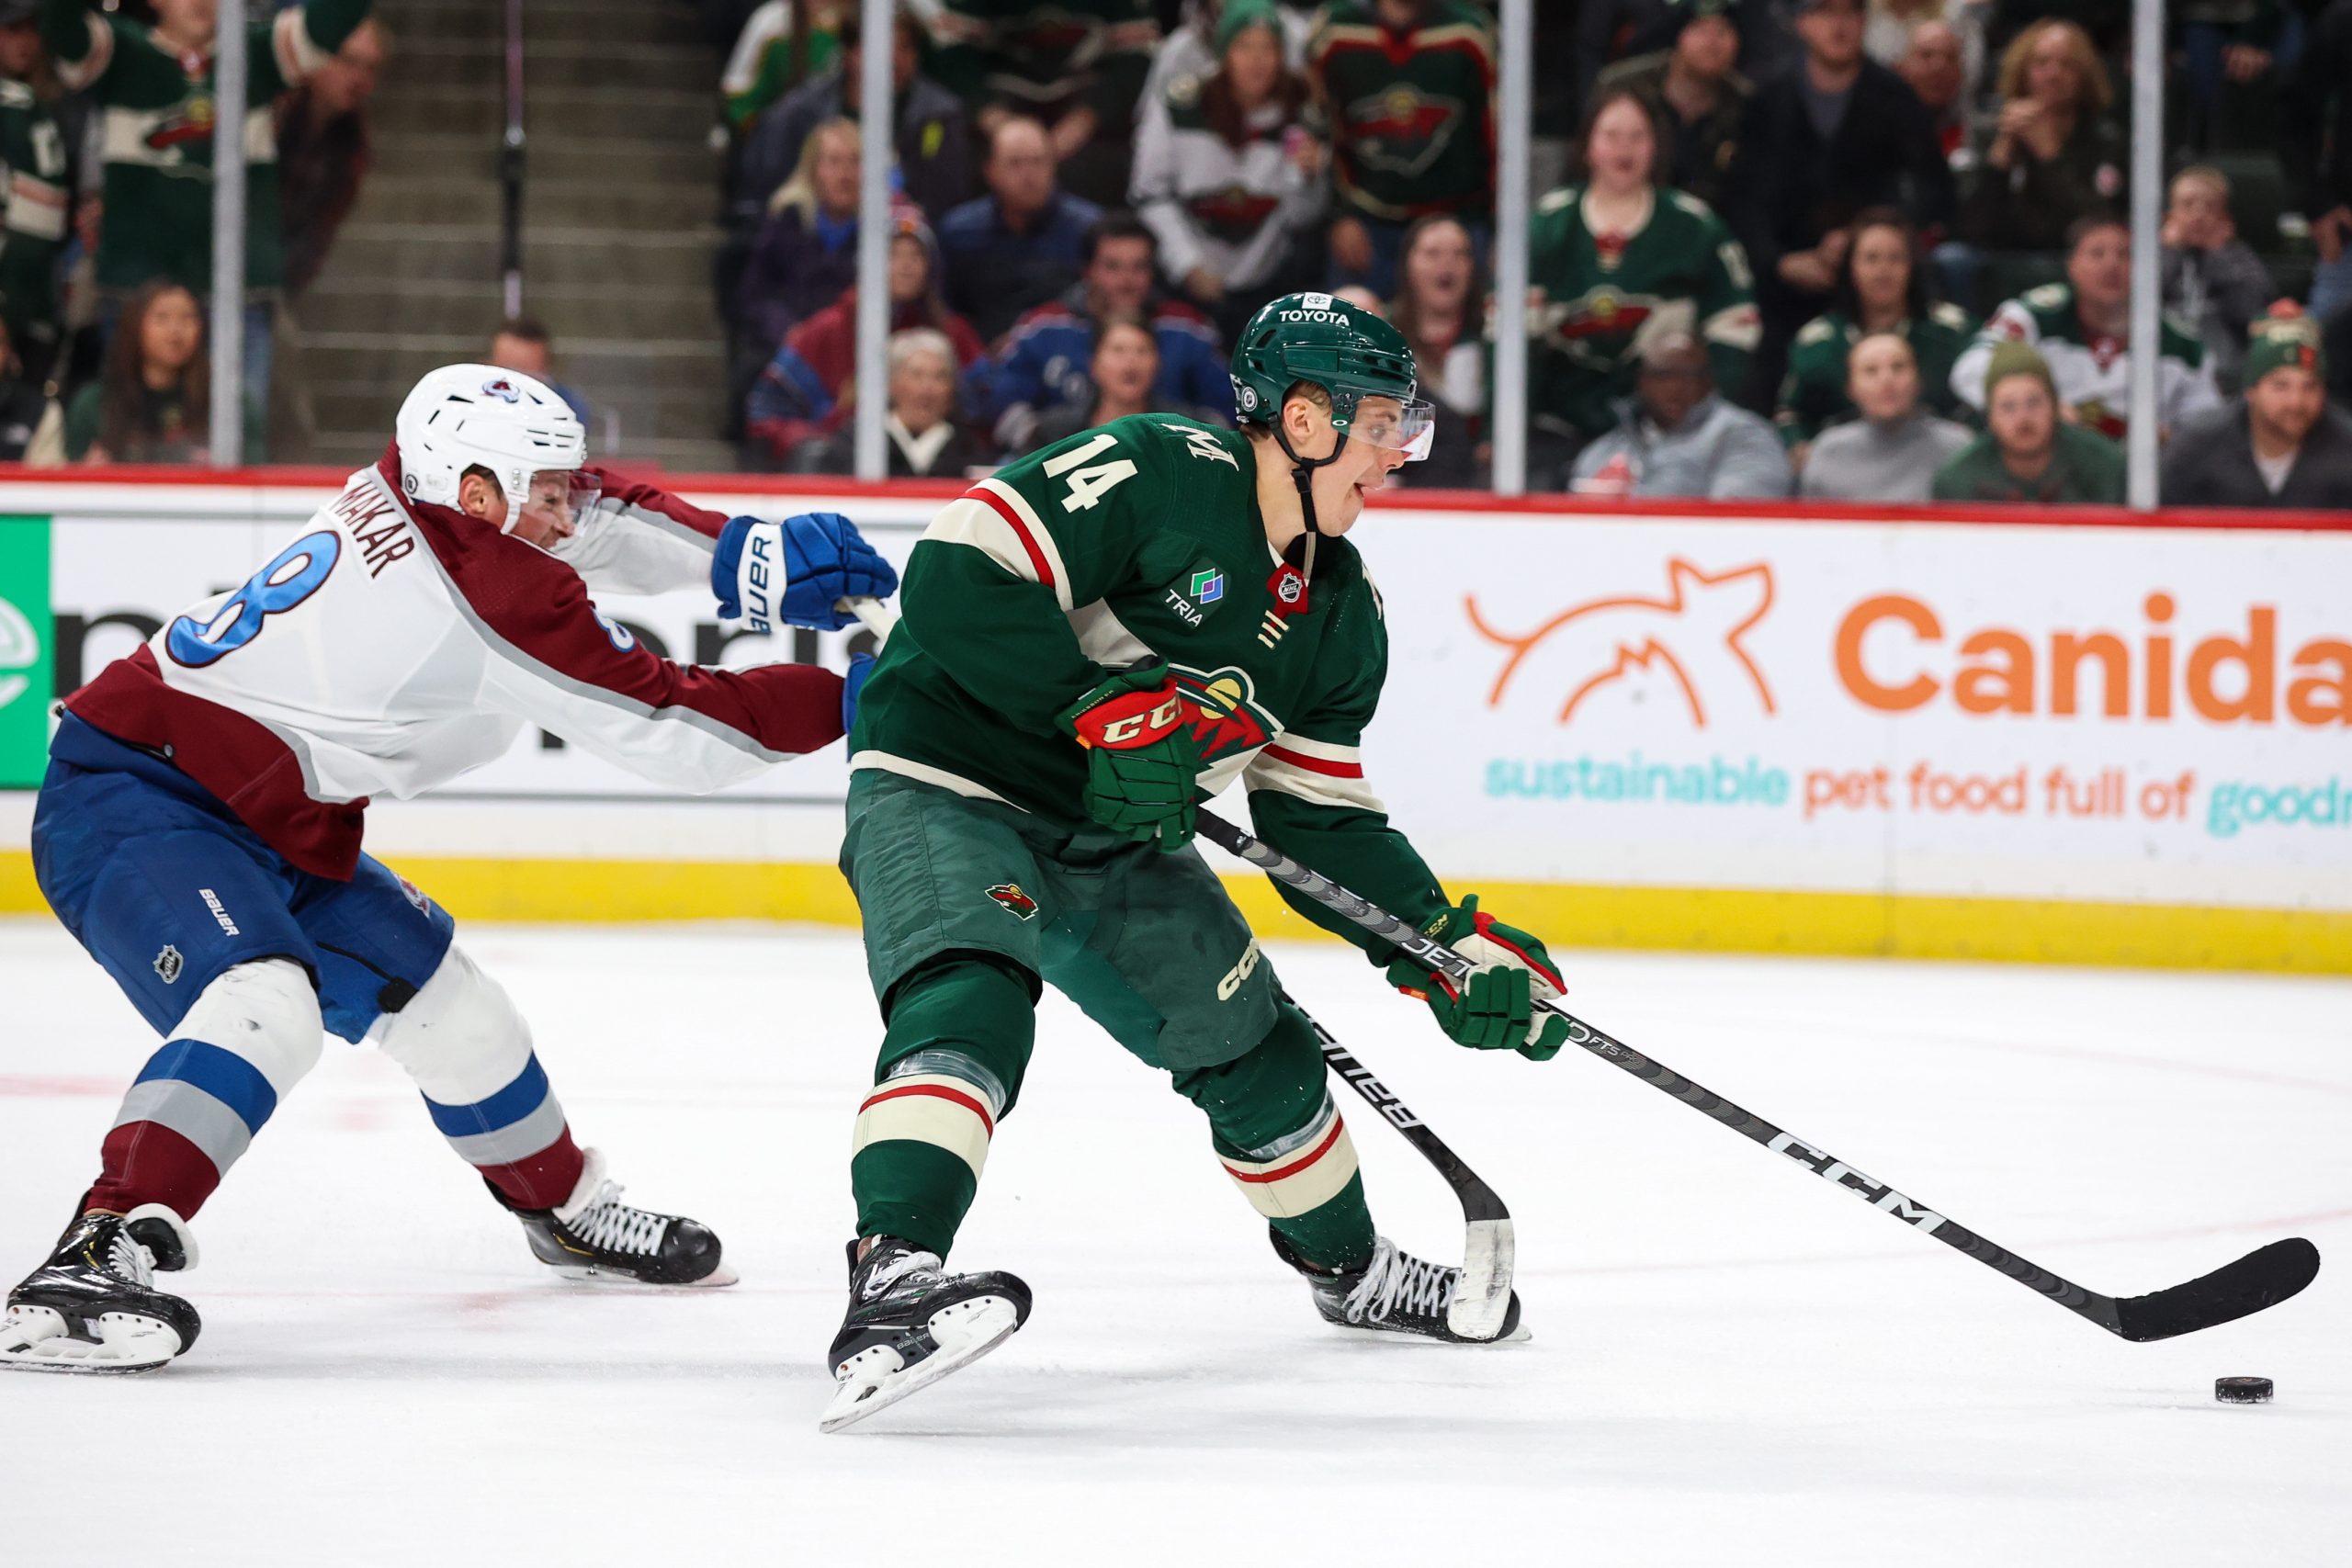
Our skaters this week are all defensemen – Dustin Byfuglien, John Carlson, and Seth Jones. Go ahead and guess which is too hot, too cold, and just right, then read on to see if your choices turn out correct.
For the first time since departing Chicago nearly a decade ago, Byfuglien isn’t producing at or above a 53 point scoring pace. And this is happening despite the Jets offense firing on all cylinders. For Byfuglien, is this a temporary lull, a new normal, or somewhere in between? Well, let’s put it this way – if you’re a Big Buff owner waiting for him to turn it around, you might want to stop holding your breath.
Buff’s 7.63% team shooting % isn’t much lower than his 8.23% average since leaving Chicago. His OZ% is 49.9%, landing it squarely within the 49-52% it’s been for each of the past five seasons. His SH usage percentage has plummeted from last season’s 43% to 14%. And his IPP is 35.61%, which is well below the 51.4% average of his IPP rate over the past six seasons.
So why am I not predicting a rebound, or at least that his season-to-date production will hold steady? For starters, his SH duty being down is a function of his overall ice time being down, including his PP usage. Also, his low IPP might not be an outlier, considering it’s already dropped for three straight seasons, from 60.2% in 2013-14, to 52.9% in 2014-15, to 45.3% in 2015-16, to 42.6% last season. Also, 15 of his 19 assists (or 79%) on the season have been secondary assists, after only once in the past five seasons having that figure be more than 52%. Beyond that, his SOG rate – which was 3+ each and every season since he left Chicago – has nosedived to 2.27 per game for this season thus far.
Collectively, this suggests a player whose skills have eroded and, on top of that, who seemingly is not putting forth the level of effort he once did. Winnipeg might have no choice but to keep playing Buff more than they’d prefer due to Jacob Trouba’s injury, but don’t let that fool you into thinking he’ll rebound. Instead, it looks like he’s a sinking ship, set to bring down many a fantasy team with him.
Byfuglien is TOO HOT, and gets a rating of 7.5 since although the team will look more to the likes of Tyler Myers, Toby Enstrom and even Josh Morrissey to carry some of the load big Buff once took on, he still will get opportunities due to the Trouba injury and thus should manage not to fall too far off his roughly point-per-every-other-game pace he’s posted thus far this season. But his days of producing even 45 points in a season – let alone 50+ – could be over.
On paper, it seems difficult to predict how Carlson will finish the season, since on the one hand he’s produced elite numbers in the past (94 points in 138 games in 2014-15 and 2015-16) yet as recently as last season struggled to post even a point-per-every-other game. Now we find him scoring at a career best rate, so is it sustainable? In a word, yes.
His luck metrics – namely IPP, team shooting percentage and offensive zone starting percentage – for 2017-18 square with those from 2014-15 and 2015-16. Also, although his shorthanded duty is a tad higher than it was in 2015-16, it’s lower than it was in 2014-15. More importantly, however, his usage percentage on the PP has skyrocketed from an average of 53.1% over the past four seasons to 76.4% for 2017-18 thus far. That means poolies shouldn’t be concerned by the fact that Carlson already had more PPPts this season by game 47 than he did in his entire 55 point 2014-15 campaign. If anything, he could even see his PPPt rate rise if Washington can up its conversion percentage with the man advantage (presently at 20.2%) closer to its 23.1% mark from last season.
Here’s another interesting fact – no defenseman in all of hockey has hit more posts this season than Carlson’s five, and he’s even hit a crossbar to boot, with only five d-men having done that than once. So there’s six points he came inches away from receiving (assuming, of course, he didn’t get an assist in the aftermath). He’s also tied for ninth among league defensemen in shots missed over the net. Not only is that a marker of many high scoring d-men, but Carlson just so happened to have finished in the top ten in that area in both of his most productive past seasons.
Let’s also not overlook the elephant in the room, which is that Carlson is playing for a UFA contract. Whether one approves of someone trying harder or padding stats under such circumstances, if indeed that is contributing to Carlson performing better this season it’s welcome news to poolies and supports him continuing to put forth the same effort level – and, in turn, producing the same or similar gaudy fantasy numbers between now and game 82, even if the team’s playoff berth is well in hand much earlier than that.
I’m placing Carlson into the JUST RIGHT category and assigning him a rating of 4.75 since he could see added benefit if (when?) the Caps’ PP success rate rises back to its 2016-17 level and provided the team is able to up its overall scoring closer (currently at 3.05 goals per game) to the 3.18 goals per contest it posted last season. Plus, he might get less unlucky when it comes to hitting posts and crossbars.
Last season in Columbus, Jones tallied 42 points in 75 games to tie for 18th in leaguewide rearguard scoring. Of course you can’t be blamed for overlooking that accomplishment at the time, as well as the fact that 35 of those 42 points came in just Jones’ final 57 contests, since last season it was all about Zach Werenski in Columbus. With Werenski mired in a sophomore slump, Jones is stepping up even more and seemingly staking a claim to be a true #1 d-man in all senses of the word, ala a Drew Doughty or Alex Pietrangelo, with offensive output to go along with defensive responsibility. And I’m here to tell you, it’s only going to get better.
Jones’ points per game total has increased in each of the past three seasons, so his jump this year is not a surprise nor unsustainable. His IPP is likewise on track to increase for the third straight season. Beyond these factors, more than half of Jones’ added 1:31 of ice time per game this season is coming with the man advantage, such that for the first time in his career he’s skating for over 50% of the Blue Jackets’ total PP Time. Also, that figure is a lagging indicator, as only once since December 20 has Jones taken the ice for a lower percentage than his season-long average. In other words, he’s on the ice for closer to two-thirds of all Blue Jacket power-play time nowadays, and even more importantly it’s producing results, with nine of his 12 PPPts coming since December 20.
Also, Jones’ luck metrics suggest there’s realistic room for his scoring to further improve, with his team shooting % being a measly 6.64%,which is less than what it was in two of his past three seasons. Moreover, his OZ% is 56.9%, which is not unsustainable, plus he’s shooting the puck at a rate of over three per game after topping two per game – and barely (152 SOG in 75 games) – for the first time last season. And despite this big jump in SOG rate, his shot quality is improved, with his average shot distance having shrunk from 48.2 and 48.3 feet in his two prior seasons, to just 46.5 so far for 2017-18.
Lastly, Jones heating up as last season went on is nothing new, with him having nearly doubled his first half output in the second half of 2015-16, so he has a track record as a better second half player. And even beyond all this, Jones is producing more primary assists than secondary this season for the first time as a Blue Jacket, so he has room to get a few more lucky secondary assists in the normal course over the remainder of 2017-18.
No question about it, when looking at his season-long totals Jones is TOO COLD. He has officially arrived as a fantasy force and thus gets a rating of 2, since it’s not unreasonable to envision him producing at a 60+ point pace over the rest of this season.
13 Comments
Leave A Comment
You must be logged in to post a comment.
Related Posts


UPCOMING GAMES
Starting Goalies
Top Skater Views
Top Goalie Profile Views
LINE COMBOS
| Frequency |
| |
|---|---|---|
| 17.5 | MIKKO RANTANEN NATHAN MACKINNON JONATHAN DROUIN | |
| 16.3 | VALERI NICHUSHKIN CASEY MITTELSTADT ARTTURI LEHKONEN | |
| 14.6 | MILES WOOD ZACH PARISE ROSS COLTON | |
DobberHockey Podcasts

Fantasy Hockey Life: Tim-Eh’s Time in the TIDY Top Tier
When one of the managers in the TIDY league top tier left midseason, Patron Tim volunteered to give up his excellent team to take over a mid-season orphan fighting to escape relegation. And Tim did not go quietly. Ryan, Jesse and Victor welcome Tim to talk through his experience and the trades he made in […]

Keeping Karlsson: Better Off Nedeljkovic
On this week’s Keeping Karlsson Fantasy Hockey Podcast mega-show, Elan and Brian gather and analyze the latest fantasy hockey news, notes and data from the past season to work on projecting the 2023-24 NHL and fantasy hockey season. — Join the Keeping Karlsson patron community! Patrons get guaranteed KKUPL invitations, plus monthly bonus AMA episodes, and full access to […]
Fantasy Hockey Life: FHL Player Cards with Brandon
Our guy Brandon has been doing great work behind the scenes to great Fantasy Hockey Life prospect player cards, visualizations with the metrics we care about most – including BASH. These are a great tool to catch at a glance the stats for upcoming players. Jesse interviews Brandon and Victor on the decisions behind what […]
Keeping Karlsson: Short Shifts – One Final Lap
Lewis goes for a solo skate to bring Short Shifts season five to a close. He starts by covering some of the headlines including broken records for Quinn Hughes and Nikita Kucherov, taps the stick for Jeremy’s brilliant call on Matchup Maximizer to stream Trevor Moore for his hat trick, and celebration for Wyatt Johnston […]
Keeping Karlsson: A Fortnight of Flowers
On this week’s Keeping Karlsson Fantasy Hockey Podcast mega-show, Elan and Brian gather and analyze the latest fantasy hockey news, notes and data from the past season to work on projecting the 2023-24 NHL and fantasy hockey season, including: Is having a top-tier goalie really ever worth it come playoff time? Which players have been the most clutch for […]
Byfuglien will be 33 in March, so it’s hardly a surprise that he’s starting to slow down, especially for a physical player. Keeping him off the PK if there are options just as good is probably a good move to keep him healthy and not over-work him. This can’t happen until Trouba’s back, of course. With Myers, Trouba, and Morrissey in the fold, let Buff focus on offence and hitting.
This seems like more than just slowing down though. Between the dropping IPP and SOG totals, I think there’s also a component of him phoning it in, or his conditioning becoming an issue again. For years he got by on sheer talent, but now it looks like everything is going wrong all at once and the numbers suggest it will only get worse from here.
This article seems like a better fit for the off-season or looking at keeper trades. To say that “it looks like he’s a sinking ship, set to bring down many a fantasy team with him” is a bit misleading and over dramatic. If you are counting on Byf to be your #1 fantasy d-man, yes, you may be right, considering what it may have cost you at the start of the year, but if you’re like me, and Byf is your 3rd or 4th D-man, he’s perfectly suited there and has more value than many other defensemen in fantasy. ESPECIALLY in a multi-cat league with hits and PIM. He is one point away from matching his PPP from last year, and his SOG are way down, but he’s still ranked 84th overall in my league (and worth a bit more with his missed games factored in).
He is not the top-15 player he’s been the last two years in my league, and if you’re not in a playoff race it would make sense to try and trade him for future assets before his value declines further. But he’s still a valuable piece in fantasy hockey. I’d say he’s just right.
Rick’s comment can obviously not apply to every man’s specific situation. If you look at FantasayPro’s Average Draft Position consensus for the current season, Byfuglien was the 4th defenseman off the board and 29th player altogether. So yeah, I would think there are quite a lot of GMs going down with their first blueliner.
Yes, this was my point. Buff has been a cost vs. value nightmare this season, meaning that what you paid to get him in draft or trade (i.e., his cost) has far exceeded the value he’s provided. So although it is likely true that he won’t singlehandedly sink any team’s ship, his value is far lower than it should be, especially when taking into consideration how much better the Winnipeg offense is as a whole.
Out of curiosity, where are you getting all these obscure numbers from?
He literally made them up.
Not True. Go to nhl.com and click on stats.Then click on players. Then click the blue bar that says “refine results”. On the drop down menu that says “Report” and scroll down until you see the one which says Shots by Type, and then click the black bar which says “Run Report”. All the MsS on the right refer to missed shots, with MsS Cross being crossbars, MsS being posts, etc. You can then see the highest and lowest by clicking on the specific stat, and you can choose position by going to the left side of the screen and changing “all skaters” to just which position you want. Plus you can change the year, look at just rookies, etc.
The nhl.com stat site is very, very good and a fun rabbit hole to fall into when you have some time.
Thanks for this, might look into this when considering future potential trades
I thought he was referring to the 1-10 scale.
I see – I guess I do “make up ” that number, but only in the sense that I match it to the degree of hotness, coolness, or just rightness that I’ve objectively observed
Thanks Rick. Great read. Columbus will be scary when Jones gets just right and Werenski gets back in business.
Just like anonymouse, I am a bit curious to know where you find all those stats. Who the hell tracks how many defensemen hit crossbars?
See my reply below. All that and more is at nhl.com. Check it out – there is a lot there which can benefit you in your research.