Dead Pucks
Ian Gooding
2015-03-22

Is the dead puck era back?
It is not hard to see what is occurring in our pools this year. The National Post's Cam Cole writes about it in his column called, "With no NHL players poised to reach 100-point mark this season, is the dead puck era officially back?"
Cole correctly predicts, "For historical perspective, there's a pretty good chance that 2014-15 scoring race, barring a massive spurt by someone in the final month, will be won with the lowest points-per-game total in 60 years, since Bernie Geoffrion took the 1954-55 title with 75 points in 70 games."
He adds, "The top 10, then all essentially point-a-game guys" and "Evidently, this has become the gold standard of NHL excellence: one point per game by its most exciting players."
More historical analysis follows a bit later in his article (starting from 1968-69):
"Only five seasons in that span has no one reached 100 points. Two of those times, lockouts shortened the season to 48 games (and even then, the scoring champions were on a 100-plus pace)."
"The other three exceptions happened in the five years before the 2004-05 lockout, when the league realized it had a scoring crisis and adopted fairly radical rule changes to try and re-start offences after the cancelled season."
It is hard to argue with his logic, but it is really because of the “dead puck”?
Let us take a look at the seasonal statistics (as complied from NHL.com).
|
Season |
Games |
Goals |
Goals / Game |
Scoring Leader |
Points |
|
2014-15 |
1066 |
5667 |
5.31 |
Crosby / Ovechkin * |
83 proj |
|
2013-14 |
1230 |
6573 |
5.34 |
Crosby |
104 |
|
2012-13 |
720 |
3822 |
5.31 |
St. Louis |
60 |
|
2011-12 |
1230 |
6545 |
5.32 |
Malkin |
109 |
|
2010-11 |
1230 |
6721 |
5.46 |
D. Sedin |
104 |
|
2009-10 |
1230 |
6803 |
5.53 |
H. Sedin |
112 |
|
2008-09 |
1230 |
7006 |
5.70 |
Malkin |
113 |
|
2007-08 |
1230 |
6691 |
5.44 |
Ovechkin |
112 |
|
2006-07 |
1230 |
7082 |
5.76 |
Crosby |
120 |
|
2005-06 |
1230 |
7443 |
6.05 |
Thornton |
125 |
|
2003-04 |
1230 |
6318 |
5.14 |
St. Louis |
94 |
|
2002-03 |
1230 |
6530 |
5.31 |
Forsberg |
106 |
|
2001-02 |
1230 |
6442 |
5.24 |
Iginla |
96 |
Yes, the goals-per-game ratio is getting closer to the rate pre-lockout, but it also is about the same as the last three seasons. How can the scoring leaders drop to such low point-per-game paces when the same amount of goals were scored before and they were topping just over 100 points?
Well if you were paying attention to your pools, there probably were a few owners who skyrocketed from the bottom of the standings in November to near the top of the standings in mid-March. How did they do it if scoring was down?
The scoring was spread out. The elite players did not proved you as great of an advantage this year and because the middle tier of players improved, fantasy teams that were projected to place at the bottom of your league standings have made a dramatic improvement. Conversely, some of the top-rated fantasy teams dropped like a stone in the ocean.
Cole asks "What happened?" and gets a response "PK (penalty killing), that's the biggest thing. It's become so much better. You have to be really on your game even to get a power-play scoring chance," from Daniel Sedin.
Daniel's brother, Henrik suggests "I don't know if it's because of all the concussions, they're trying to slow the game down. Which I'm totally OK with, but I think that's the way the game is called right now, and you won't see the five-on-threes, or seven power plays a game, or the open ice that you used to see because guys were afraid to put a stick on you or grab you or hold you."
In addition, Cole says, "The coaches took it from there, with heavy emphasis on penalty killing and shot-blocking."
I don't disagree with Cole's assertion about coaching being more defensively oriented, but if on the whole all this were true then all goal scoring would be down, from the elite players down to the grinders.
Let us take a look at which teams play in games with the most goals, not just goals for but also goals allowed. Remember that the average goals per game rate is 5.31.
|
Games |
TGG |
AGFG |
AGAG |
ATGG |
|
|
DALLAS |
71 |
444 |
3.06 |
3.20 |
6.25 |
|
NY ISLANDERS |
72 |
415 |
2.99 |
2.78 |
5.76 |
|
TORONTO |
72 |
412 |
2.57 |
3.15 |
5.72 |
|
TAMPA BAY |
72 |
411 |
3.21 |
2.50 |
5.71 |
|
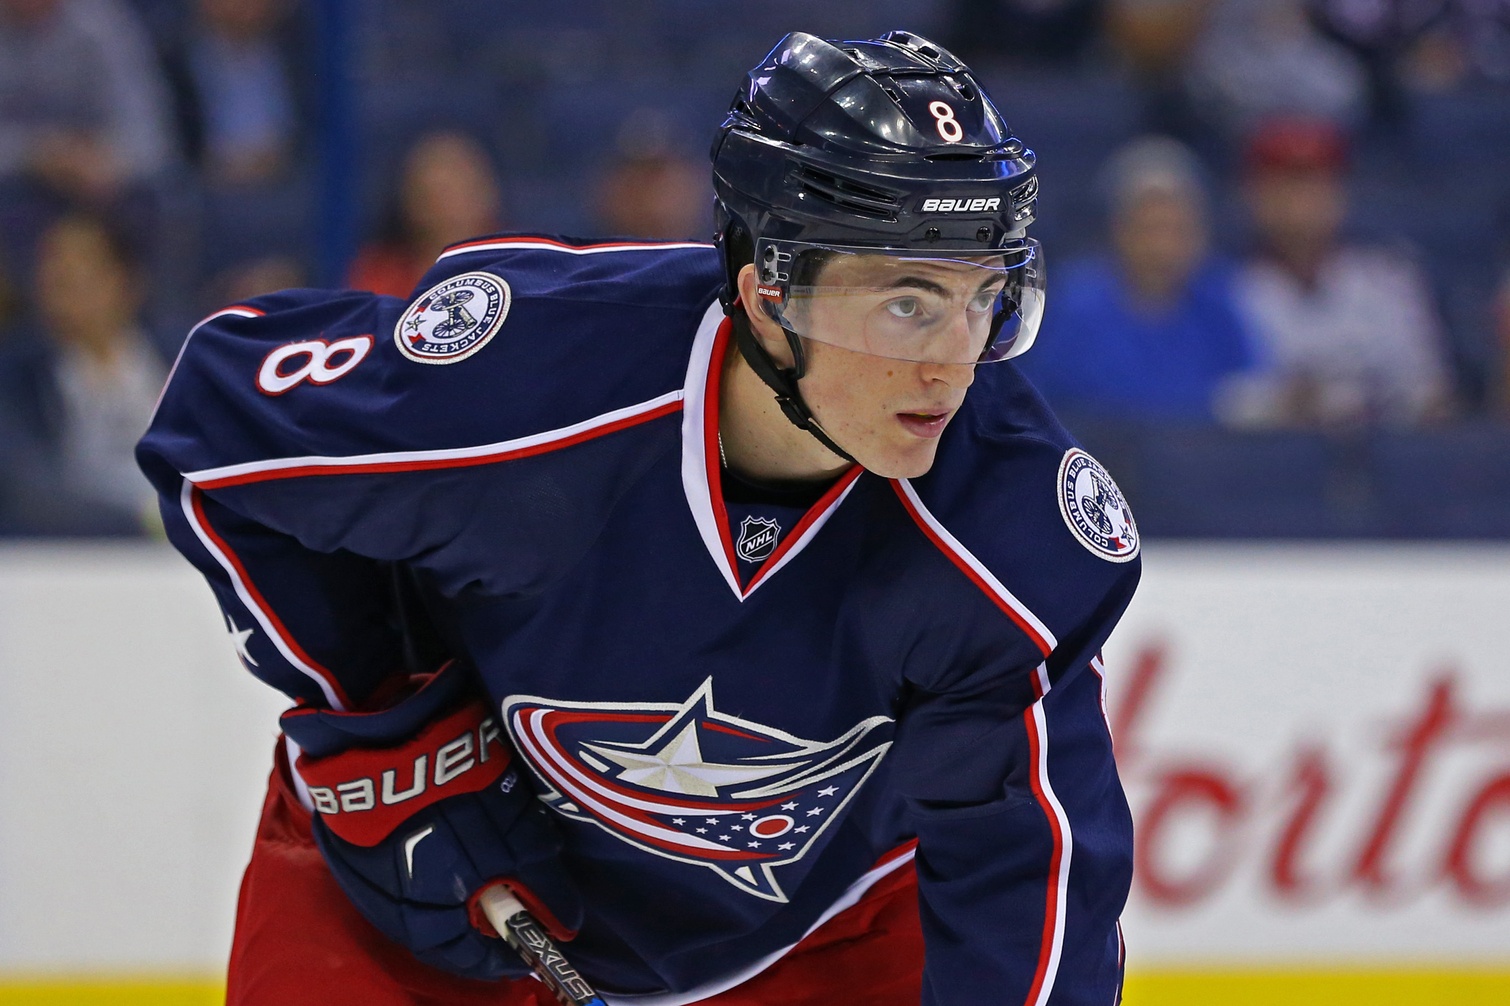
COLUMBUS |
71 |
404 |
2.58 |
3.11 |
5.69 |
|
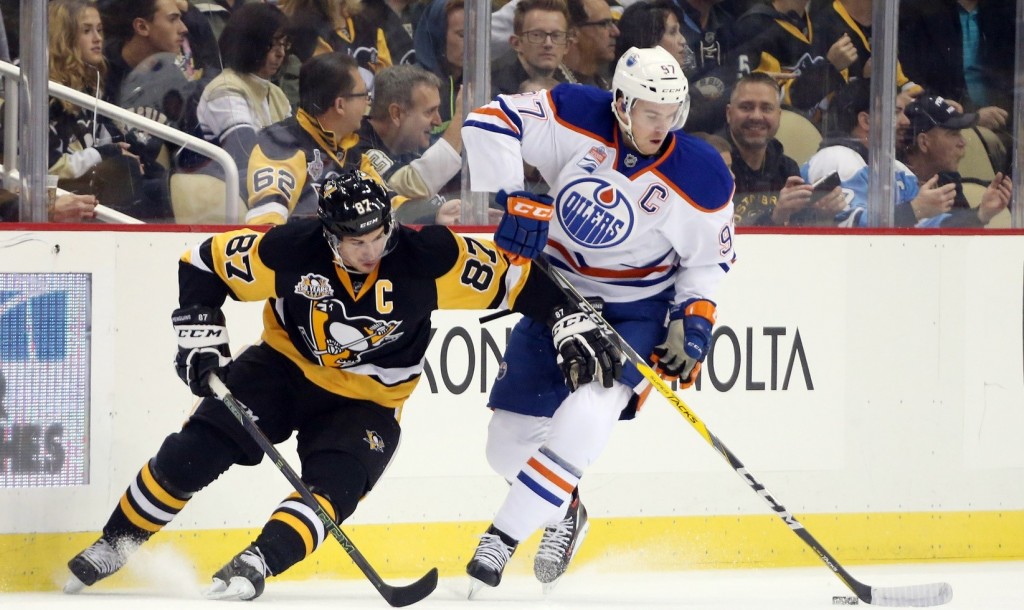
EDMONTON |
71 |
398 |
2.28 |
3.32 |
5.61 |
|
SAN JOSE |
71 |
390 |
2.76 |
2.73 |
5.49 |
|
VANCOUVER |
70 |
384 |
2.79
📢 advertisement:
|
2.70 |
5.49 |
|
ANAHEIM |
73 |
400 |
2.82 |
2.66 |
5.48 |
|
CALGARY |
71 |
389 |
2.89 |
2.59 |
5.48 |
|
DETROIT |
70 |
379 |
2.84 |
2.57 |
5.41 |
|
OTTAWA |
70 |
376 |
2.81 |
2.56 |
5.37 |
|
ST LOUIS |
71 |
378 |
2.96 |
2.37 |
5.32 |
|
COLORADO |
71 |
376 |
2.56 |
2.73 |
5.30 |
|
WASHINGTON |
72 |
381 |
2.89 |
2.40 |
5.29 |
|
PHILADELPHIA |
73 |
386 |
2.53 |
2.75 |
5.29 |
|
WINNIPEG |
71 |
375 |
2.69 |
2.59 |
5.28 |
|
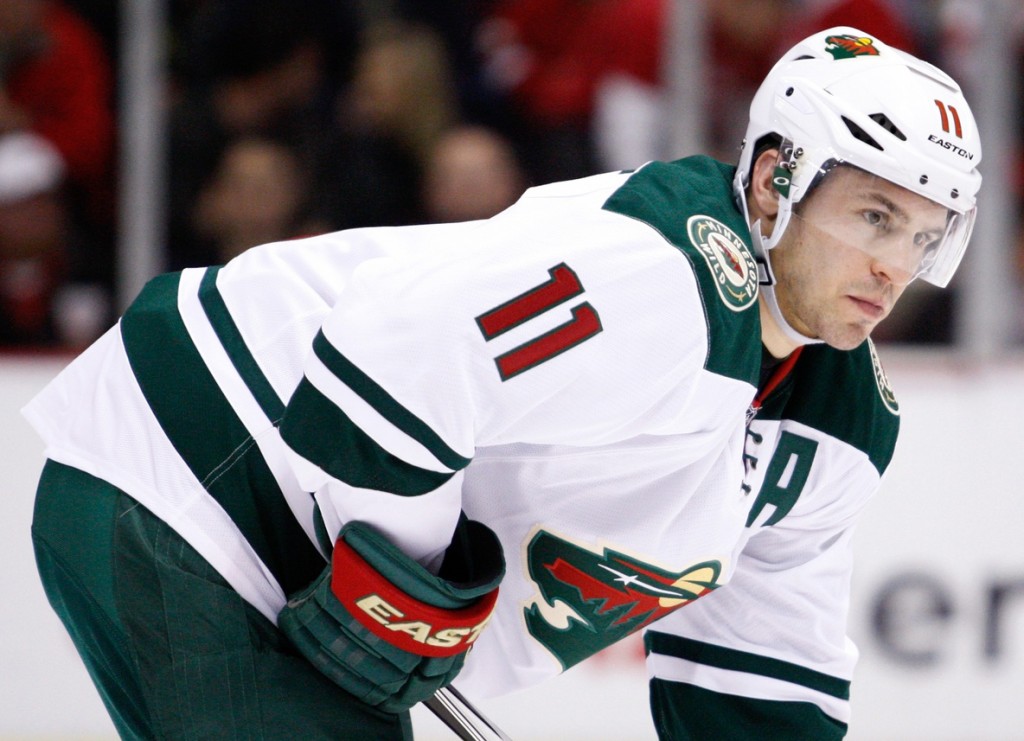
MINNESOTA |
71 |
374 |
2.79 |
2.48 |
5.27 |
|
ARIZONA |
71 |
373 |
2.00 |
3.25 |
5.25 |
|
NY RANGERS |
69 |
358 |
2.96 |
2.23 |
5.19 |
|
PITTSBURGH |
71 |
365 |
2.73 |
2.41 |
5.14 |
|
NASHVILLE |
72 |
370 |
2.76 |
2.38 |
5.14 |
|
BOSTON |
71 |
361 |
2.62 |
2.46 |
5.08 |
|
BUFFALO |
71 |
360 |
1.79 |
3.28 |
5.07 |
|
LOS ANGELES |
70 |
354 |
2.66 |
2.40 |
5.06 |
|
FLORIDA |
71 |
354 |
2.37 |
2.62 |
4.99 |
|
CHICAGO |
70 |
349 |
2.77 |
2.21 |
4.99 |
|
CAROLINA |
70 |
345 |
2.26 |
2.67 |
4.93 |
|
MONTREAL |
72 |
341 |
2.57 |
2.17 |
4.74 |
|
NEW JERSEY |
71 |
332 |
2.24 |
2.44 |
4.68 |
TGG – Total Goals involved in Game
AGFG – Average Goals For involved in Game
AGAG – Average Goals Against involved in Game
ATGG – Average Total Goals involved in Game
Playoff teams highlighted in green
You would expect the worst teams to be involved in higher scoring games, but seven playoff-bound teams are above the average point-per-game rate.
Also, teams like Buffalo, Carolina, and Arizona are below the same rate. Shouldn't they be blown out by better teams?
I guess the best example of the balance in scoring can be found on Tampa Bay.
Steven Stamkos would once have been way ahead of most of his team, but today he is only one point ahead of Tyler Johnson, nine on Nikita Kucherov, and 12 up on Ondrej Palat. The team remains near the top of the league though.
People speculate about the three-point games and if adjusting the value of a win, or more importantly removing the extra point when teams lose in overtime or a shootout, but the defensive systems will still continue.
As a quick fix, allow all the goals scored in the shootout to count towards the individual player totals. I'll feel sad for the goalies, but if their teams and coaches want to promote a defense-first mentality then so be it if they get scored five times in a shootout. This also creates another statistical category that rotisserie pools can utilize.
The pucks and points are not necessarily dead. They are just being shared amongst all the players.
Related Posts
UPCOMING GAMES
| Apr 18 - 19:04 |
| vs |
| |
| Apr 18 - 20:04 |
| vs |
| |
| Apr 18 - 21:04 |
| vs |
| |
| Apr 18 - 21:04 |
| vs |
| |
| Apr 18 - 22:04 |
| vs |
| |
| Apr 18 - 22:04 |
| vs |
| |
Starting Goalies
Top Skater Views
Top Goalie Profile Views
LINE COMBOS
| Frequency |
| |
|---|---|---|
| 26.6 | PHILIPP KURASHEV JASON DICKINSON CONNOR BEDARD | |
| 19.9 | TAYLOR RADDYSH TYLER JOHNSON NICK FOLIGNO | |
| 19.8 | LUKAS REICHEL RYAN DONATO ANDREAS ATHANASIOU | |
DobberHockey Podcasts

Fantasy Hockey Life: Tim-Eh’s Time in the TIDY Top Tier
When one of the managers in the TIDY league top tier left midseason, Patron Tim volunteered to give up his excellent team to take over a mid-season orphan fighting to escape relegation. And Tim did not go quietly. Ryan, Jesse and Victor welcome Tim to talk through his experience and the trades he made in […]

Keeping Karlsson: Better Off Nedeljkovic
On this week’s Keeping Karlsson Fantasy Hockey Podcast mega-show, Elan and Brian gather and analyze the latest fantasy hockey news, notes and data from the past season to work on projecting the 2023-24 NHL and fantasy hockey season. — Join the Keeping Karlsson patron community! Patrons get guaranteed KKUPL invitations, plus monthly bonus AMA episodes, and full access to […]
Fantasy Hockey Life: FHL Player Cards with Brandon
Our guy Brandon has been doing great work behind the scenes to great Fantasy Hockey Life prospect player cards, visualizations with the metrics we care about most – including BASH. These are a great tool to catch at a glance the stats for upcoming players. Jesse interviews Brandon and Victor on the decisions behind what […]
Keeping Karlsson: Short Shifts – One Final Lap
Lewis goes for a solo skate to bring Short Shifts season five to a close. He starts by covering some of the headlines including broken records for Quinn Hughes and Nikita Kucherov, taps the stick for Jeremy’s brilliant call on Matchup Maximizer to stream Trevor Moore for his hat trick, and celebration for Wyatt Johnston […]
Keeping Karlsson: A Fortnight of Flowers
On this week’s Keeping Karlsson Fantasy Hockey Podcast mega-show, Elan and Brian gather and analyze the latest fantasy hockey news, notes and data from the past season to work on projecting the 2023-24 NHL and fantasy hockey season, including: Is having a top-tier goalie really ever worth it come playoff time? Which players have been the most clutch for […]