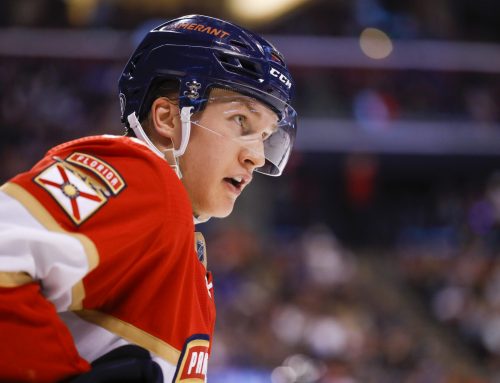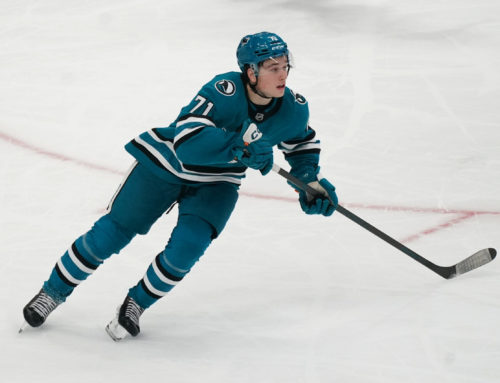
Who would you rather own in your league – Henrik Sedin or Joe Thornton?
Last week's column featured a battle between two players (Sean Monahan, Nick Bjugstad) with a combined age of 42, so it seemed only natural to go to the other end of the spectrum for this edition. With that in mind, facing off are Henrik Sedin and Joe Thornton, both of whom sat among the top 25 NHL scorers for 2014-15 (as of March 15th) despite being drafted before Monahan or Bjugstad were even eight years old. The magic questions are how long can they remain elite, and which one is the better own if you're trying to improve your team over the next few years? Time to find out – Cage Match starts now!
Career Path and Contract Status
I could run down Sedin and Thornton's long list of exceptional accomplishments; however, chances are they're already well known to most. Let's just leave it that both have very impressive NHL and fantasy resumes, highlighted by each having won an Art Ross and Hart trophy (Thornton in 2006; Sedin in 2010) and also being one of fewer than a dozen currently active players to have posted more than 100 points at least once (Sedin in 2009-10, Thornton in 2002-03, 2005-06 and 2006-07).
Of course an older player's performance from 5+ years ago often doesn't remotely bear upon what he can offer poolies nowadays – just ask the fantasy owners of Brad Richards, whom it would be very easy to forget posted 91 points as recently as 2009-10! But both Thornton and Sedin have been productive past the age of 30, with Thornton tallying 70+ points in each of the four full seasons since turning the big 3-0, while Sedin did so twice in his three full seasons since blowing out 30 birthday candles, including 94 points at age 30, which is five better than Thornton's top total in his four post-30 seasons.
Sedin's current deal runs through 2017-18 and has an annual cap hit of $7M, while Thornton's deal ends after 2016-17 and has a slightly lower cap hit of $6.75M.
Ice Time (this and other tables reflect games through March 16th)
|
Season |
Total Ice Time per game (rank among team's forwards) |
PP Ice Time per game (rank among team's forwards) |
SH Ice Time per game (rank among team's forwards) |
|
2014-15 |
18:44 (H.S.) – 1st 18:26 (J.T.) – 4th |
3:00 (H.S.) – 2nd 3:06 (J.T.) – 4th |
0:52 (H.S.) – 7th 0:26 (J.T.) – 8th (tied) |
|
2013-14 |
20:40 (H.S.) – 2nd 18:55 (J.T.) – 4th |
3:27 (H.S.) – 3rd 3:40 (J.T.) – 1st |
0:59 (H.S.) – 7th 0:20 (J.T.) – 10th |
|
2012-13 |
19:20 (H.S.) – 1st 18:22 (J.T.) – 3rd |
3:33 (H.S.) – 2nd 3:17 (J.T.) – 1st |
0:09 (H.S.) – 10th 0:28 (J.T.) – 9th |
|
2011-12 |
19:05 (H.S.) – 2nd 20:28 (J.T.) – 2nd (tied) |
3:40 (H.S.) – 1st 3:22 (J.T.) – 1st |
0:05 (H.S.) – 10th 1:03 (J.T.) – 5th |
This is about what should be expected for aging yet still skilled players like these two, as their Total Ice Time this season is about 2:00 less than their respective high points within these four seasons, and their PP Ice Time is their lowest among the four campaigns. But don't count on a big drop in the coming seasons, as the Total Ice Time for 2014-15 for each is also within 21 seconds of his respective low from these four seasons, suggesting that things have stabilized.
One benefit for Thornton is that his SH Ice Time has been cut by more than half from what it was in 2011-12, while Sedin has logged nearly a minute this season and last, versus nearly no shorthanded duty in the previous two campaigns. And although their productive Ice Times (i.e., Total Ice Time minus SH Ice Time) for 2014-15 are nearly identical – Sedin's is 17:52, Thornton's 18:00 – if we dig deeper, we see that Thornton's number would seem more conducive to sustained scoring than Sedin's. It boils down to PP Ice Time, where Thornton's, despite being is down, is still comprising 16.8% of his Total Ice Time this season compared to 16.4% in 2011-12. That's in contrast to Sedin, who's gone from 19.2% PP Ice Time in 2011-12 to 16.0% this season.
Overall, neither player is in a much better or worse position than the other in terms of Ice Time. And given what they bring to the table, it's safe to predict both will remain top six fixtures with comparable Total Ice Times for the duration of their current contracts.
Secondary Categories
|
Season |
PIMs (per game) |
Hits (per game) |
Blocked Shots (per game) |
Shots (per game) |
PP Points (per game) |
FOW (per game) |
|
2014-15 |
0.20 (H.S.) 0.34 (J.T.) |
0.32 (H.S.) 0.50 (J.T.) |
0.26 (H.S.) 0.35 (J.T.) |
1.16 (H.S.) 1.58 (J.T.) |
0.31 (H.S.) 0.29 (J.T.) |
8.86 (H.S.) 7.30 (J.T.) |
|
2013-14 |
0.60 (H.S.) 0.39 (J.T.) |
0.61 (H.S.) 0.66 (J.T.) |
0.27 (H.S.) 0.41 (J.T.) |
1.38 (H.S.) 1.48 (J.T.) |
0.25 (H.S.) 0.23 (J.T.) |
8.20 (H.S.) 7.52 (J.T.) |
|
2012-13 |
0.50 (H.S.) 0.54 (J.T.) |
0.46 (H.S.) 0.48 (J.T.) |
0.18 (H.S.) 0.43 (J.T.) |
1.46 (H.S.) 1.77 (J.T.) |
0.27 (H.S.) 0.43 (J.T.) |
9.16 (H.S.) 8.54 (J.T.) |
|
2011-12 |
0.63 (H.S.) 0.38 (J.T.)
📢 advertisement:
|
0.39 (H.S.) 0.51 (J.T.) |
0.20 (H.S.) 0.31 (J.T.) |
1.37 (H.S.) 1.90 (J.T.) |
0.33 (H.S.) 0.28 (J.T.) |
7.95 (H.S.) 6.79 (J.T.) |
If looking at this table is your first clue that both Sedin and Thornton are lousy in most of these categories, then you're either in a points-only league or you probably aren't contending for a multi-cat title. Neither is even average in Shots, PIM, Hits, or Blocked Shots; but to make matters worse, Sedin's current averages in PIM, Hits and Shots are the lowest of all four of these seasons, compared to that being the case with just Hits for Thornton.
Both aren't top FOW guys either, although Sedin has been – and remains – a notch better than Thornton. Not surprisingly, the area where they're each still doing well is PP Points. And although Sedin's lowest output for PP Points was in his disappointing 2013-14 season, it wasn't so low as to explain just how poorly he did that season, which, along with his other metrics from that season, suggests that maybe he was a victim of bad luck. We'll check that next.
Luck-Based Metrics
Note that I've begun referring to PDO also as SPSV in the table, as that's what nhl.com calls it in its new enhanced stats platform.
|
Season |
Personal Shooting Percentage |
PDO/SPSV (5×5) |
IPP (5×5) |
IPP (5×4) |
Offensive Zone Starting % (5×5) |
Primary Assist % |
|
2014-15 |
19.0% (H.S.) 13.6% (J.T.) |
984 (H.S.) 988 (J.T.) |
82.4% (H.S.) 79.4% (J.T.) |
67.9% (H.S.) 57.6% (J.T.) |
53.9% (H.S.) 48.3% (J.T.) |
51.1% (H.S.) 59.0% (J.T.) |
|
2013-14 |
11.3% (H.S.) 9.0% (J.T.) |
998 (H.S.) 1004 (J.T.) |
74.4% (H.S.) 75.8% (J.T.) |
68.2% (H.S.) 45.9% (J.T.) |
60.3% (H.S.) 47.5% (J.T.) |
48.7% (H.S.) 55.4% (J.T.) |
|
2012-13 |
15.7% (H.S.) 8.2% (J.T.) |
1035(H.S.) 1004 (J.T.) |
74.3% (H.S.) 64.3% (J.T.) |
71.4% (H.S.) 80.0% (J.T.) |
63.7% (H.S.) 51.5% (J.T.) |
47.0% (H.S.) 60.6% (J.T.) |
|
2011-12 |
12.4% (H.S.) 11.5% (J.T.) |
1024 (H.S.) 1010 (J.T.) |
77.4% (H.S.) 81.5% (J.T.) |
75.0% (H.S.) 64.5% (J.T.) |
78.6% (H.S.) 49.9% (J.T.) |
65.6% (H.S.) 49.1% (J.T.) |
I included Primary Assist Percentage here because it's a key barometer for players – like Sedin and Thornton – whose bread and butter is setting up goals. The data favors Thornton slightly, as he's been over 50% in three of four seasons; and even his one season below 50% he still had a higher percentage than Sedin posted in two of these four seasons. Plus, the last time Sedin managed point-per-game numbers saw him finish with a 65.6% rate, which he hasn't come close to subsequently matching.
But the good news for Sedin is he's on pace for 70+ points despite his offensive zone starting % having dropped each of the past three seasons (and now being a third less than what it was in 2011-12) and notwithstanding his PDO/SPSV being the lowest among these four seasons. And although his 19.0% personal shooting percentage is 50% above his career rate of 13.3%, at his low shooting pace that might amount to a difference of only five extra goals by the end of the season. Overall, the takeaway is that he could replicate his current 70+ point pace in his next couple of seasons as well.
For Thornton, his combined IPP numbers for the past three seasons were 146, 124.3, and 120.7. Thus, his 137 for this season is in his normal range. And unlike Sedin, Thornton's offensive zone starting % has been steady, although quite low for a scorer. His PDO/SPSV is also lowest among all four of these seasons. What's interesting is although Thornton's personal shooting % for 2014-15 is near his career average of 14.0%, his scoring pace is still a bit lower than the 75+ points we've grown accustomed to expecting from him in recent years, where, it so happens, his shooting percentage was much lower. All in all, Thornton owners shouldn't expect his numbers to drop any time soon either; however, he's likely not a great bet to climb back above 75 points again given this data and his Ice Time.
Ownership/Value and Remaining Schedule
In Yahoo leagues, both players are C-only eligible and comparably owned (90% for Sedin, 92% for Thornton). And although Sedin was drafted later than Thornton among C-eligible players (29th, versus 25th), Sedin is ranked better at this point in the season (28th, versus 32nd). Thus, they have similar actual and perceived values when looked at individually and as compared to each other.
For those in one year leagues, as of March 16th Sedin has 14 games remaining versus only 13 for Thornton. Not a large difference, but every little bit can help at this point for those of you in H2H fantasy league playoffs or who are chasing the title in roto leagues.
Who Wins?
These two are about as even as can be, with each poised to post 70+ points in each of the next couple of seasons and having comparably bad secondary category output in all areas except for PP Points.
The one unanswered question is why Sedin slumped to 50 points in 70 games last season. My take on that is he was hampered by his consecutive games streak, as in order to preserve it he likely played when he wasn't even close to 100%. After all, he actually started 2013-14 with 27 points in his first 28 games before getting banged up. Those who grasped that were rewarded when drafting him for this season, as he's returned to his usual self (albeit a slightly older and less productive version).
Since at this point these guys are of interest mainly to those in one-year leagues, the questions come down to which one you should pick and when you should pick him. My advice isn't perfect, but since they're so even what I'd actually recommend is for you to wait for someone else in your league to draft one of them first. Once that happens, unless the selection came too early (unlikely given where they were drafted on average in Yahoo leagues plus the fact that they'll be a year older), then I'd consider grabbing the other one with either your next pick or soon afterwards.


 BUF
BUF NYR
NYR CHI
CHI WSH
WSH CBJ
CBJ VAN
VAN S.J
S.J PIT
PIT ANA
ANA
