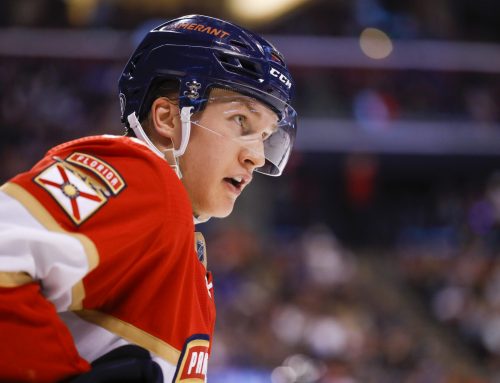
Who would you rather own – Rasmus Ristolainen or Torey Krug? Rick Roos points you in the right direction…
This week’s battle features Rasmus Ristolainen and Torey Krug. Going into 2015-16, poolies would’ve expected Krug to have Ristolainen’s current stat line, and for Ristolainen to continue to improve slowly but surely on a still rebuilding Sabres team. The question is whether what we’re actually witnessing from either (or both) is indicative of how they’ll produce for the rest of 2015-16 or beyond. Time to find out – Cage Match starts now!
Career Path and Contract Status/Cap Implications
Ristolainen, who many forget is only 21, was drafted 8th overall in 2013 despite not showing much offensive potential in his years with TPS Turku. But that didn’t stop Ristolainen from debuting with the Sabres that same season, where he proceeded to post only four points in 34 games, going -15 in the process. Tallying 20 points in 34 AHL contests in 2013-14, and three in five WJC games, validated high hopes for Ristolainen; and last season he upped his NHL points total to 20, albeit with a -34 rating that was arguably more a function of the tanking slumping Sabres than Ristolainen himself. This season he’s been vastly improved, besting his 20 points from last season in only 29 games and staying in the top ten defensemen scorers for most of the campaign.
Krug, now 24, was never drafted, making his way to Boston as a coveted free agent in Spring 2012 after being named a Hobey Baker finalist. Krug spent nearly all the 2012-13 campaign in the AHL, but then famously scored four goals in his first five playoff games. Expectations were high for Krug in 2013-14, and he delivered with 40 points in 79 games, then essentially matched that production in 2014-15 (39 points in 78 contests). But this season so far, Krug not only hasn’t improved, but is actually below his career scoring pace.
Per Cap Friendly, both players will be RFAs this summer, with Krug counting $3.4M against the cap on his current one-year deal, compared to only $0.925M for Ristolainen, who’s finishing his ELC.
Ice Time
|
Season |
Total Ice Time per game (rank among team’s defensemen) |
PP Ice Time per game (rank among team’s defensemen) |
SH Ice Time per game (rank among team’s defensemen |
|
2015-16 |
25:11 (R.R.) – 1st 21:25 (T.K.) – 2nd |
2:50 (R.R.) – 1st 3:10 (T.K.) – 1st |
2:32 (R.R.) – 1st 0:49 (T.K.) – 6th |
|
2014-15 |
20:36 (R.R.) – 4th 19:35 (T.K.) – 4th |
2:00 (R.R.) – 3rd 2:37 (T.K.) – 1st |
1:18 (R.R.) – 6th 0:11 (T.K.) – 10th |
|
2013-14 |
19:07 (R.R.) -5th 17:30 (T.K.) – 7th |
1:38 (R.R.) – 5th 2:30 (T.K.) – 1st |
1:22 (R.R.) – 7th 0:15 (T.K.) – 9th |
These numbers come close to speaking for themselves, as what we have are two young up and coming players who, with each season, are deservedly seeing more Ice Time. But whereas Krug’s gains have been more linear, Ristolainen’s Ice Time exploded from last season to 2015-16, with an increase of roughly 20% in Total Ice Time and 40% in PP Ice Time. Both players have seen their undesirable SH Ice Time also increase, with Ristolainen’s nearly doubling and Krug’s going from next to nothing to almost a minute per game; but that’s a small price to pay for more Ice Time overall.
With added Ice Time one would expect Krug to be doing better – not worse – than his prior two seasons, especially with him being on a one year deal. Perhaps it’s a case of a player having gone from nearly all sheltered minutes to more “tough” minutes? His OZ% should be telling. Ristolainen’s Ice Time lends some legitimacy to his breakout, although we’ll have to ensure he’s not benefitting from unsustainable good luck.
Secondary Categories
|
Season |
PIM (per game) |
Hits (per game) |
Blocked Shots (per game) |
Shots (per game) |
PP Points (per game) |
|
2015-16 |
0.28 (R.R.) 0.42 (T.K.) |
1.60 (R.R.) 0.71 (T.K.) |
1.56 (R.R.) 1.29 (T.K.) |
2.36 (R.R.) 3.08 (T.K.) |
0.28 (R.R.) 0.23 (T.K.) |
|
2014-15 |
0.33 (R.R.) 0.25 (T.K.) |
1.51 (R.R.) 0.96 (T.K.) |
1.74 (R.R.) 0.87 (T.K.) |
1.55 (R.R.) 2.63 (T.K.) |
0.11 (R.R.) 0.18 (T.K.) |
|
2013-14 |
0.17 (R.R.)
📢 advertisement:
0.35 (T.K.) |
1.94 (R.R.) 0.63 (T.K.) |
0.94 (R.R.) 0.97 (T.K.) |
1.53 (R.R.) 2.31 (T.K.) |
0.00 (R.R.) 0.24 (T.K.) |
Although Krug’s scoring pace has dipped in 2015-16, he’s on target for career high rates in PIM and Blocked Shots, and, perhaps most importantly, in SOG. In fact, as of the all-star break Krug sat in the top five among all defensemen in SOG, ahead of the likes of Erik Karlsson, P.K. Subban, Roman Josi, and Shea Weber. Beyond that, only one other d-man (Alex Pietrangelo) within the top 16 in rearguard SOG had fewer than 28 points, suggesting Krug might indeed be suffering from bad puck luck, especially when his PPP per game rate is still solid.
Ristolainen was already a multi-cat stud in the making; and sure enough, even though he’s made gains in points, he’s still above 1.5 Hits and 1.5 Blocked Shots per game and now above two SOG per game. That puts him in special company, as through the break only Kris Letang met the same criteria while having posting more points per game than Ristolainen. One concern is Ristolainen’s PPP rate being above one per four games. That rate would make sense for Krug, what with him being on PP1 for a Bs team sitting second in PP %; however, the Sabres actually are sixth in PP%, so it might be that Ristolainen’s PPP rate is legitimate. We’ll check his 5×4 IPP below.
Luck-Based Metrics
|
Season |
PDO/SPSV (5×5) |
Offensive Zone Starting % (5×5) |
IPP (5×5) |
IPP (5×4) |
|
2015-16 |
991 (R.R.) 1005 (T.K.) |
43.7% (R.R.) 55.6% (T.K.) |
55.2% (R.R.) 39.3% (T.K.) |
65.0% (R.R.) 54.5% (T.K.) |
|
2014-15 |
981 (R.R.) 1018 (T.K.) |
38.6% (R.R.) 60.3% (T.K.) |
29.6% (R.R.) 36.5% (T.K.) |
57.1% (R.R.) 68.4% (T.K.) |
|
2013-14 |
970 (R.R.) 1013 (T.K.) |
46.0% (R.R.) 66.2% (T.K.) |
30.8% (R.R.) 41.3% (T.K.) |
0.0% (R.R.) 75.0% (T.K.) |
Krug was able to retain his scoring output despite his OZ% dropping from 66.2% in 2013-14 to 60.3%, to 60.3% in 2014-15. But we have to keep in mind that although 66.2% was highest among all 147 d-men who played 60+ games in 2013-14, 60.3% was still 6th highest among the 144 d-men who played 60+ games last season. In other words, Krug’s OZ% went from being stratospherically high to somewhat lower but still incredibly high. And despite dropping to 55.6% OZ% for this season thus far, he remains in the top 10% of all 40+ game rearguards (13th out of 115).
In short, Krug is still playing very sheltered minutes. Nevertheless, so far this season Krug looks to have been more negatively influenced by unsustainably bad luck (in the form of 5×4 IPP and Shooting %) than benefitted from good luck (via OZ%).
Over the past two campaigns, Krug’s had a sustained and much higher 5×4 IPP – average of 71.7%. Had it been that high in 2015-16 thus far, he’d have tallied four more points. And Krug’s shooting % in 2013-14 and 2014-15 averaged to 6.7%, versus just 2.0% so far this season. Had he fired the same number of SOG in 2015-16 but instead seen his normal 6.7% find the back of the net, the result would’ve been seven more goals just so far. Suddenly, we’d be talking about Krug with 33 points in 48 games (two more than Ristolainen has in 50 contests), rather than the mere 22 he’s actually posted. In other words, it appears Krug has been victimized by a significant amount of unsustainable bad luck. And even if we account for some benefit from his still high OZ%, he’s likely due to see better production over the remainder of 2015-16, and beyond.
Ristolainen’s 5×5 IPP of 55.2% is very high, placing him 6th among the 161 rearguards who played 500+ minutes at 5×5 through the break. In contrast, his 5×4 IPP ranks him 21st out of 46 d-men who skated 100+ minutes at 5×4 this season. What scoring impact might his high 5×5 IPP be having? If his 5×5 IPP was equal to Krug’s (49th out of 161), that would translate to five fewer points, putting Ristolainen at a good but not great 26 points in 50 games.
But as with Krug, there’s a silver lining. Ristolainen’s OZ% is 43.7%, which is 20th lowest among the 115 rearguards who’ve played 40+ games in 2015-16. Beyond that, not only does no defenseman with a lower OZ% have more points, but the lowest OZ% of any d-man who’s scoring more than Ristolainen is Tyson Barrie (46.9% OZ%), with only one other higher scoring d-man having an OZ% lower than 50% (Roman Josi – 49.8%).
Who Wins?
The outlook is good for both players, albeit with each having a notable question mark. In the case of Krug, although his OZ% is down quite a bit this season as compared to 2014-15 and, especially, 2013-14, it’s still within the top 10% for top defensemen. Meanwhile, Ristolainen has a very high 5×5 IPP, in fact ranking higher statistically among defensemen than Krug’s 2015-16 OZ%. Then there’s the issue of Ristolainen’s production having hit something of a wall, with only seven points in his last 17 games leading up to the all-star break.
But Ristolainen has done all this in 2015-16 despite an OZ% that’s remarkably low. Low OZ% can act as a barrier for a d-man to become productive in the first place; however, if a d-man is already productive despite a low OZ%, which essentially can only go up, that’s a very positive sign. Moreover, Ristolainen is somehow still owned in only 73% of Yahoo leagues, versus Krug at 89%. What this means is, poolies still think Ristolainen is not entirely for real – at least not yet. As a result, he represents more of a cost vs. value bargain than Krug.
Krug has what appear to be the tools (notably, his high SOG) to be a more productive d-man; but even accounting for some bad luck it’s troubling to see him having a worse season when he’s on a “prove yourself” one-year deal while getting more minutes with a still very high OZ%. The fact that he’s not stepped up his game under these circumstances is at least mildly troublesome.
Ristolainen is the winner in one-year leagues, since even accounting for a bit of a drop off for him and for the effects of less bad luck for Krug, he’d cost you less to obtain. Ristolainen also wins in keepers, as he’s shown he can produce despite such a low OZ%; plus he’s roughly 3.5 years younger than Krug and his stats are likely to be bolstered as the Sabres get better as a team, whereas Krug’s totals are already positively affected by the improved Bs offense. Plus, Krug’s OZ% figures to drop further in subsequent years both due to his maturity as a player and the likely deemphasizing of guys like Zdeno Chara (42.7% OZ%) and Dennis Seidenberg (53.9% OZ%), which won’t help matters.
Timing will be critical if seeking to acquire either player in a keeper. With Krug still owned in 89% of leagues, his asking price might be higher than expected for a player who’s admittedly underperformed for the season. If you wait to get him until later this season or over the offseason, then you risk him righting his ship, and driving his price back up. I’d consider him a hold overall, with the possibility of some buy low potential if he doesn’t salvage his season.
Ristolainen might cost you less to get now in a keeper than you might’ve imagined; but if he slumps over the rest of 2015-16, then his owners might be concerned he isn’t for real, which in turn would mean he could cost even less later this season or over the offseason. But if he regains his scoring touch, or the Sabres improve faster than expected, then his cost could spike. All things considered, you might want to act sooner rather than later.


 PHI
PHI ANA
ANA VAN
VAN DET
DET BUF
BUF NYR
NYR MIN
MIN L.A
L.A
