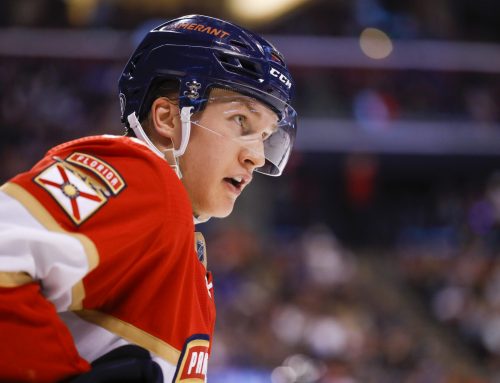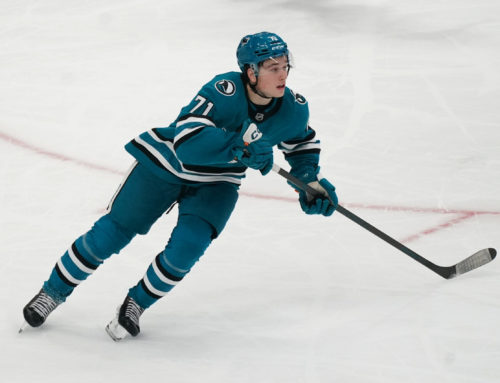
Sometimes best laid fantasy plans don’t pan out. Take the Maple Leafs and Rangers defensemen — this season, poolies grabbed Ryan McDonagh and Morgan Rielly, figuring they’d be in line for career best numbers. Not only did both fall short of lofty expectations, but fantasy attention shifted to Brady Skjei and Jake Gardiner, our Cage Match combatants for this week. Can Skjei and Gardiner continue to rise, or was 2016-17 a fluke season for one or both? Let’s find out – Cage Match starts now!
Career Path and Contract Status/Cap Implications
Skjei, 23, was drafted 28th overall in 2012; yet didn’t debut in the NHL until late 2015-16. Skjei put up a goose egg in seven regular season contests, then posted two points in five games during the 2015-16 playoffs, with 19:00+ of Ice Time in three games. Despite the departure of Keith Yandle and retirement of Dan Boyle, the Rangers opted not to sign a rearguard in the offseason, so clearly Skjei factored heavily into their 2016-17 plans. And sure enough he skated in 80 games and posted 39 points, with 18 of those points coming in his last 30 games.
Gardiner, 26, was also a first rounder (17th overall), but drafted four years earlier. An NHL mainstay by 2011-12, Gardiner had put up exactly 30 or 31 points in three of his four seasons of 75+ games, leaving many to wonder if that was his ceiling. This season, however, with a vastly improved supporting cast of forwards, Gardiner jumped to 43 points, besting Rielly’s total by 16. Gardiner also had 5-9 points in all but one month of the regular season, giving the Leafs – and poolies – long awaited consistency.
Skjei, despite being 23, will remain on his ELC through 2017-18, with a cap hit of $0.925M. Gardiner’s deal runs through 2018-19, dinging the cap at $4.05M and leaving him an under-30 UFA at completion.
Ice Time
|
Season |
Total Ice Time per game (rank among team’s defensemen) |
PP Ice Time per game (rank among team’s defensemen) |
SH Ice Time per game (rank among team’s defensemen |
|
2016-17 |
21:32 (J.G.) – 3rd 17:27 (B.S.) – 6th |
2:32 (J.G.) – 1st 1:23 (B.S.) – 3rd |
0:18 (J.G.) – 7th 0:17 (B.S.) – 7th |
|
2015-16 |
20:37 (J.G.) – 3rd |
2:19 (J.G.) – 2nd |
0:21 (J.G.) – 9th |
|
2014-15 |
20:58 (J.G.) – 4th |
2:29 (J.G.) – 3rd |
0:13 (J.G.) – 10th |
|
2013-14 |
21:04 (J.G.) – 2nd |
2:16 (J.G.) – 3rd |
0:37 (J.G.) |
I’m surprised Gardiner’s Ice Time in 2016-17 is aligned with past years. But before we rush to assume his higher production was due to unsustainable good luck, let’s not forget Toronto went from 192 goals in 2015-16 to 250 in 2016-17, a jump of 30% (nearly mirroring Gardiner’s 38% points increase). Plus, for the first time Gardiner had more PP Time than any other Toronto rearguard, and, at 26, he’s squarely in his prime. It’s also notable that of 61 d-men who averaged more Total Ice Time per game than Gardiner in 2016-17, only one (John Klingberg) had less SH Time per game and only four others (Torey Krug, Mike Green, Tyson Barrie, Justin Faulk) had less than 1:00 of SH Time per game, with each having scored at least 49 points in a season. Moreover, it’s significant that even as Gardiner’s per game Ice Time average increased in the playoffs, his SH Time stayed nearly non-existent. Thus, Gardiner should remain in an Ice Time sweet spot.
Skjei’s Ice Time for 2016-17 was far lower than I’d expected; however, he was trending better, as it took until game 17 of for him to play 19:00+ in a contest and game 41 to taste 20:00+ minutes. From game 41 onward, he played 20:00+ ten times, including four of his last six regular season games. On the other hand, despite his scoring success thus far in the playoffs his percentage of Ice Time per game is down compared to the regular season, although on the plus side – and like Gardiner – Skjei’s already low SH Time has dropped even further.
By producing as many regular season points as he did despite such low Ice Time, Skjei has few fantasy parallels. In fact, since 2005-06 only five other d-men tallied 39+ points while averaging less than 18:00 of Ice Time per game in a season – Mark Streit (2007-08), John-Michael Liles (2006-07), Brian Campbell (2005-06), Kurtis Foster (2009-10), and Torey Krug (in 2013-14). Looking closely at the five, only one (Krug) did so while younger than 26, and Krug was also the only one who averaged less than 3:50 per game on the PP, although in Krug’s case he still received 1:07 more PP Time per game than Skjei.
What does this mean? It could suggest Skjei has room to be even better in fantasy, or that he was lucky in doing as well as he did. Moreover, with the Rangers having sat out last summer’s UFA d-man market, they might go all in this time around, in which case it could be Skjei whose value takes the biggest hit. In other words, while Skjei has room to see his Ice Time realistically increase, the potential for an increase often is a far cry from an actual increase, especially on a UFA-happy team like the Blueshirts.
Secondary Categories
|
Season |
PIM (per game) |
Hits (per game) |
Blocked Shots (per game) |
Shots (per game) |
PP Points (per game) |
|
2016-17 |
0.41 (J.G.) 0.52 (B.S.) |
0.84 (J.G.) 1.83 (B.S.) |
1.01 (J.G.) 0.86 (B.S.) |
1.55 (J.G.) 1.58 (B.S.) |
0.16 (J.G.) 0.08 (B.S.) |
|
2015-16 |
0.40 (J.G.) |
1.10 (J.G.) |
0.85 (J.G.) |
1.54 (J.G.)
📢 advertisement:
|
0.15 (J.G.) |
|
2014-15 |
0.30 (J.G.) |
1.38 (J.G.) |
1.05 (J.G.) |
1.26 (J.G.) |
0.10 (J.G.) |
|
2013-14 |
0.23 (J.G.) |
1.35 (J.G.) |
1.08 (J.G.) |
1.68 (J.G.) |
0.13 (J.G.) |
Skjei’s numbers are average or better, except for blocks and PPPts. Yet his woeful PP scoring could get better, as he had three of his seven PPPs in his last nine regular season games and received more than his 28.3% PP season-long usage in each of the last 23 regular season games during which New York had at least one PP opportunity. Then again, New York has used a 4F, 1D unit for PP1 for several seasons, so if Skjei isn’t that 1D he’ll be hard pressed to do better than seven PPPts. Of course Skjei tallied 32 non-PP points, so unless that was the result of unsustainable good luck it could continue or even improve.
Gardiner’s outputs have been steady (Blocks, SOG, PPPts), increasing (PIM), or dropping (Hits). The lack of improvement in SOG is concerning, as since 2005-06 there have been 180 instances of d-men who scored 45+ points, yet just 21 corresponded to players with fewer than 130 SOG. That, plus Gardiner already having healthy Ice Time, could mean he’s at or close to his points ceiling.
Another concern stems from how much of a hold he has on his top dog PP status. In the regular season, Nikita Zaitsev had 21% less PP Time yet finished with just one less PPPt. In the playoffs, Rielly’s PP Time per game doubled and he posted only two fewer PPPts than he did all 76 contests during the season. As with New York, here too the stakes are high, since the Leafs also tend to use one rearguard on PP1. And if Gardiner isn’t that lone d-man, it would likely take a major toll on his production.
Luck-Based Metrics
|
Season |
Team Shooting% (5×5) |
Offensive Zone Starting % (5×5) |
IPP (5×5) |
IPP (5×4) |
|
2016-17 |
9.11% (J.G.) 10.88% (B.S.) |
54.1% (J.G.) 58.3% (B.S.) |
32.9% (J.G.) 45.2% (B.S.) |
40.0% (J.G.) 46.2% (B.S.) |
|
2015-16 |
5.99% (J.G.) |
50.6% (J.G.) |
34.9% (J.G.) |
64.3% (J.G.) |
|
2014-15 |
6.10% (J.G.) |
46.7% (J.G.) |
35.9% (J.G.) |
66.7% (J.G.) |
|
2013-14 |
7.74% (J.G.) |
43.0% (J.G.) |
32.7% (J.G.) |
45.0% (J.G.) |
These numbers lend more legitimacy to Gardiner’s jump in production, as for the first time his 5×5 team shooting % was near the 9.00% average for NHLers. Plus, he responded to a jump in OZ% and his IPPs were reasonable. The issue is, his 5×5 team shooting % and OZ% probably are close to maxed out. Plus, the team has several options for the 1D spot on PP1, including Zaitsev, who not only produced nearly as well as Gardiner despite far less PP Time, but also had a higher 5×4 team shooting % (15.19 vs. 14.12%).
We have only one season’s worth of data for Skjei, yet we can still draw conclusions. Most glaringly, Skjei had the highest 5×5 team shooting % among all 133 d-men who played 1000+ minutes at 5×5 last season. But at least part of that is based on his team, since McDonagh led all 1000+ minute d-men in 2015-16; and despite seeing his % drop considerably his points total rose, so this isn’t necessarily an indication of production-affecting good luck for Skjei. That being said, Skjei’s OZ% indicates he played very protected minutes; if he gets more Ice Time, it’s all but assured his OZ% will drop, making it tougher to get points in the minutes he plays. On the plus side, Skjei’s 5×5 IPP was 13th among 133 d-men who played 1000+ minutes at 5×5 in 2016-17, and his 1.41 points per 60 minutes was behind only Erik Karlsson, Brent Burns, and Dougie Hamilton. Even his 5×4 team shooting % was healthy – landing him 10th among 70 d-men who played 100+ minutes at 5×4. Overall, Skjei might’ve seen his stats padded by good luck; however, this data also suggests he’s a talented player.
Who Wins?
At this point, I’d label Skjei as an “at best” player, where, if I was to talk about what to expect from him production-wise, I’d use a phrase like “we can’t be exactly sure how he’ll do given the uncertainties, but at best I’d probably peg him as…” What that means is although we could have a reasonable guess as to how well he could do if everything works out as well as it possibly could, at the same time he’s not someone who has a safe floor to his production.
In contrast, Gardiner does have a floor, which is the 30-31 points he produced when he played for a much worse team, had unlucky team shooting %, and wasn’t the top d-man option on the PP. So he’s more of an “at worst” player, where you can say that even if everything works out as badly for Gardiner as it possibly could (barring injury), we can be confident he won’t produce worse than 30 points.
So how does this factor into choosing a winner? It tilts the scales in favor of Gardiner, since although it’s possible Skjei could conceivably improve if given more Ice Time and a regular PP shift, a lot would have to happen for him to truly excel along those lines. Plus, although he had impressive metrics like 5×5 IPP and team shooting percentages at 5×5 and 5×4, he also was gifted a very high OZ% and doesn’t have the track record or pedigree to ensure he’s reliable enough for poolies, especially since New York could be poised to bring in an UFA offensive rearguard this summer.
Unless you’re in a risk/reward situation, I’d shy away from Skjei, and might even try to “sell high” on him if you’re going for a keeper league win this season, replacing him with an “at worst” player. Meanwhile, Gardiner’s situation should be watched closely, since if he loses his grip on PP1 he’d have a hard time getting back to 40+ points yet still would be a candidate for selling somewhat high by using his 43 point in 2016-17 to entice another GM to take him in trade. In one year leagues, I worry both will be priced too high for what they’ll likely give you, so be prepared to let someone else overpay but also to grab them if the draft value somehow is there.
2 Comments
Leave A Comment
You must be logged in to post a comment.


 SEA
SEA NYI
NYI BUF
BUF DAL
DAL
 CBJ
CBJ STL
STL L.A
L.A NYR
NYR ANA
ANA FLA
FLA

Nice read Rick! I actually sold high on Skjei myself. I sent him, Ekholm and Ryan to a manager for Yandle. Considering my limited keeper spaces, this was a no-brainer, but I think even without a set number of spots, I would have probably preferred quality over quantity anyways.
I still think that Skjei is a talented young D, however, his current offensive output is a tad higher than what we can expect for years to come.
That’s a great trade IMO – as I mentioned in my recent Goldipucks column Yandle is poised to really hit the ground running in 2017-18 and should be head and shoulders above any of those three guys. Well done.