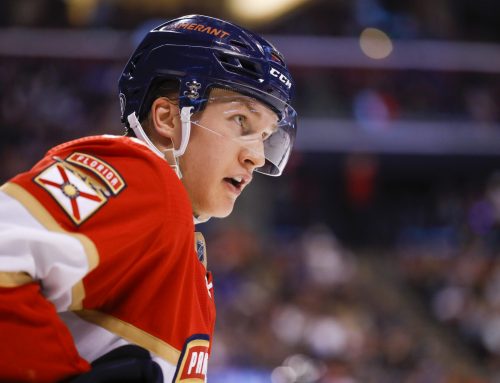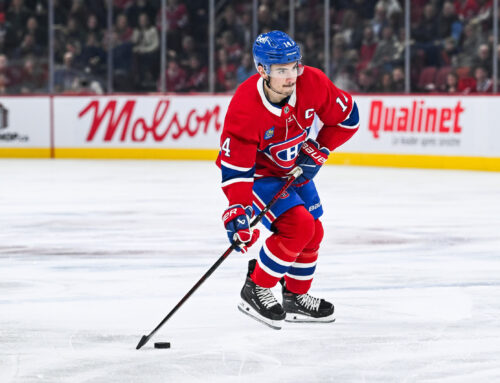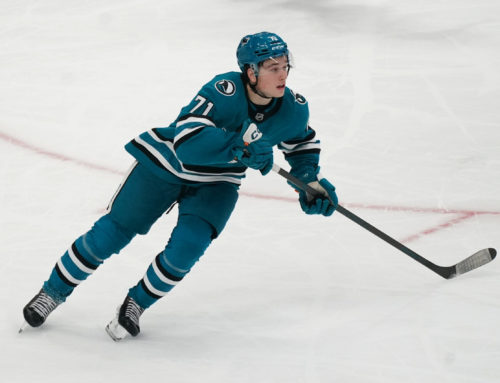
Who is the better fantasy own: Tanner Pearson or Jason Zucker?
Among the types of players that frustrate poolies are those who’ve done well enough to open our eyes yet whose future is still unclear. Two examples for summer 2017 are this week’s combatants, Jason Zucker and Tanner Pearson. Both set career scoring highs in 2016-17; but it’s still difficult to tell what’s in store for them. Can they be consistent 50+ point players? How about 60+? Cage Match is here to help shed valuable light on the situation.
Career Path and Contract Status
Zucker, 25, was selected 59th overall in 2010 and opted to play NCAA hockey. He produced above a point per game in both college campaigns, even earning a brief cameo with the Wild in spring 2012 (two points in six games). Over the next two seasons, Zucker starred in the AHL (63 points in 77 games) yet didn’t gel with the Wild (ten points in 41 games). Nevertheless, by 2014-15 he was in the NHL to stay, thanks to 26 points in 51 games during that campaign. In 2015-16 he slumped to three fewer points in 20 more games, only to see his output spike to 47 points in 79 games this season, featuring a run of 31 points in 34 games from late November until early February.
Pearson, who turns 25 this summer, was drafted in the first round (30th overall) but not until age 20 and following a huge jump from 42 points in 66 OHL games to 91 in 60 contests. His pro journey mirrored Zucker’s in that there was immediate AHL success (79 points in 105 total games) but no cemented spot in the NHL until 2014-15. Pearson secured his NHL job by posting 12 points in 24 playoffs games for the Kings in 2014 as part of “That 70s line” with Jeff Carter and Tyler Toffoli. Unfortunately, 2014-15 was injury-plagued for Pearson, and he struggled to only 16 points in 42 games. In 2015-16 he rebounded to 36 points in 79 contests, then upped his total to 44 in 80 contests in 2016-17. Like Zucker, Pearson’s still modest 2016-17 production belies a nice hot streak, in his case 16 points in 17 games from late January until early March.
Zucker is signed through 2017-18 at a $2.0M cap hit, then will become an arbitration-eligible RFA, while Pearson’s newly inked extension brings with it a $3.75M yearly cap hit through 2020-21.
Ice Time
|
Season |
Total Ice Time per game (rank among team’s forwards) |
PP Ice Time per game (rank among team’s forwards) |
SH Ice Time per game (rank among team’s forwards) |
|
2016-17 |
15:17 (J.Z.) – 7th 16:19 (T.P.) – 5th |
0:14 (J.Z.) – 9th 2:24 (T.P.) – 3rd |
0:36 (J.Z.) – 8th 1:05 (T.P.) – 7th |
|
2015-16 |
15:34 (J.Z.) – 7th 14:27 (T.P.) – 8th |
0:55 (J.Z.) – 8th 0:58 (T.P.) – 9th |
0:29 (J.Z.) – 9th 1:11 (T.P.) – 7th |
|
2014-15 |
15:03 (J.Z.) – 7th 13:17 (T.P.) – 11th |
0:50 (J.Z.) – 7th 1:30 (T.P.) – 5th (tied) |
1:07 (J.Z.) – 7th 0:27 (T.P.) – 9th |
Zucker seems trapped in an ice time friendzone. Despite posting only two fewer points in 79 games in 2016-17 than he did in 122 combined games in 2014-15 and 2015-16, he had his second worst total ice time and by far his worst PP time. And despite now being a veteran of 248 NHL games, he’s never averaged even 16:00 of ice time per game or 1:00 on the PP in any season.
The silver lining is when Zucker was red hot from late November to early February, he was rewarded with 1:00+ above his full season total ice time average in nearly half those games (15 of 34). But that’s a suboptimal chicken and egg situation, where seemingly he can produce if he gets ice time, yet once he goes cold his ice time declines again, making it so he can’t produce. Before we write Zucker off, let’s keep in mind his ice times could increase once he gets an RFA raise. He also stands to see his situation improve organically, since Zach Parise is the only major Wild forward signed beyond 2020-21, although of course the team will restock its cupboards to at least some extent as players depart.
I was surprised to see the significant jumps Pearson had this season. The good news was he produced better in response; however, was a six-point gain enough? Apparently the team thinks so, what with paying him $15M over the next four seasons. Still, he’s not paid so much, nor has he historically produced enough, to 100 percent lock himself into a bulletproof top role.
Moreover, even if Pearson’s spot is somehow solidified in stone, it’s on a team which lacks offensive firepower, having last finished in the top ten in team goals for a full season way back in 2009-10 and stuck 25th or worse in three of the subsequent six full seasons. Moreover, poolies hoping for offensive floodgates to open now that longtime coach Darryl Sutter is gone should remember that new coach John Stevens has been a Kings’ assistant for many years, and thus could stick with (or, if things go south, revert to) familiar systems emphasizing defense-mindedness. Plus, even if Stevens wants to loosen the defensive reins, Rome wasn’t built in a day. In other words, players used to a more defensive mindset might not adapt well, at least from the start, to a 180-degree shift in approach.
Secondary Categories
|
Season |
PIMs (per game) |
Hits (per game) |
Blocked Shots (per game) |
Shots (per game) |
PP Points (per game) |
|
0.38 (J.Z.) 0.16 (T.P.) |
0.92 (J.Z.) 1.55 (T.P.) |
0.53 (J.Z.) 0.38 (T.P.) |
2.17 (J.Z.) 2.33 (T.P.) |
0.01 (J.Z.) 0.10 (T.P.) |
|
|
2015-16 |
0.28 (J.Z.) 0.22 (T.P.) |
1.17 (J.Z.) 1.31 (T.P.) |
0.46 (J.Z.) 0.43 (T.P.)
📢 advertisement:
|
2.22 (J.Z.) 1.73 (T.P.) |
0.03 (J.Z.) 0.05 (T.P.) |
|
2014-15 |
0.35 (J.Z.) 0.33 (T.P.) |
1.31 (J.Z.) 1.09 (T.P.) |
0.25 (J.Z.) 0.21 (T.P.) |
2.43 (J.Z.) 1.62 (T.P.) |
0.02 (J.Z.) 0.02 (T.P.) |
Overall, the numbers for both have been pretty consistent, with the exceptions being trends in hits (up for Pearson, down somewhat for Zucker) and SOG (also up for Pearson, down for Zucker). In Pearson’s case the gains were expected, to mirror increasing ice time. For Zucker, since his Ice Time has stayed constant it’s not ideal to see him with diminishing output in Hits and, especially, SOG.
Zucker’s PPPt numbers can be forgiven due to him being essentially on the outside looking in when it comes to the man advantage. But at this point we must wonder if there’s room for a player like him to become part of the PP equation even if others ahead of him on the PP ladder leave and aren’t replaced. Or beyond that – can there indeed be a path to long-term fantasy success for Zucker?
A way to assess Zucker’s situation is to liken it to others. Since 2005-06, there’ve been just six other instances of forwards who, under age 30, had 45+ points in a campaign despite only 0-3 PPts. Among them is one whose career has likely ended prematurely due to injury (Dave Bolland), only one (Brandon Saad) who’s never scored 62+ points in at least one other season, one who had a couple of solid years (Alex Burrows), one who was a fantasy success for a while (Andrew Ladd), one who’s now elite (Brad Marchand), and another whose career is seemingly on the rise (Mike Hoffman). What this shows is players who manage 40+ even strength points in a season are indeed talented and normally find fantasy success if they ultimately get the ice time – including on the PP – to help make it happen.
For Pearson, year-to-year SOG increases are a positive. But his scoring hasn’t kept pace, as in 2016-17 he finished tied for 67th among forwards in SOG yet 120th in points. Only seven of the 66 ahead of him in SOG had fewer points, so if he continues to shoot more points should come. Beyond that, only three of the 66 had fewer than his eight PPPts, so the worry is whether LA would continue to bestow valuable PP time upon Pearson given his struggles to produce with the man advantage. Helping him is the fact that despite his struggles he tied for third among team forwards in PPPts; but his 2.25 points per 60 minutes at 5×4 was by far the lowest of eight Kings forwards who received 50+ minutes of PP time.
Luck-Based Metrics
|
Season |
Personal Shooting Percentage |
Team Shooting % (5×5) |
IPP (5×5) |
IPP (5×4) |
Offensive Zone Starting % (5×5) |
|
2016-17 |
12.8% (J.Z.) 12.8% (T.P.) |
11.82% (J.Z.) 6.99% (T.P.) |
67.7% (J.Z.) 73.0% (T.P.) |
50.0% (J.Z.) 29.2% (T.P.) |
41.6% (J.Z.) 57.9% (T.P.) |
|
2015-16 |
8.2% (J.Z.) 10.9% (T.P.) |
7.51% (J.Z.) 7.69% (T.P.) |
58.1% (J.Z.) 70.3% (T.P.) |
50.0% (J.Z.) 50.0% (T.P.) |
51.3% (J.Z.) 54.1% (T.P.) |
|
2014-15 |
16.9% (J.Z.) 17.6% (T.P.) |
8.36% (J.Z.) 9.02% (T.P.) |
78.6% (J.Z.) 60.9% (T.P.) |
33.3% (J.Z.) 25.0% (T.P.) |
54.7% (J.Z.) 55.3% (T.P.) |
Poolies should like what they see here for Pearson. His 5×5 IPP has been increasing with each season, including above the key 70% threshold in his two 79+ game campaigns. On top of that, his 6.99% team shooting % put him in the bottom 25% for forwards who played 900+ minutes at 5×5 in 2016-17, which means he was snake bit by likely unsustainable bad luck. Although his OZ% was a bit higher than his norm, it’s still within the ballpark. Overall, this data validates that Pearson appears to be a player on the rise, such that 50+ point production for 2017-18 should be a near lock and 55+ a very good possibility.
In contrast, Zucker’s full seasons have both ended with a 5×5 IPP below the 70% mark. On top of that, his 11.82% for team shooting % for 2016-17 was second highest among full time forwards, behind only Patrick Laine. Moreover, even Zucker’s most frequent linemate at 5×5 (Mikael Granlund) was at 10.52%, which, although quite high as well, was well below Zucker’s and barely in the top 20 among all regular NHL forwards. Thus, Zucker was lucky both in general, and as compared to his regular linemates. Some solace can be taken that he produced this well despite a very low OZ%, which only stands to improve. Unfortunately, this data as a whole doesn’t paint an optimistic picture for Zucker’s future.
Who Wins?
This is not an open and shut match, due to both players having several positives and negatives. For Pearson, he has what appears to be a safe spot within the top six, yet on a team that may still struggle to score even now that Darryl Sutter is gone. He also hasn’t been able to capitalize on increased PP time, but can likely breathe easy in that there’s no one in the wings who looks like they might push him aside from his plum PP role. He’s also shooting more and more with each passing season and becoming more of an offensive focal point, and should see some organic improvement once his team shooting percentage skews back toward normal level.
In Zucker we see a player who benefitted from unsustainable good luck and is shooting less and less each year, plus has no certain path toward getting any meaningful total or power-play Time. Yet we can’t ignore that he scored more than 40 even-strength points in 2016-17, and that other players who did so while similarly not producing on the PP all later managed to see their outputs climb – some substantially.
In the end, I’m giving the edge to Pearson due to Zucker having more warts. Zucker’s lure comes mainly from other players who had similar outputs and went on to success, yet in their cases that came with more ice time than he might get, plus a much healthier chunk of PP time than he stands to receive.
This all makes Zucker perhaps a more feast or famine choice. Give me Pearson – the guy who’s already tasted solid ice time and whose story points to more of a convincing upward trajectory.


 CHI
CHI SEA
SEA FLA
FLA DAL
DAL WPG
WPG CBJ
CBJ L.A
L.A DET
DET VAN
VAN ANA
ANA
