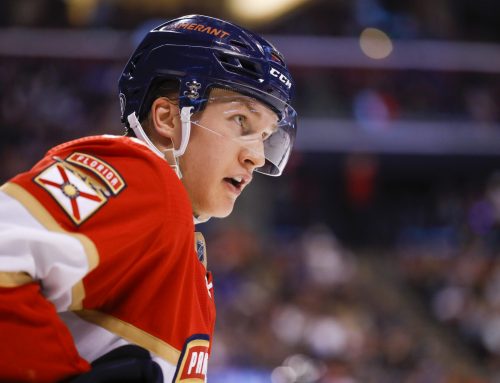
This week's Cage Match compares two second-line centers on struggling teams
With center being the deepest position in fantasy hockey, when poolies hear “second line center” let’s just say the first thing that comes to mind isn’t high expectations. But this week’s battle is between two pivots – Vincent Trocheck and Ryan Nugent-Hopkins – producing better than projected for 2017-18 despite being second bananas on their teams. Can one or both sustain (or even improve upon) their current scoring paces, and what do their futures hold? Let’s find out – Cage Match starts now!
Career Path and Contract Status
Trocheck, 24, was drafted 64th overall in 2011, and saw his production increase in each of his junior seasons, with his 109 points leading the OHL in scoring for 2012-13. After 42 points in 55 AHL games in 2013-14 and eight points in 20 games for Florida, most poolies figured he’d earned his NHL spot. But that wasn’t to be – not yet at least, as he was ticketed back to the AHL for 23 games, where he shined (19 points) and then once again had decent but not eye-opening NHL output (22 points in 50 games). Still, with nothing left to prove in the AHL, Trocheck logged a full campaign with Florida in 2015-16, posting 53 points in 76 games. He followed that with similar output last season (54 points in 82 games), giving the team solid scoring for their second line.
Nugent-Hopkins (“RNH”), also 24, was picked first overall in the same 2011 draft, and his 52 points in 62 games that season tied for the 8th best points per game output of any forward who played in 60+ contests as a rookie since 2000-01. Unfortunately, in his next two full seasons he played in 14 and 18 more games, yet only managed four more points (56) each campaign. After an injury-plagued 2015-16 (33 points in 56 games) RNH cratered to 43 points in 82 games last season, leaving poolies to wonder if he was even still fantasy-worthy on a squad that had Connor McDavid and Leon Draisaitl, plus added Ryan Strome in the offseason.
Trocheck’s contract runs through 2021-22 and carries a $4.75M annual cap hit, while RNH’s deal is more expensive ($6M per season) but ends a year earlier.
Ice Time
(2017-18 stats in this and the other tables are current through December 3 games)
|
Season |
Total Ice Time per game (rank among team’s forwards) |
PP Ice Time per game (rank among team’s forwards) |
SH Ice Time per game (rank among team’s forwards) |
|
2017-18 |
21:23 (V.T.) – 2nd 17:48 (RNH) – 4th |
3:42 (V.T.) – 4th 1:46 (RNH) – 5th |
2:06 (V.T.) – 3nd 1:48 (RNH) – 2nd |
|
2016-17 |
20:49 (V.T.) – 1st 17:41 (RNH) – 3rd |
2:43 (V.T.) – 3rd 1:53 (RNH) – 7th |
1:55 (V.T.) – 3rd 1:43 (RNH) – 3rd |
|
2015-16 |
17:46 (V.T.) – 5th 19:03 (RNH) – 2nd |
2:40 (V.T.) – 4th 2:36 (RNH) – 3rd |
0:47 (V.T.) – 6th 0:57 (RNH) – 6th |
|
2014-15 |
14:00 (V.T.) – 12th 20:38 (RNH) – 1st |
0:54 (V.T.) – 11th 2:43 (RNH) – 1st |
0:06 (V.T.) – 10th 1:38 (RNH) – 3rd |
For RNH, it’s a gloomy picture. First came two seasons of declining overall and PP ice times, and now we see data for 2017-18 that’s nearly identical to last season. Thus, unless he was unsustainably unlucky during 2016-17, his improved 2017-18 scoring might just be a temporary mirage.
On the other hand, Trocheck’s non-SH ice time numbers have risen with each passing season and are up yet again for 2017-18. And unlike RNH, we see a logical explanation for at least some of Trocheck’s production jump this season, as his PP time is up considerably along with his PP usage, which has risen from 49% to 65%. How is it that he’s seeing only the fourth most PP time among team forwards yet his PP time is up so dramatically? Two reasons – first, new coach Bob Boughner leans more on a true PP1 than the previous regime, plus Florida runs a first unit with four forwards.
Although I never like to make predictions based solely on ice time, this might be a lopsided match in favor of Trocheck. But matches can turn out closer than they first appear, so let’s see what the rest of the data says. Plus, if nothing else, it can give us insight we can use not just for these players but perhaps others as well.
Secondary Categories
|
Season |
PIMs (per game) |
Hits (per game) |
Blocked Shots (per game) |
Shots (per game) |
PP Points (per game) |
|
0.69 (V.T.) 0.44 (RNH) |
1.38 (V.T.) 0.70 (RNH) |
0.61 (V.T.) 0.66 (RNH) |
3.23 (V.T.) 2.18 (RNH) |
0.23 (V.T.) 0.15 (RNH) |
|
|
2016-17 |
0.52 (V.T.) 0.35 (RNH) |
2.00 (V.T.) 0.57 (RNH) |
0.61 (V.T.) 0.57 (RNH) |
2.78 (V.T.) 2.44 (RNH) |
0.14 (V.T.) 0.14 (RNH) |
|
2015-16 |
0.58 (V.T.) 0.33 (RNH) |
1.64 (V.T.) 0.71 (RNH) |
0.54 (V.T.) 0.65 (RNH) |
2.29 (V.T.)
📢 advertisement:
1.96 (RNH) |
0.17 (V.T.) 0.20 (RNH) |
|
2014-15 |
0.48 (V.T.) 0.32 (RNH) |
1.86 (V.T.) 1.21 (RNH) |
0.38 (V.T.) 0.48 (RNH) |
1.78 (V.T.) 2.48 (RNH) |
0.02 (V.T.) 0.18 (RNH) |
Frankly, I was expecting much worse SOG and PPPt numbers for RNH last season, yet his SOG rate was barely 10% less than in 2014-15 when he tallied 56 points, and his PP scoring was also only a tad lower. One way to better assess his 2015-16 data is via past comparables, which here means forwards who, like RNH in 2016-17, scored under 45 points in a season where they had 200+ SOG and 11+ PPPts in 75+ games. It turns out since 2006-07, there’ve been 24 other instances of forwards who fit all four criteria. Although several on the list had at least one 75+ point season in their career (Joe Pavelski, Brian Rolston, Todd Bertuzzi, Paul Kariya, Ryan Kesler, Daniel Sedin), in each case the campaign in which they met the four criteria either was within their first two in the NHL (Pavelski) or when they were age 29+ (the other listed five). Not good news for RNH, who achieved this “feat” in his fifth season at age 23.
There is consolation in that a number of others on the list did manage 60+ points at least once in their career; however, several were/are much higher volume shooters that RNH (Nazem Kadri, Bill Guerin, Radim Vrbata), one (Mike Knuble) reached 60 due to riding coattails of highly skilled linemates, and arguably only one (Tomas Plekanec) is even somewhat comparable to RNH, yet in his case he reached 60+ when he was more of a first line center. Long story short, these comparables do not bode well for RNH becoming a 60+ point player this season or perhaps even down the road.
Speaking of Kesler, we can see why some are anointing Trocheck the next Kesler due to his multi-cat stat stuffing. In fact, last season Trocheck became the only NHLer other than Kesler since 2006-07 to post, in the same season, 50+ Blocks, 150+ Hits, 500+ FOW, all while averaging 2.75+ SOG per game. In terms of scoring metrics, however, we don’t quite see the jumps in SOG and PPPts thus far for 2017-18 that would explain Trocheck – who’s let’s not forget has never even scored 55 points in a season – now being a nearly point-per-game player, so we’ll have to be on the lookout for unsustainable luck metrics, which we’ll check for next.
Luck-Based Metrics
|
Season |
Personal Shooting % |
Team Shooting % (5×5) |
Individual Points % (IPP) |
Offensive Zone Starting % (5×5) |
Average Shot Distance |
Secondary Assists % |
|
2017-18 |
11.9% (V.T.) 16.9% (RNH) |
8.63% (V.T.) 9.23% (RNH) |
68.6% (V.T.) 73.1% (RNH) |
39.6% (V.T.) 57.7% (RNH) |
26.5 (V.T.) 27.2 (RNH) |
50% (V.T.) 67% (RNH) |
|
2016-17 |
10.1% (V.T.) 9.0% (RNH) |
6.9% (V.T.) 6.35 (RNH) |
66.7% (V.T.) 72.9% (RNH) |
49.9% (V.T.) 50.4% (RNH) |
30.2 (V.T.) 27.2 (RNH) |
48% (V.T.) 44% (RNH) |
|
2015-16 |
14.4% (V.T.) 11.1% (RNH) |
10.0% (V.T.) 8.53 (RNH) |
74.6% (V.T.) 60.7% (RNH) |
48.4% (V.T.) 51.0% (RNH) |
25.5 (V.T.) 28.4 (RNH) |
39% (V.T.) 32% (RNH) |
|
2014-15 |
7,9% (V.T.) 12.7% (RNH) |
9.20% (V.T.) 9.54 (RNH) |
62.9% (V.T.) 67.5% (RNH) |
55.6% (V.T.) 61.9% (RNH) |
28.0 (V.T.) 28.8 (RNH) |
20% (V.T.) 53% (RNH) |
For RNH, the good news is last season he had solid metrics, suggesting he did the best he could under the circumstances, which, according to Frozen Pool, was mainly with slumping linemates Jordan Eberle and Milan Lucic. As for 2017-18, his OZ% is up, but not in uncharted territory, and his IPP is comparable to last year; however, secondary assists number is sky high and likely unsustainable. Overall, RNH is likely scoring at a slightly unsustainably high rate for this season, unless somehow he was to get onto the all-important Edmonton PP1, which seems like a longshot given the team’s other options.
For Trocheck, he’s producing this well despite a very low OZ%, which on the one hand is impressive yet on the other seems unsustainable. Beyond that, his IPP is below the 70% threshold for the third time in his three seasons and his secondary assists number is up for the third season in a row. Overall, this is the portrait of a player whose SOG and PP increases are sustainable, but with luck metrics indicting he cannot maintain his early-season torrid scoring pace, which likely explains why he’s already come back to earth somewhat (with just two points in his last five games) to fall below point-per-game scoring.
Who Wins?
I figured there’d be all sorts of signs that Trocheck’s early-season pace for 2017-18 was a mirage, yet I’d say he’s only mildly overachieving. With his SOG rate and PP1 spot, plus decent IPP and history of solid team shooting percentage, I think he’s likely a 65-70 point player.
How do I see Trocheck achieving that pace, which is above Kesler’s, when their roles are so similar? I think it boils down to differences in age, plus the fact that Trocheck is more of a driver of offense while on the ice, as manifested in his team shooting percentage running above the 8.5 in this season plus two of the last three, whereas Kesler’s hasn’t been higher than 7.57% since coming to Anaheim.
As for RNH, last season’s metrics show he still has talent, and it’s shining through more this season. With more regular minutes (especially on the PP) and upgraded linemates he could stand a chance at 60 points, although anything more would be a stretch. And even 60 isn’t guaranteed by any means, with the reality of his current circumstances, not to mention him never actually tallying more than 56 points in a season thus far.
Trocheck wins, by a landslide. Even still, I view him as a sell-high candidate in points-only leagues. If you have him in a kitchen sink category league though, sit back and prepared to be a very happy camper for years to come. RNH might be a soft-buy candidate, as his value stayed artificially high for so long due to being a former #1 overall pick that, if anything, he’s now viewed too negatively by poolies due to that same label.


 UTA
UTA MTL
MTL BUF
BUF MIN
MIN FLA
FLA VAN
VAN
 WSH
WSH SEA
SEA
