
It’s time for yet another battle between players with similar projections in the Fantasy Guide (which is still available for order here). This time it’s Kyle Palmieri, coming off his third straight season with a full season scoring pace of 54 to 58 points, against Gabriel Landeskog, who reversed a several season trend of diminishing points by tallying 62 in 2017-18. Who’s the better own this season and down the road? Cage Match is on the case and starts now!
Career Path and Contract Status
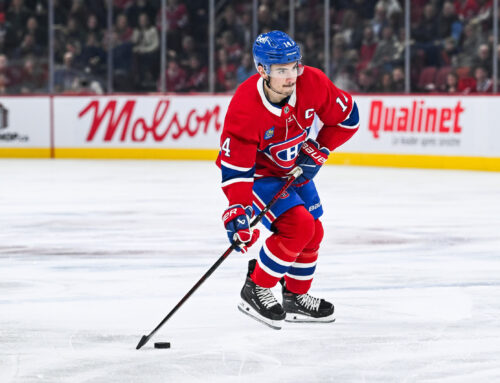
Landeskog, 25, was drafted second overall in 2011 and went straight to the NHL, where he posted a very respectable 52 points as a rookie. In his next full season (2013-14) he upped his total to 65, and poolies envisioned him on the fast track to stardom. Little did they know at the time, however, that Landeskog would amazingly see his point total drop in each of the next three seasons, first to 59, then 52, then all the way to 33 in 2016-17. But as alluded to above, last season he – like other Avs – reignited, and his scoring climbed all the way back to 62 points, with 18 of those points coming in his final 21 games.
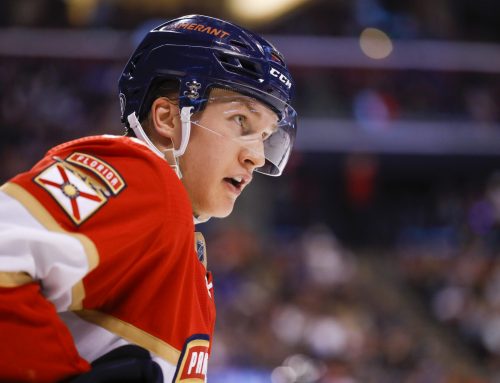
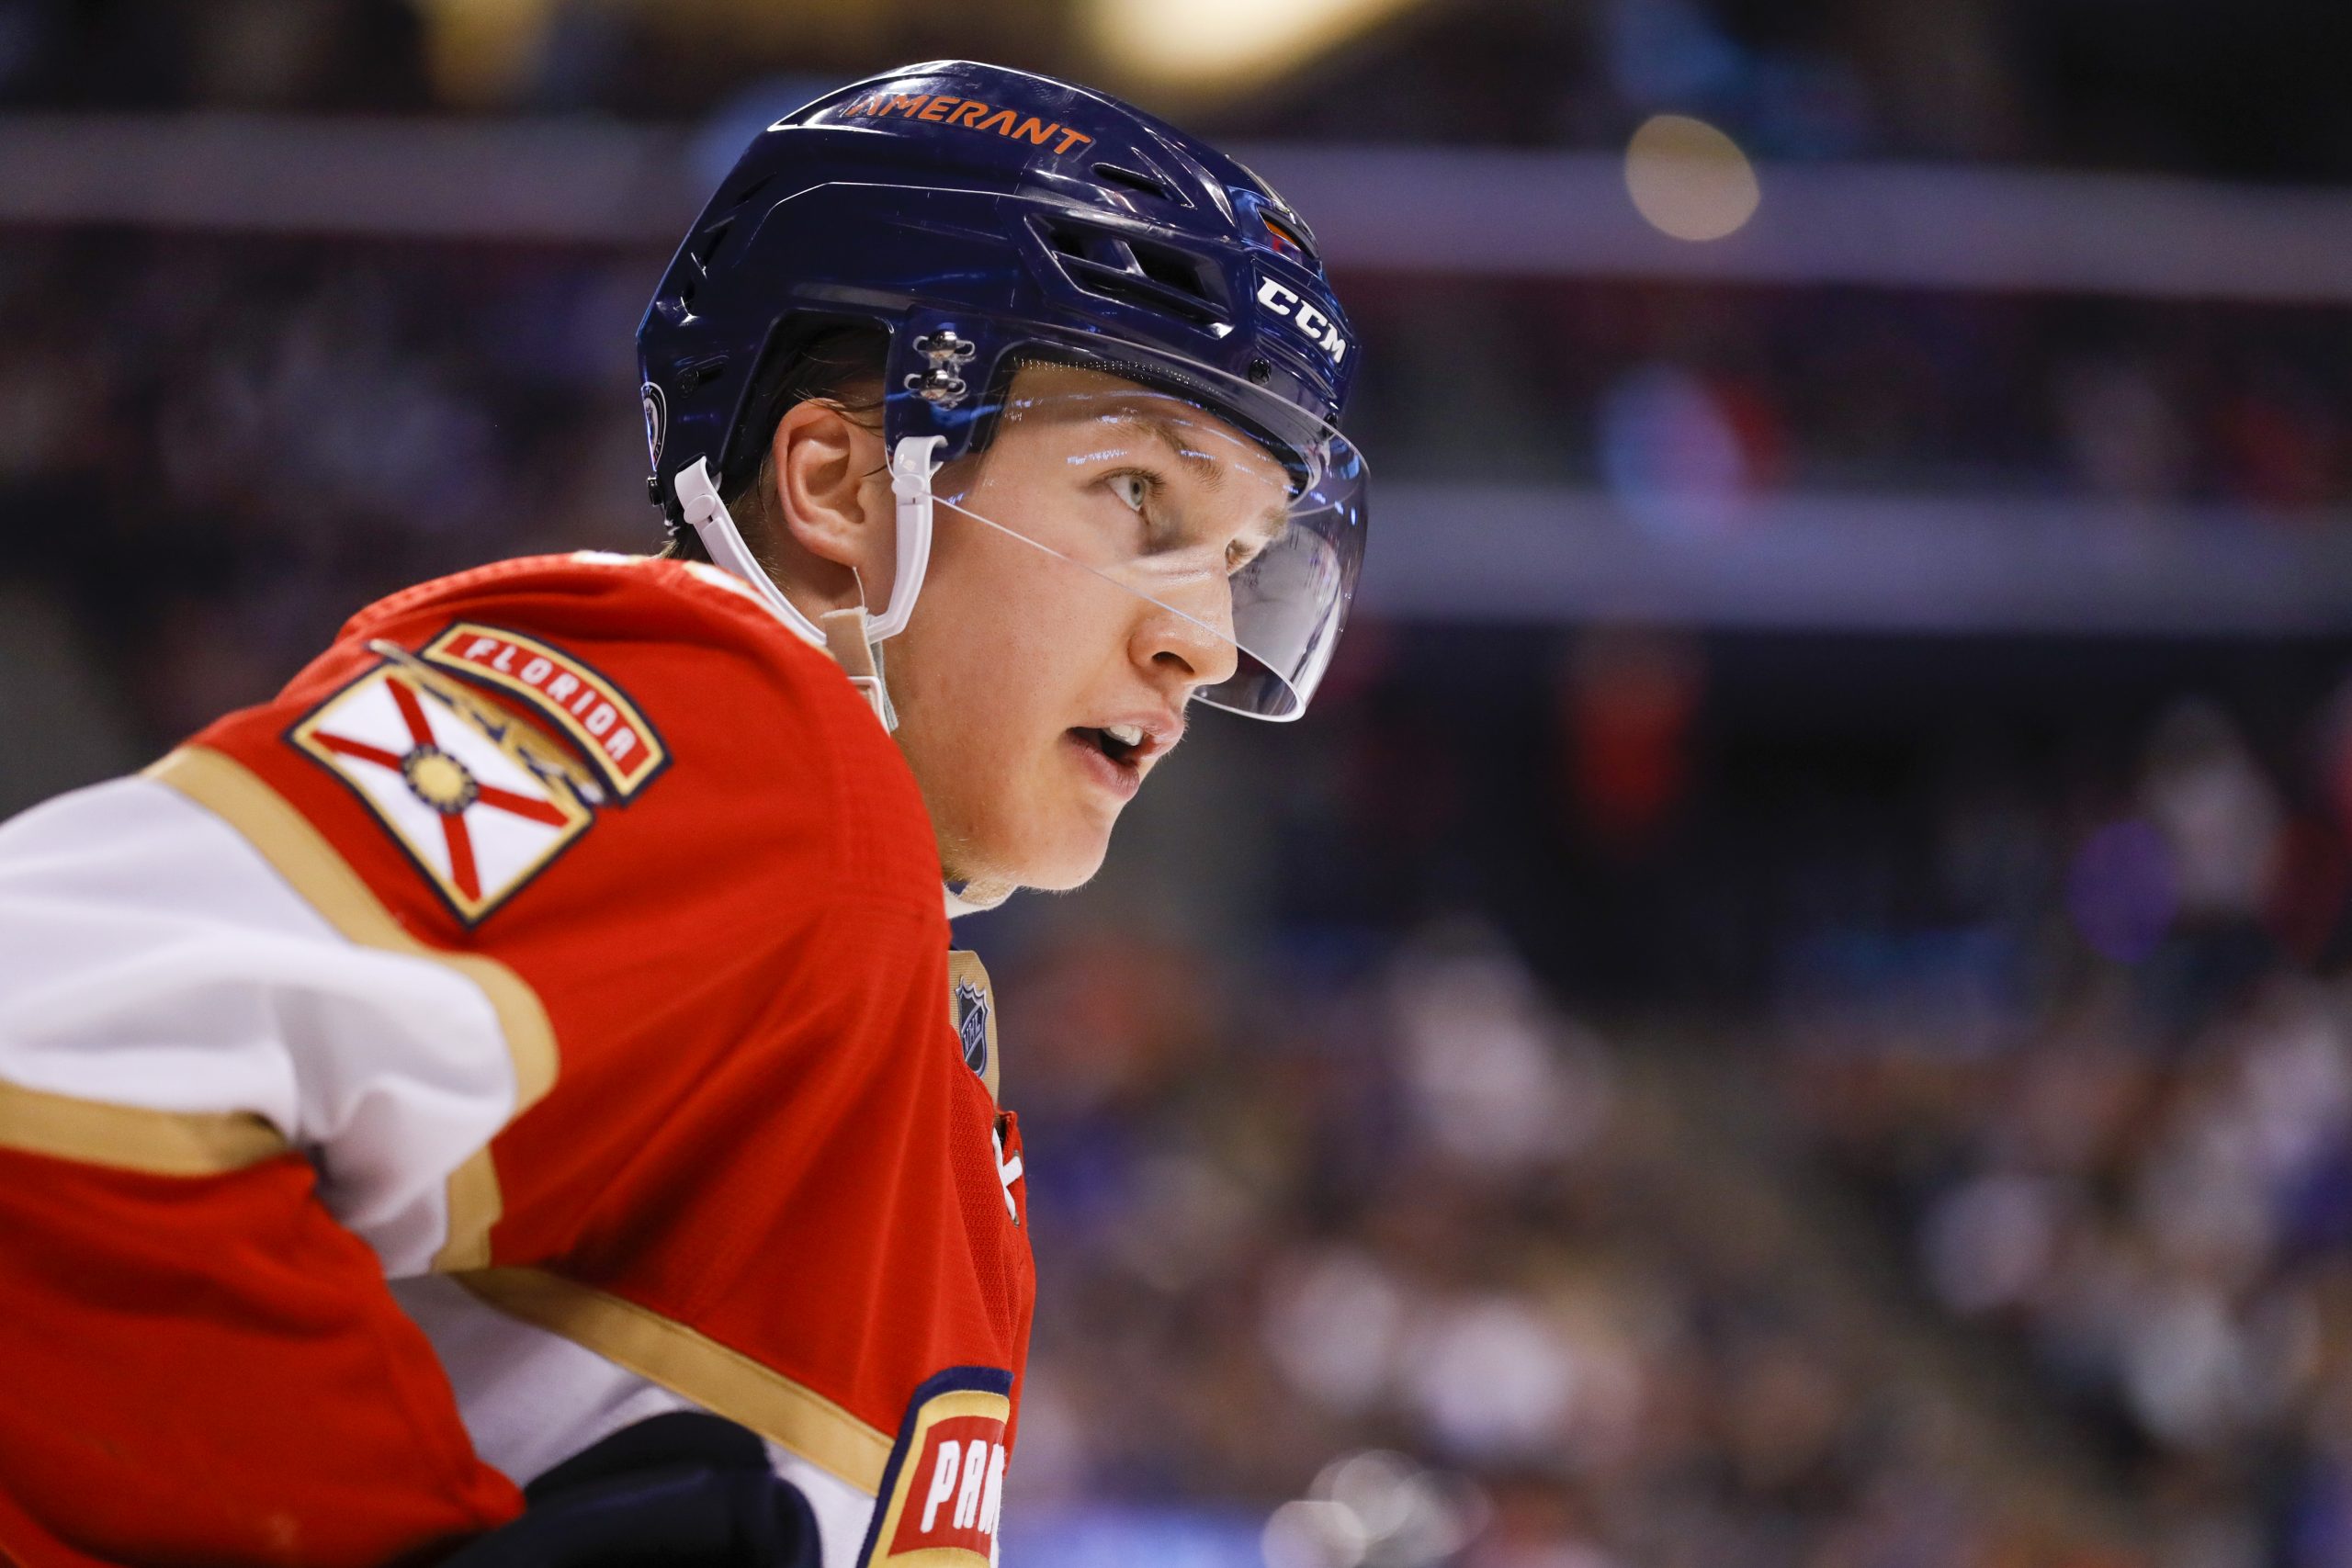
Palmieri, 27, was selected 26th overall in 2009 and played one year of college hockey before jumping into the pro ranks. Despite 134 points in 146 AHL games, Palmieri couldn’t find a home in the Ducks’ line-up until 2013-14. Once in the NHL, he didn’t take things by storm, with less than point per every other game output through his first two seasons (60 points in 128 games). But all that changed once he was traded to his hometown Devils, with whom he posted 57 points in 2015-16 and 53 in 2016-17. Last season he played only 62 games, yet his full season scoring pace was 58 points and he too finished strong, amassing 30 of his 44 points in his final 41 games.
Both players are signed through 2020-21, with Landeskog’s cap hit ($5.571M) being nearly 25 percent more than Palmieri’s ($4.65M). Both will be UFAs upon the expiration of their current deals.
Ice Time
|
Season |
Total Ice Time per game (rank among team’s forwards) |
PP Ice Time per game (rank among team’s forwards) |
SH Ice Time per game (rank among team’s forwards) |
|
2017-18 |
20:09 (G.L.) – 1st 17:19 (K.P.) – 4th |
3:35 (G.L.) – 3rd 2:47 (K.P.) – 4th |
1:07 (G.L.) – 6th 0:42 (K.P.) – 8th |
|
2016-17 |
18:47 (G.L.) – 2nd 17:21 (K.P.)- 4th (tied) |
2:21 (G.L.) – 4th 2:38 (K.P.) – 2nd |
1:47 (G.L.) – 2nd 0:57 (K.P.) – 7th |
|
2015-16 |
18:56 (G.L.) – 1st 17:48 (K.P.) – 5th |
2:45 (G.L.) – 5th 2:38 (K.P.) – 5th |
1:26 (G.L.) – 5th 0:38 (K.P.) – 7th |
|
2015-16 |
18:30 (G.L.) – 3rd 14:06 (K.P.) – 10th |
2:29 (G.L.) – 3rd 1:43 (K.P.) – 6th |
0:28 (G.L.) – 8th 0:00 (K.P.) |
When I saw Palmieri’s scoring rate had been virtually constant in New Jersey, I figured his ice times nevertheless might’ve varied season to season; yet as we can see they were constant too. And when I say constant I really mean constant, with his total varying less than 0:30 and his power-play time less than 0:10. Moreover, even as he was red hot at the end of last season he was still getting the same power-play and total ice times, suggesting he might’ve benefitted from unsustainable good luck over the short haul.
For Landeskog, it makes sense from what we see here that 2016-17 was his statistically worst season. Moreover, his ice times from 2017-18 were up enough from 2014-15 and 2015-16 to justify a jump into 60+ point territory rather than the 50s for those seasons.
In all, this data for both players is apparently straightforward. Even still, their SOG and PPPts metrics could show there’s more to things than what seemingly meets the eye, so let’s dissect those now.
Secondary Categories
|
Season |
PIMs (per game) |
Hits (per game) |
Blocked Shots (per game) |
Shots (per game) |
PP Points (per game) |
|
0.47 (G.L.) 0.48 (K.P.) |
1.91 (G.L.) 1.51 (K.P.) |
0.65 (G.L.) 0.80 (K.P.) |
2.34 (G.L.) 2.92 (K.P.) |
0.22 (G.L.) 0.37 (K.P.) |
|
|
2016-17 |
0.86 (G.L.) 0.57 (K.P.) |
1.98 (G.L.) 1.55 (K.P.) |
0.57 (G.L.) 0.45 (K.P.) |
2.34 (G.L.) 2.40 (K.P.) |
0.08 (G.L.) 0.23 (K.P.) |
|
2015-16 |
0.92 (G.L.) 0.47 (K.P.) |
1.88 (G.L.) 1.57 (K.P.) |
0.88 (G.L.) 0.62 (K.P.) |
2.25 (G.L.) 2.70 (K.P.)
📢 advertisement:
|
0.18 (G.L.) 0.28 (K.P.) |
|
2014-15 |
0.96 (G.L.) 0.65 (K.P.) |
2.06 (G.L.) 1.70 (K.P.) |
0.89 (G.L.) 0.42 (K.P.) |
2.61 (G.L.) 1.96 (K.P.) |
0.20 (G.L.) 0.19 (K.P.) |
Again, Landeskog’s 2016-17 would be expected to be his poorest season based on what we see here. Combine that with the lack of offense from the Avs that season, and it helps at least partially explain why he cratered to 33 points. Moreover, Landeskog had a slightly better output in PPPts in 2017-18 than 2015-16 and 2014-15. So here as well, his scoring trajectory appears to check out.
For Palmieri, despite him being a consistent top power-play performer, he saw his power-play scoring jump to a new stratosphere in 2017-18, along with his SOG rate. And sure enough all this came in the second half of 2017-18, during which he amassed 14 of his 23 PPPts and fired 115 of his 181 shots on goal. The question is whether poolies should see this as Palmieri – at age 27 – taking the next step and becoming a 65+ point player, or instead just a run of unsustainable good luck. Given his age, and with his ice time not jumping to match the increases, chances are this is good luck that won’t continue, but we’ll examine that next.
But before doing that, it’s worth examining their multi-cat contributions. As most poolies are already likely aware, Landeskog was a multi-cat stud. In fact, if we combine his outputs from the 2014-15 and 2015-16 seasons, there was no player who had more penalty minutes, hits, blocks and SOG per game than him, with only Ryan Kesler and David Backes besting him in three of the four categories (PIM, Hits, Blocks). And although Landeskog’s contributions in all but hits have come down somewhat, there’s no question he’s still a huge multi-cat asset.
As for Palmieri, he’s dropped penalty minutes with each passing season but his hits have remained nicely at or slightly above the 1.5 per game mark and 2017-18 saw him post his highest power-play points, shots and blocks. Long story short, these are players who you look for an excuse to draft in multi-cat leagues.
Luck-Based Metrics
|
Season |
Personal Shooting % |
Team Shooting % (5×5) |
Individual Points % (IPP) |
Offensive Zone Starting % (5×5) |
Average Shot Distance |
Secondary Assists % |
|
2017-18 |
13.7% (G.L.) 13.3% (K.P.) |
10.11% (G.L.) 7.93% (K.P.) |
51.2% (G.L.) 62.0% (K.P.) |
54.0% (G.L.) 52.7% (K.P.) |
27.8 (G.L.) 28.2 (K.P.) |
50% (G.L.) 59% (K.P.) |
|
2016-17 |
10.7% (G.L.) 13.5% (K.P.) |
6.24% (G.L.) 9.05% (K.P.) |
67.3% (G.L.) 67.9% (K.P.) |
47.6% (G.L.) 46.5% (K.P.) |
29.6 (G.L.) 28.9 (K.P.) |
50% (G.L.) 54% (K.P.) |
|
2015-16 |
11.8% (G.L.) 13.5% (K.P.) |
7.89% (G.L.) 7.80% (K.P.) |
69.7% (G.L.) 75.0% (K.P.) |
52.2% (G.L.) 42.6% (K.P.) |
32.1 (G.L.) 31.0 (K.P.) |
43% (G.L.) 46% (K.P.) |
|
2014-15 |
10.7% (G.L.) 12.5% (K.P.) |
8.97% (G.L.) 8.65% (K.P.) |
70.2% (G.L.) 72.5% (K.P.) |
43.1% (G.L.) 49.3% (K.P.) |
29.9 (G.L.) 26.8 (K.P.) |
37% (G.L.) 53% (K.P.) |
Focusing first on Palmieri, we see that his OZ% was a good bit higher for 2017-18 than past seasons; but unfortunately we can’t tell if that was the case all season long or weighted toward the end of the season when he was red hot. That being said, his IPP was a bit lower than his norm, which might have been a function of playing on a line with more talented players. The good news is he has a strong history of high IPP, so chances are even if he was to stay with those same players his share of points would rise at least slightly. What might balance that out in a negative way, however, is his 60% secondary assists percentage from last season, which indicated that he likely lucked into at least a few more points than he deserved. In all, this paints the picture of a player whose hot play at the end of the season wasn’t entirely unsustainable, yet also someone who, due to his history of consistent scoring on New Jersey, shouldn’t be expected to score much more than 60 points this coming season or in the near future.
Here too we see evidence as to why Landeskog’s 2016-17 was such a disaster, since as his scoring was cratering so too was his 5×5 team shooting percentage, which spiked last season thanks in large part to the line he was on. The good news is that line likely can stay in that high of a range; however, the bad news is if Landeskog was to remain on the line his IPP probably would stay in the low 60s due to the talent and ability to hit the scoresheet of his linemates Nathan MacKinnon and Mikko Rantanen. Also, Landeskog’s higher than normal secondary assists percentage last season further suggests he’s more of a space occupier on that line as opposed to a strong contributor. Accordingly, he probably shouldn’t be counted on for additional points this coming season and beyond, and perhaps even fewer, due to the talent around him and his inability to insert himself – as compared to them – into the scoring picture.
Who Wins?
Because for the most part the story checked out for each player, we should expect them to score roughly the same in 2018-19 as they did in 2017-18, with Palmieri perhaps receiving a slight boost in production to put him closer to Landeskog’s 62 point tally from last season. But here’s the thing – even if Palmieri wasn’t in line for a possible uptick in scoring, I’d nevertheless declare him to be the winner here, and it’s based on cost vs. value.
Landeskog’s cost had cratered; however, with his resurgence as part of one of the hottest and highest profile lines in hockey last season, not to mention poolies recalling Landeskog’s status as a former top two draft pick, the result will be expectations for him to score even more points this season than last. As such, his cost – which arguably would’ve already been higher than Palmieri’s – will climb even higher. Look no further than Yahoo drafts conducted thus far, which have Landeskog as, on average, the 100th player being selected, and Palmieri much farther down at 164th. Although to some extent Landeskog’s higher cost factors in his slight edge in multi-cat, it’s still too large of a gap for two players who likely will produce comparable scoring. As such, Palmieri is the winner of this match because he can provide you with comparable – or close to comparable – scoring output as Landeskog for a far lower price to draft and, presumably, in trade as well.
The gap is even wider in points-only leagues, whereas in dynasty keepers it shrinks a bit due to Landeskog being two years younger. You’d be justified in holding both players in keepers, although if someone was to blow you away with a trade offer for Landeskog that values him as a 70+ point player, you’d probably want to take that offer.
Related Posts

UPCOMING GAMES
Starting Goalies
Top Skater Views
| Players | Team | |
|---|---|---|
| ANDRE BURAKOVSKY |
| |
| JOE VELENO |
| |
| SAM BENNETT |
| |
| MAVRIK BOURQUE |
| |
| NIKOLAJ EHLERS |
| |
Top Goalie Profile Views
LINE COMBOS
| Frequency |
| |
|---|---|---|
| 25.9 | BRYAN RUST VILLE KOIVUNEN SIDNEY CROSBY | |
| 21.7 | RICKARD RAKELL EVGENI MALKIN DANTON HEINEN | |
| 21.0 | PHILIP TOMASINO JOONA KOPPANEN CONNOR DEWAR | |
DobberHockey Podcasts

Fantasy Hockey Life: Buffalo Sabres with Mike Augello
Michael Augello of The Hockey News and Hockey Hot Stove is here to report on the Buffalo Sabres. Jesse and Victor interview Michael about returning pros Tage Thompson, JJ Peterka, Alex Tuch, Jason Zucker, Jack Quinn, Ryan McLeod, Josh Norris, Jiri Kulich, Zach Benson, Rasmus Dahlin, Owen Power, Bowen Byram, Ukko-Pekka Luukkonen, James Reimer, and […]

Keeping Karlsson: Kreider Down South
Elan and Brian check in on the NHL playoffs (and the Keeping Karlsson Playoff Pool), announce a change to the draft rules for Season 11 of the Keeping Karlsson Ultimate Patron Fantasy League (KKUPFL), share thoughts on the one single relevant offseason transaction so far, and put a handful of 2024-25 breakout performances under the microscope to see if they’ll continue into 2025-26.
Fantasy Hockey Life: Montreal Canadiens with Ryan Szporer
Ryan Szporer is back to report on the Montreal Canadiens. Jesse and Victor interview Ryan about returning pros Nick Suzuki, Cole Caufield, Ivan Demidov, Juraj Slafkovsky, Patrik Laine, Lane Hutson, Mike Matheson, Kaiden Guhle, Sam Montembeault, and Jakub Dobes. In Cat’s Instincts, Cat Silverman of InGoal mag breaks down Jakub Dobes, Cayden Primeau, and Jacob […]
Fantasy Hockey Life: Chicago Blackhawks with Ben Pope
Ben Pope of the Chicago Sun-Times is here to report on the Chicago Blackhawks.
Fantasy Hockey Life: Detroit Red Wings with Max Bultman
Max Bultman of the Athletic is here to report on the Detroit Red Wings. Jesse and Victor interview Max about returning pros Lucas Raymond, Dylan Larkin, Alex DeBrincat, Patrick Kane, Marco Kasper, JT Compher, Elmer Soderblom, Andrew Copp, Vladimir Tarasenko, Moritz Seider, Simon Edvinsson, Erik Gustafsson, Cam Talbot and Alex Lyon. In Cat’s Instincts, Cat […]