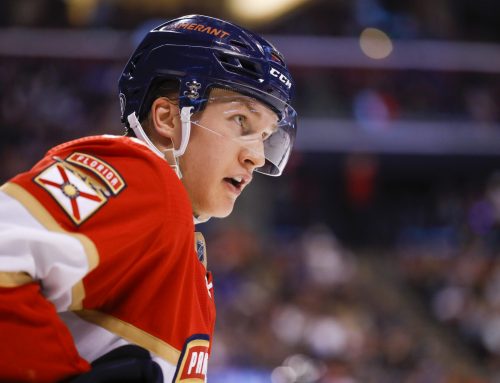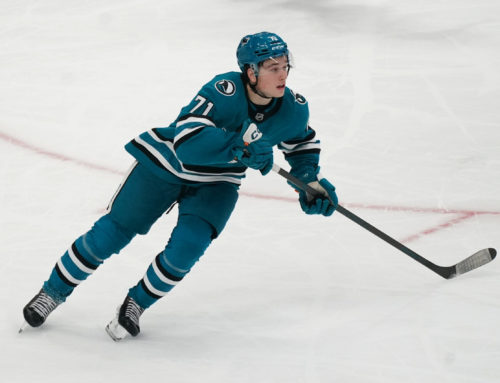
This weeks’ combatants are familiar fantasy names (Ryan O’Reilly and Matt Duchene) putting much bigger smiles on the faces of their owners this season than was expected. With more than a quarter of the 2018-19 campaign in the books, can we safely assume both will continue their torrid pace, or will one or both come back to earth? And what might be in store for them in future seasons? Cage Match is on the case and starts now!
Career Path and Contract Status
O’Reilly, 27, was selected 33rd overall in 2009, but despite this ended up going directly into the NHL for his age 18 season, posting 26 points. From there he saw his 82-game production rate increase in the next two campaigns, first just a tad to 29 points but then nearly doubling to 55. During the next three campaigns with the Avs, ROR was a strong two-way presence for a weak offensive team, managing between 55 and 64 points per season. An offseason 2015 trade saw ROR go to Buffalo, where he again posted points within that same range over the course of three seasons, but for arguably an even weaker team. He was then part of yet another offseason trade during the summer, this time to St. Louis, where thus far he’s shined (26 points in 22 games).
Duchene, also 27, was selected 30 spots ahead of ROR in the 2009 draft and also in the NHL that same season, except in his case he tasted immediate success with 67 points. After a blip in the production radar (28 points in 58 games), Duchene posted 113 points in his next 118 games, and looked like an NHL (and fantasy) star in the making at age 23. But then over his next two campaigns he bested his prior two season total by one point……. in 40 more games, and he followed that in 2016-17 with a mere 41 points in 77 games as trade rumors swirled. He finally was dealt – to Ottawa – a little over a year ago and after a shaky start played some of his best hockey to date, with 29 points in his last 30 regular season games for a struggling team. This season he’s stepped things up another notch, with 29 points in 23 games.
O’Reilly is on year three of a seven-year deal signed while still in Buffalo and dinging the cap at $7.5M per campaign, while Duchene’s contract counts $6M against the cap for 2018-19 before he becomes a UFA this summer.
Ice Time (data in this and the other tables is current through November 25)
|
Season |
Total Ice Time per game (rank among team’s forwards) |
PP Ice Time per game (rank among team’s forwards) |
SH Ice Time per game (rank among team’s forwards) |
|
2018-19 |
20:20 (ROR) – 1st 19:42 (M.D.) – 2nd |
3:20 (ROR) – 2nd 3:01 (M.D.) – 1st |
2:05 (ROR) – 2nd 0:28 (M.D.) – 6th (tied) |
|
2017-18 |
20:49 (ROR) – 1st 15:46 (M.D. – Col) – 7th 18:52 (M.D. – Ott) – 3rd |
3:36 (ROR) – 2nd 2:22 (M.D. – Col) – 7th 2:45 (M.D. – Ott) – 4th |
1:33 (ROR) – 4th (tied) 0:32 (M.D. – Col) – 7th 0:12 (M.D. – Ott) – 10th |
|
2016-17 |
21:28 (ROR) – 1st 18:18 (M.D.) – 3rd |
2:54 (ROR) – 4th 2:31 (M.D.) – 3rd |
2:20 (ROR) – 2nd 0:57 (M.D.) – 7th |
|
2015-16 |
21:44 (ROR) – 1st 18:35 (M.D.) – 3rd |
3:16 (ROR) – 1st 2:48 (M.D.) – 3rd |
2:05 (ROR)- 2nd 0:12 (M.D.) – 12th |
Despite an offseason change in scenery, ROR is still a minute muncher. That having been said, his power play and shorthanded ice times are comparable to his last three seasons in Buffalo, but his overall ice time is down slightly, calling into question his huge spike in scoring. To some extent he’s being propped up by the team around him, as the Blues – despite seeing the need to recently fire their coach – are on pace to score 249 goals, which would represent a 25% improvement over the of 199 or 198 goals that were scored by Buffalo over each of the past three campaigns. Raise ROR’s familiar 55-64 scoring rate by 25% and you get 69-80 points, which is a nice jump but far below his 97-point current scoring pace.
For Duchene, we can apply similar logic to explain his drop in scoring from 2015-16 to 2016-17 despite similar minutes. The Avs scored 212 goals in 2015-16, but only 165 for 2016-17. So Duchene’s 59 points amounted to hitting the scoresheet on 28% of team goals for 2015-16 (not counting missed games), and his 41 points in 2016-17 represented a barely lower 25% (again, not counting for games missed). So while poolies and pundits were busy deriding Duchene, his scoring actually wasn’t much below normal.
But how believable is Duchene’s scoring explosion this season? When he posted 70 points in 71 games in 2013-14, his TOI per game was 18:30 (2:44 on the PP), i.e., numbers comparable to his 68 games with Ottawa last season but which he’s above for 2018-19. Moreover, the 2013-14 Avs tallied 245 goals and 2017-18 Sens scored 217, whereas Ottawa is on pace for 296 this season, or 20% more than the 2013-14 Avs. Take point-per-game scoring and tack on 20% and you get 96 points, which is close to Duchene’s current 103-point pace. Overall, the fact that Duchene has a point-per-game season to his credit, plus scored at that rate last year for a less productive Ottawa team and is now on a more productive Ottawa team (both as compared to the 2013-14 Avs), seemingly gives his start more credibility than ROR’s.
Secondary Categories
|
Season |
PIMs (per game) |
Hits (per game) |
Blocked Shots (per game) |
Shots (per game) |
PP Points (per game) |
|
0.27 (ROR) 0.08 (M.D.) |
0.50 (ROR) 0.43 (M.D.) |
0.59 (ROR) 0.69 (M.D.) |
2.63 (ROR) 2.43 (M.D.) |
0.36 (ROR) 0.21 (M.D.) |
|
|
2017-18 |
0.02 (ROR) 0.22 (M.D.) |
0.52 (ROR) 0.73 (M.D.) |
0.59 (ROR) 0.59 (M.D.) |
2.84 (ROR) 2.31 (M.D.) |
0.28 (ROR) 0.16 (M.D.) |
|
2016-17 |
0.14 (ROR) 0.15 (M.D.) |
0.29 (ROR) 0.54 (M.D.) |
0.62 (ROR) 0.53 (M.D.)
📢 advertisement:
|
2.62 (ROR) 2.07 (M.D.) |
0.33 (ROR) 0.11 (M.D.) |
|
2015-16 |
0.11 (ROR) 0.31 (M.D.) |
0.24 (ROR) 0.54 (M.D.) |
0.60 (ROR) 0.48 (M.D.) |
2.21 (ROR) 2.63 (M.D.) |
0.32 (ROR) 0.19 (M.D.) |
What jumps out is ROR’s success on the PP. For all of Buffalo’s overall struggles, they were strong on the PP, scoring a total of 154 PPGs in the previous three seasons, which was eighth highest in the NHL. And ROR had a point on 69 (i.e., 45%) of those 154 PPGs, ranking him 14th in the NHL in PPPts over that time. He was also remarkably consistent, with 22+ PPPts each season, making him one of just 11 NHLers to do so in each of the last three campaigns. Essentially, ROR has been money in the PPPt bank.
Why do these stats matter? Because ROR’s PPPt rate is even higher this season; however, as a team St. Louis has 17 PPGs, meaning ROR has factored into 47% (i.e., 8 PPPts in 17 games), or a rate on a par with what he did in Buffalo. Thus, although his power-play scoring rate is higher than it has been, his percentage of factoring into power-play scoring – which I’d argue is a more reliable barometer regardless of what team a player is on – isn’t that much higher than what it was in Buffalo. Long story short, ROR’s power-play scoring should drop very little, if at all. And that’s good news, since his SOG rate is down from last season, serving as further evidence of his scoring output perhaps being unsustainable.
Turning to Duchene, if we were to look solely at his PPPt and SOG rates, for sure we’d not think he’d be scoring in droves. Although his PPPt rate would appear as though it has room to grow, it turns out not since his rookie season has he averaged even one PPPt per five games, meaning he simply isn’t cut from a PP scoring cloth. That’s a problem, as since 2005-06 there’ve been 70 instances of 90+ point scoring and exactly one (Connor McDavid in 2017-18) failed to record 25+ PPPts in the same season (Duchene’s current pace would put him at 17 in 82 games). Accordingly, whereas Duchene held the edge looking at ice time, his overall data here is even less reassuring than ROR’s.
Luck-Based Metrics
|
Season |
Personal Shooting % |
Team Shooting % (5×5) |
Individual Points % (IPP) |
Offensive Zone Starting % (5×5) |
Average Shot Distance |
Secondary Assists % |
|
2018-19 |
20.7% (ROR) 17.9% (M.D.) |
11.80% (ROR) 13.61% (M.D.) |
78.8% (ROR) 65.9% (M.D.) |
48.2% (ROR) 50.6% (M.D.) |
31.6 (ROR) 26.5 (M.D.) |
57% (ROR) 15% (M.D.) |
|
2017-18 |
10.4% (ROR) 14.2% (M.D.) |
6.00% (ROR) 8.64% (M.D.) |
63.5% (ROR) 73.8% (M.D.) |
41.0% (ROR) 50.0% (M.D.) |
33.9 (ROR) 28.1 (M.D. – Col) 24.6 (M.D. – Ott) |
29% (ROR) 31% (M.D.) |
|
2016-17 |
10.6% (ROR) 11.3% (M.D.) |
6.67% (ROR) 6.34% (M.D.) |
63.2% (ROR) 75.9% (M.D.) |
45.4% (ROR) 44.2% (M.D.) |
32.0 (ROR) 24.6 (M.D.) |
40% (ROR) 39% (M.D.) |
|
2015-16 |
13.4% (ROR) 15.0% (M.D.) |
7.1% (ROR) 8.47% (M.D.) |
73.2% (ROR) 72.8% (M.D.) |
46.4% (ROR) 57.5% (M.D.) |
30..3 (ROR) 25.4 (M.D.) |
33% (ROR) 45% (M.D.) |
Duchene’s low – yes, his low – for IPP in a season has been 69.8%, which was all the way back when he was a rookie. And even during down times in Colorado he found a way to factor into scoring while on the ice. Moreover, Duchene’s team shooting percentage has only twice been below 8.64% in his career, including in 2016-17, and he’s never – not even once – had a personal shooting percentage that wasn’t in double digits. And this season 16 of his 19 assists have been primary, which likely explains why his IPP would be – for him – a career low. Taken together, this data shows Duchene was and still is an elite fantasy performer – one who also has extra motivation not only in continuing to prove his doubters from his later Colorado years wrong but in upping what he’ll earn as a UFA this summer. These factors also cushion against his numbers – which, admittedly, are too high to be sustained, especially his team shooting percentage – crashing down. Instead, look for Duchene’s scoring pace to cool maybe just a bit from where he is now.
It’s a different story with ROR. He’s only twice in his career been above 70% for IPP and four times was below 65%. Beyond that, also only twice has he ever sported a team shooting percentage above 7.27% and four times has been below 6.67%. What’s more, his personal shooting percentage has only twice in his career been above 10.9%. Given this, and how divergent his 2018-19 data is versus his previous history, the conclusion must be that ROR is enjoying a far more unsustainable burst of good luck than Duchene, and, in turn is bound to see his stats come back to earth more so than Duchene, to the tune of likely scoring at closer to a 65-70 point pace for the rest of 2018-19.
Who Wins?
This is a case where the numbers tell the story – Duchene is your winner. Don’t get me wrong – ROR is not going to crash and burn; however, we saw from his ice time and luck metrics he’s surpassing the level of production that could reasonably be expected of him. In truth, Duchene is too, but by far less, since although he’s exceeding the output of someone with SOG and PPPt rates that are as low as his and his team shooting percentage is sky high, he’s also sporting a lower than normal IPP and only 15% of his assists have been of the secondary variety. When the dust settles for 2018-19, look for Duchene to be pushing the 90-point mark, while ROR, due to already banked points but a likely 65-70 point scoring pace going forward, landing at roughly 75 points for the season.
Looking ahead, while we can’t discount that Duchene is playing this well at least in part due to wanting a big UFA payday, his track records – even on terrible Avs teams – of IPP and team shooting percentage show he’s the real deal and should continue to succeed regardless of what squad he’s on next season. If you have him in a keeper, only sell if you have to shore up a major need at another position and can get a solid forward back in return as part of the deal. Meanwhile, if you can turn ROR into an 80-85 point forward I’d give that strong consideration; but I also couldn’t blame you if you held pat, since chances are he’ll give you very good value in relation to what you paid to draft or trade for him.


 CHI
CHI SEA
SEA FLA
FLA DAL
DAL WPG
WPG CBJ
CBJ L.A
L.A MIN
MIN DET
DET
