Frozen Tools Forensics: Malkin and the Giant IPPeach
Chris Kane
2020-01-24

Welcome back to Frozen Tools Forensics. Last week we took a deep dive into the Per 60 Table, and specifically looked at shots per 60 and what it can tell us about player performance. When I was looking into the tools this week a particular player’s stat jumped out at me and inspired the topic for the week. We will get to that player in a second, but first, let’s introduce Power-Play Individual Points Percentage (or PP IPP).
Quick refresher on IPP: IPP tells us what percentage of goals scored while a player is on the ice that said player got a point on. So if there are four goals scored while Player X is on the ice and Player X gets three points their IPP is .75. Ok, great. But what does that tell us?
Each player typically ends up in a certain range for their career based on their skill and/or their position in the lineup. 100+ point potential scorers might be 80+ (Patrick Kane has been about 80% the last three seasons), other top-six forwards might be in the 70+ range (Vladimir Tarasenko has averaged about 70% the last three seasons), bottom-six forwards lower (Mathieu Perreault has averaged about 60% the last three seasons), and typically defensemen a bit lower still (Roman Josi – one of the most productive scoring D men this year has been around 50% for most of his career).
If a player has a career history of getting a point on 75% of the points scored while they are on the ice, but they are currently only getting in on 50% of the points that tells us something. Either something has changed (deployment, injury, the player just being worse, etc.), or that player is just getting a bit unlucky during this stretch and we can expect the points to start coming. Same in the reverse. If a player has a 100% IPP and has never put up a number higher than 50% we can likely expect that either something has changed or that it is not going to continue and their point pace is likely to drop.
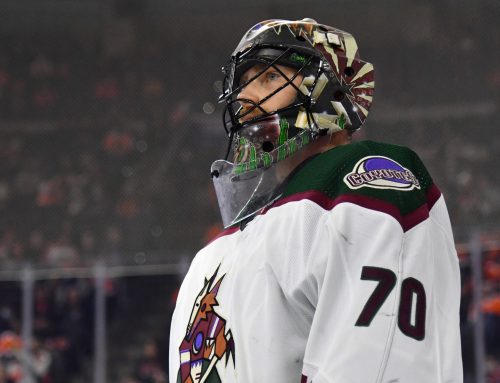
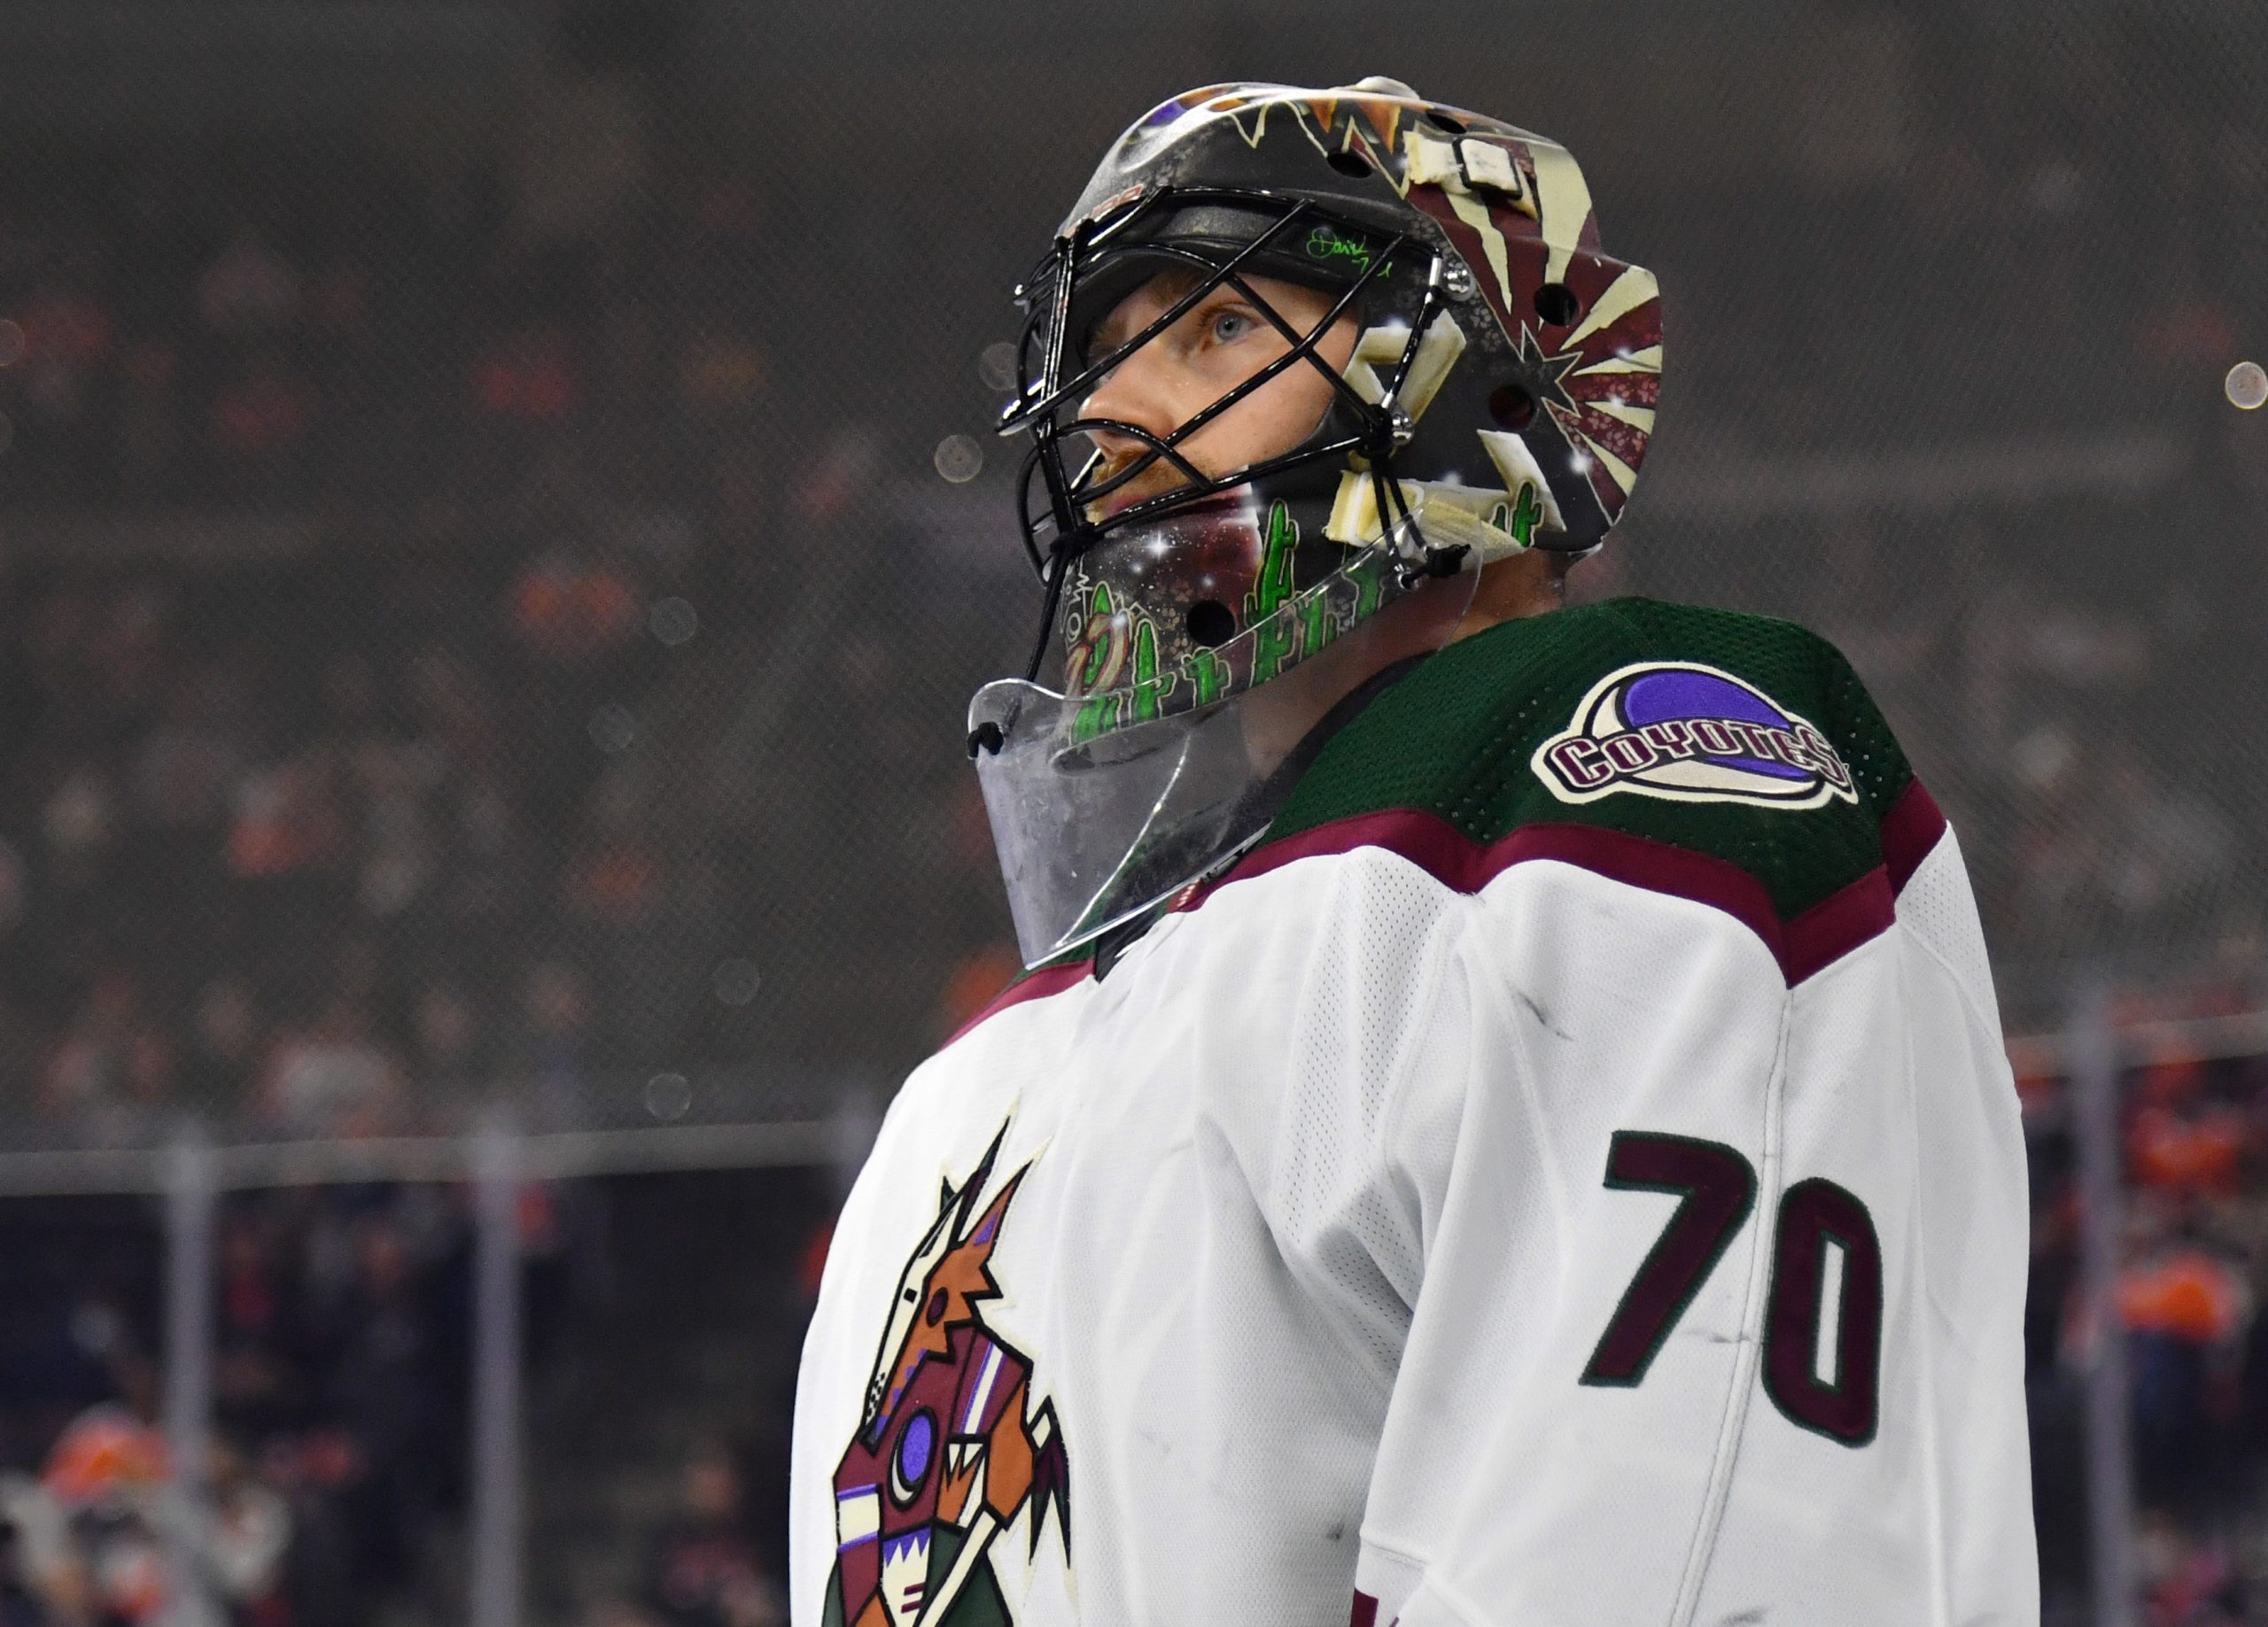
So PP IPP is exactly as described above, except it only takes into account goals scored while the player is on the power play. And that brings us to Evgeni Malkin. After scanning the Advanced Stats Report (where PP IPP is listed), Malkin’s 100% PP IPP stuck out. Malkin has been averaging over three minutes of power-play time each game, or almost 70% of his team’s power-play time and has 16 power-play points on the season (which is a 35-pp point pace). He has pointed on every single goal scored on the power play when he was on it.
|
Name |
Pos |
Team |
GP |
PP IPP |
%PP |
|
EVGENI MALKIN |
C |
PIT |
37 |
100 |
69.5 |
While it stood out to me, it turns out a 100% PP IPP is not all that uncommon. Malkin is certainly not the only player to have a 100% IPP on the power play in 2019-20. In fact, there are 58. Now that is clearly not a fair comparison as we are speaking nothing about sample size. Malkin has played a significant majority of his team’s games, and a significant proportion of his team’s power-play time. If we control for games played (say players have to have 10 games played thus far) there are still 51. However, if we also require that player to have played 30% of their team’s power-play time (to further control for small sample sizes) our number drops dramatically.
|
Name |
Pos |
Team |
GP |
PP IPP |
%PP |
|
EVGENI MALKIN |
C |
PIT |
37 |
100 |
69.5 |
|
VLADIMIR TARASENKO |
R |
STL |
10 |
100 |
48 |
|
JONATHAN DROUIN |
L |
MTL |
19 |
100 |
48.9 |
|
DAVID KREJCI |
C |
BOS |
42 |
100 |
35.2 |
|
ILYA KOVALCHUK |
L |
MTL |
25 |
100 |
49 |
|
JESPER BRATT |
L |
N.J |
40 |
100 |
31.4 |
|
TARO HIROSE |
L |
DET |
23
📢 advertisement:
|
100 |
46.5 |
|
ISAC LUNDESTROM |
C |
ANA |
15 |
100 |
33.8 |
We are down to eight players, and several of them just barely made the cut. Vladimir Tarasenko’s 10 games, and Isac Lundestrom’s 15 games (and 33.8% of the power-play time) are not indicative of a large sample size. If we up the stakes to 20 games and 40% power-play share we are down to three names.
|
Name |
Pos |
Team |
GP |
PP IPP |
%PP |
|
EVGENI MALKIN |
C |
PIT |
37 |
100 |
69.5 |
|
ILYA KOVALCHUK |
L |
MTL |
25 |
100 |
49 |
|
TARO HIROSE |
L |
DET |
23 |
100 |
46.5 |
In this company, we can see just how wild Malkin’s performance is. He is seeing 70% of his team’s power-play time, the next highest is Ilya Kovalchuk at just under 50%, and Malkin has played 12 more games than Kovalchuk.
For comparison, I wanted to check out what happened in 2018-19. There 53 players who ended up with a 100% PP IPP. After we sort as above (20 games played with at least 40% of the power-play time) we are left with three names.
|
Name |
Pos |
Team |
GP |
PP IPP |
%PP |
|
ONDREJ KASE |
R |
ANA |
30 |
100 |
45.7 |
|
BRANDON PIRRI |
C |
VGK |
31 |
100 |
41.9 |
|
SAM STEEL |
C |
ANA |
22 |
100 |
41.3 |
In this case, we again see that Malkin’s feat to this point has surpassed what anyone was able to accomplish in 2018-19. He has more games played and a significantly higher percentage of his team’s power-play time. We can also see that no player who has played the majority of their team’s power play and played in a majority of their team’s games ended the season with 100% PP IPP in 2018-19, and Malkin is the only one with a chance to do so in 2019-20.
Two side notes: Taro Hirose also made the 100% IPP list in 2018-19 (though his 100% PP IPP came in only 10 games). Malkin, on the other hand, averaged a 65% IPP on the PP through the full season.
What are the takeaways here? What Malkin has done is truly remarkable. His number is inflated from 2018-19 (and we can likely assume that 100% isn’t really sustainable) but in his case the jump in PP IPP from 2018-19 to 2019-20 does have some mitigating factors. In 2018-19 the power-play featured Phil Kessel and Sidney Crosby. Their presence would have meant that less of scoring needed to run through Malkin. With Kessel traded and Crosby injured for a large chunk of the season, Pittsburgh’s power-play needed to run through Malkin and it clearly shows in his IPP. It is certainly possible that we see Malkin increase his PP IPP this season with the changes on the power-play, but a 100% IPP on the power-play does seem unlikely to sustain over the season.
Related Posts


UPCOMING GAMES
| Apr 23 - 19:04 |
| vs |
| |
| Apr 23 - 19:04 |
| vs |
| |
| Apr 23 - 21:04 |
| vs |
| |
| Apr 23 - 22:04 |
| vs |
| |
Starting Goalies
Top Skater Views
Top Goalie Profile Views
LINE COMBOS
| Frequency |
| |
|---|---|---|
| 23.2 | MIKKO RANTANEN ZACH PARISE NATHAN MACKINNON | |
| 18.9 | VALERI NICHUSHKIN CASEY MITTELSTADT ARTTURI LEHKONEN | |
| 17.2 | MILES WOOD JOEL KIVIRANTA ROSS COLTON | |
DobberHockey Podcasts

Fantasy Hockey Life: Salary Cap Basics Remix
If you missed last year’s series on salary leagues, this is a remix with some bonus material. Jesse and Victor discuss the different ways you can step up your dynasty league with a salary component. Our show is part of the Dobber Podcast Network and sponsored by Fantrax.com. Email [email protected] and ask to join our […]

Keeping Karlsson: No. 533 – Ultimate Champion Interview + Playoff Preview
On this week’s Keeping Karlsson Fantasy Hockey Podcast mega-show, Elan and Brian gather and analyze the latest fantasy hockey news, notes and data.
Fantasy Hockey Life: Tim-Eh’s Time in the TIDY Top Tier
When one of the managers in the TIDY league top tier left midseason, Patron Tim volunteered to give up his excellent team to take over a mid-season orphan fighting to escape relegation. And Tim did not go quietly. Ryan, Jesse and Victor welcome Tim to talk through his experience and the trades he made in […]
Keeping Karlsson: Better Off Nedeljkovic
On this week’s Keeping Karlsson Fantasy Hockey Podcast mega-show, Elan and Brian gather and analyze the latest fantasy hockey news, notes and data from the past season to work on projecting the 2023-24 NHL and fantasy hockey season. — Join the Keeping Karlsson patron community! Patrons get guaranteed KKUPL invitations, plus monthly bonus AMA episodes, and full access to […]
Fantasy Hockey Life: FHL Player Cards with Brandon
Our guy Brandon has been doing great work behind the scenes to great Fantasy Hockey Life prospect player cards, visualizations with the metrics we care about most – including BASH. These are a great tool to catch at a glance the stats for upcoming players. Jesse interviews Brandon and Victor on the decisions behind what […]