Editor’s note: This article was originally posted a week ago. However, it was missed during the migration to the new-and-improved Dobber Hockey site last week, so we are reposting it here.
Welcome back to another week of Frozen Tool Forensics. In fantasy it feels like we are always looking for the next big breakout, wanting to be the first to catch on to a run that propels some no-name to fantasy stardom. Often times these come in the forms of changes in deployment. Someone new gets to play with Connor McDavid or Sidney Crosby and we all get excited about the possibilities. Sometimes it a trade to a new team that changes up the trajectory of both the traded player, those around him, and those he left behind. This week I wanted to take a look at how some of those deployment changes, particularly a trade, do impact the whole team, and how that deployment can have a major impact on the performance of individual players.
This week: Taylor Hall and the Great Desert Shakeup
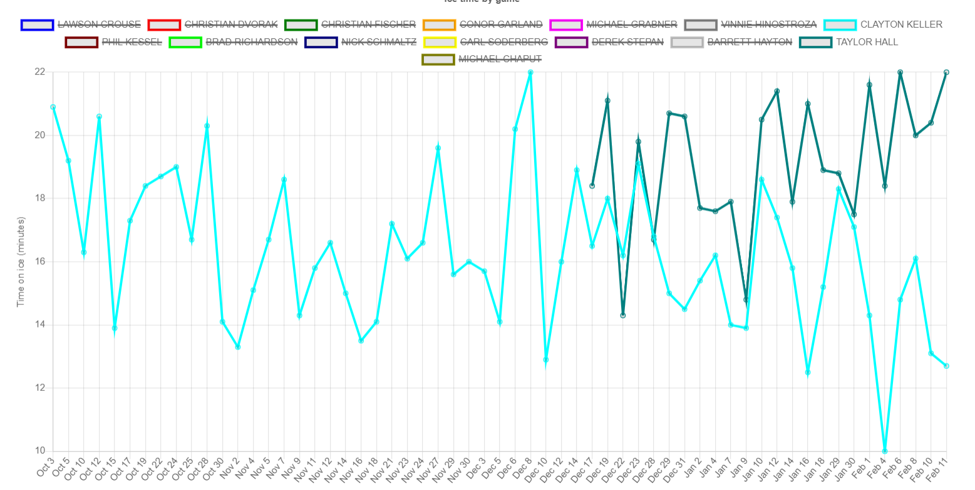
To help us out this week we are going to take a look at one of the Chart Generators available on the Frozen Tools site. The one we are going to use is the Time On Ice chart.
If we run the chart for Arizona and the 2019-20 season, we get something that looks like this:
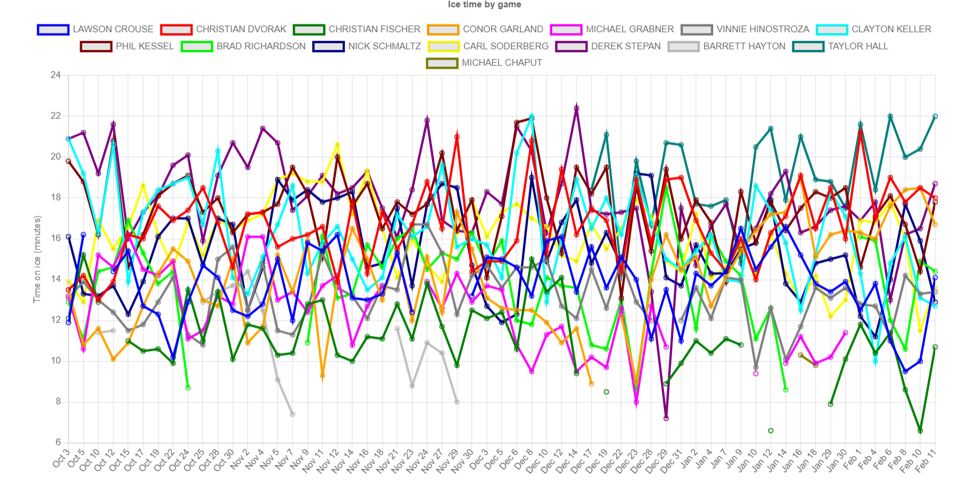
Not all that helpful to be honest, there is a lot going on. But, let's trim it down to our article's namesake and we can see a lovely trend.
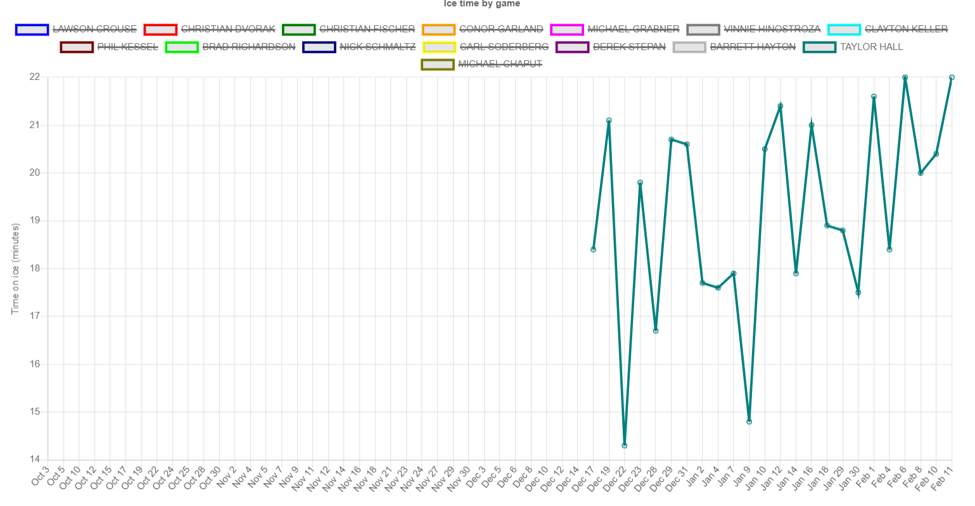
We can see that Hall's overall time on ice has fluctuated a bit since he started with the Coyotes in mid-December, but that generally, his time on ice has been improving steadily to the point where he has been up over 21 minutes in three of his last six games.
Now what we are really interested in is how the arrival of Hall has impacted the players around him and by adding back a few names we can get a great look at this. First up let's take a look at Conor Garland who has been recently been lining up time with Hall.
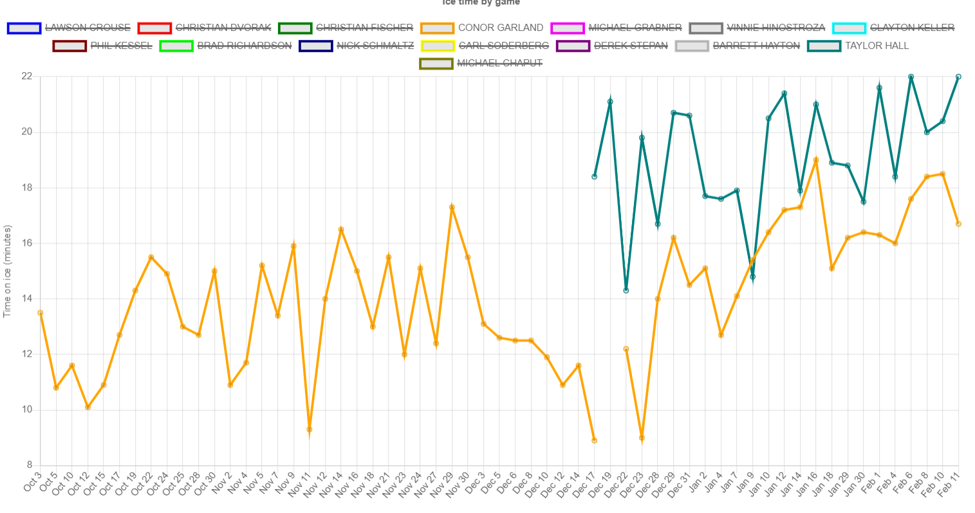
Garland's recent time on ice trends track very nicely with Hall. This should not be a surprise since we picked Garland because he is playing with Hall. Before Hall arrived, Garland had eight straight games of 13 minutes of total time on ice. After a few games with Hall on the team, he was paired up and his ice time has soared to over 16 minutes in two of his last three games.
For Garland to play with Hall means someone else isn't getting the opportunity so if Garland's gain comes at a cost, so who is paying it? When Hall was initially traded to Arizona everyone was drooling about a Hall, Phil Kessel duo with varying options at center. But that isn't what happened. Kessel started with Hall and then was shifted off and has recently been playing with Derek Stepan and Lawson Crouse. That change is compellingly obvious in the chart.
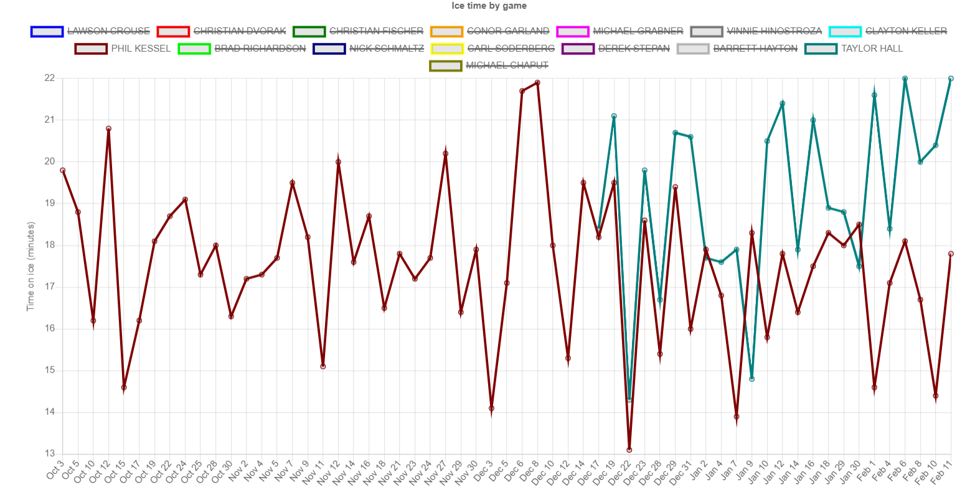
Kessel's first six games mirror Hall's exactly (again not a surprise they were seeing time at even strength and on the power-play together). By game eight though Kessel's time is dramatically different, and not in a positive way. While Hall has been increasing up to his high-water mark of 22 minutes, Kessel has been dropping away, posting several games less than 15 minutes a night. To be fair, most of his games are still in the 16-18-minute range, but that still represents a drop from where Hall is, and he conceivably would have been.
Clearly then the rising tide that is pushing Hall and Garland up is not lifting all boats, but coming at the expense of other players. So what else is happening to the lineup?
There is some additional bad news down the lineup for players like Clayton Keller. He kept deployment for a few games once Hall joined the team (there is an overlap here with the games that Kessel was still with Hall), but we are seeing a significant downward trend in time on ice as Hall is increasing his.
We could go on and on here and look at impacts over the entire team, but I wanted to add one more piece to the puzzle here.
The other chart that Frozen Tools has available on the site is a Points Per Game chart. This, as the name implies, tracks a player's point totals after each game. By looking at how steep the line is we can tell tell how quickly a player is gaining points. A steep line is great, a flat line – not so much. If we take a look at two of the players who have seen dramatic changes with Hall's arrival (Keller and Garland) we see a point chart that looks like this.
(Keller is Blue, Garland is Yellow)
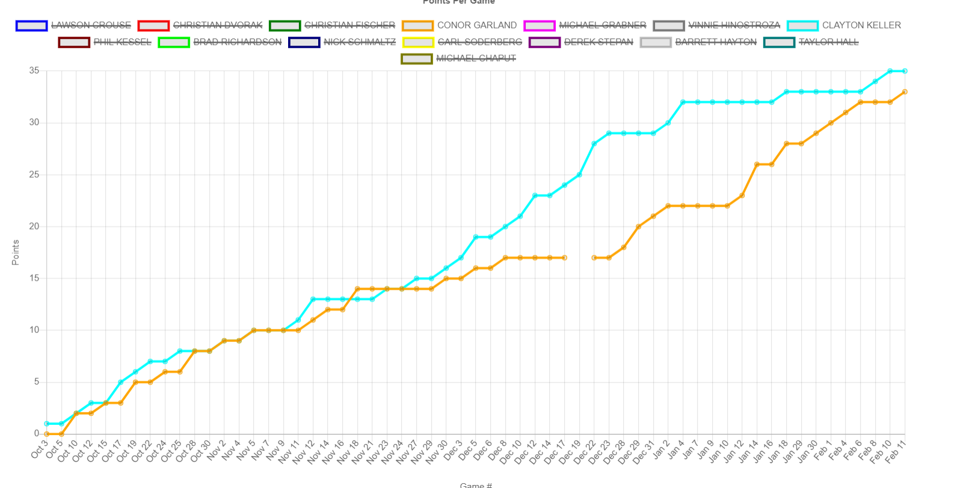
One surprise here is how long at the beginning of the season Keller's slow start mirrored Garland's start. We can see that Keller put some distance between the two of them starting at the end of November, but by the end of December (when Garland was put with Hall), Garland's pace has dramatically improved, while Keller's has dramatically slowed. Keller has three points over his last 15 games while Garland has 11 over that same time span.
These charts are very helpful when looking to spot trends, but the table below also shows the data in a different way (data was pulled from another helpful portion of Frozen Tools, the Player Calculator section of the Player Profile).
| TOI Before Trade | TOI After Trade | Point Pace Before Trade | Point Pace After Trade | |
| Hall | 19:11 | 19:09 | 68 | 68 |
| Garland | 13:13 | 15:21 | 40 | 57 |
| Kessel | 17:53 | 17:00 | 45 | 48 |
| Keller | 16:50 | 15:29 | 54 | 41 |
In this table we are looking at stats from before Hall's arrival, and after. The time on ice is a fairly straightforward measure, and the point pace is just looking at the points scored over the games played in each window and multiplying the pace by 82 games.
Here we can see that Hall's deployment and point pace have been very similar on average from his time on NJ to Arizona, though we do miss the fact that his recent time on ice numbers are seeing a fairly dramatic jump. Garland has improved by an average of two minutes since the trade and has increased his point pace by 17 points. Kessel has lost about a minute on average, though again we miss the fact that it has been worse recently. His point pace has stayed essentially the same. Part of this is due to the fact that he was underperforming for a large chunk of that time, so some of his percentages are rebounding and dulling the effect of the lost time. Keller has lost about a minute and a half overall and has dropped 13 points in pace.
Overall it is clear that at this stage, this is Hall's team. He is soaring and being utilized more and more, while all of the other big names are falling off. Is that what anyone predicted? Not really, but Garland is currently along for the ride so is definitely worth a look in your league.
Until next week, thanks for reading.
Liked what you read? Check out these recent Frozen Tool Forensics Posts.
Frozen Tools Forensics: The Good, The Bad, The Ugly on Goalies
Related Posts

UPCOMING GAMES
Starting Goalies
Top Skater Views
| Players | Team | |
|---|---|---|
| HENRY THRUN |
| |
| ISAAC HOWARD |
| |
| JACKSON LACOMBE |
| |
| ZACH BENSON |
| |
| MATHEW DUMBA |
| |
Top Goalie Profile Views
LINE COMBOS
| Frequency |
| |
|---|---|---|
| 22.3 | KIRILL KAPRIZOV JOEL ERIKSSON EK MATT BOLDY | |
| 13.9 | MATS ZUCCARELLO RYAN HARTMAN MARCUS FOLIGNO | |
| 6.7 | GUSTAV NYQUIST MARCUS JOHANSSON FREDERICK GAUDREAU | |
DobberHockey Podcasts

Fantasy Hockey Life: Draftastic 3 – Q&A on the NHL Draft
Jesse asks Victor the questions you wanted answers to from the NHL Draft!

Keeping Karlsson: UFA Szzzn
Elan and Brian work their hardest to make the most of the NHL’s 2025 UFA signings and player movement, searching for the guys who may be the most likely to exceed expectations in new homes and situations.
Fantasy Hockey Life: Draftastic 2 – Q&A on the NHL Draft
Victor and Jesse are back in studio as Victor reports on his time at the NHL Draft and his outlook on fantasy rookie drafts. We discuss Michael Misa, Matthew Schaefer, Cole McKinney, Mason West, Milton Gastrin and Jacob Ihs-Wozniak with player audio. Victor also answers patron questions on which players you’ll want to target for […]
Fantasy Hockey Life: Draftastic 1 – NHL Draft Talk with Prospect Writers
Victor reports from the NHL Draft in Los Angeles.
Keeping Karlsson: Dobson is Free
On this edition of the Keeping Karlsson Fantasy Hockey Podcast, Elan and Brian ride the highway of National Hockey League offseason news, draft notes and transactions before the Free Agent Frenzy begins. All night long.