Frozen Tools Forensics: Multi-Cat Defensemen Past and Present
Chris Kane
2020-03-20
Given that we don't have a lot of new information to use the last week, and we don't know what the future of the NHL season looks like, the next couple columns are going to try and take a look back and compare what we are seeing thus far in 2019-20 to what has happened over the last several seasons. I had originally hoped to touch on multi-category players this week (prior to the season being paused) so I decided to keep that theme, but instead of advising what players might be available to grab we will look at high performers in 2019-20 and how their performances compare to the last several years.
This week: Multi-Cat Defensemen
Frozen Tools has an easy way to pull up this kind of data. If you navigate to the report section, just click on the Multi-Category button. If we pull up the report for 2019-20 here is the table we get.
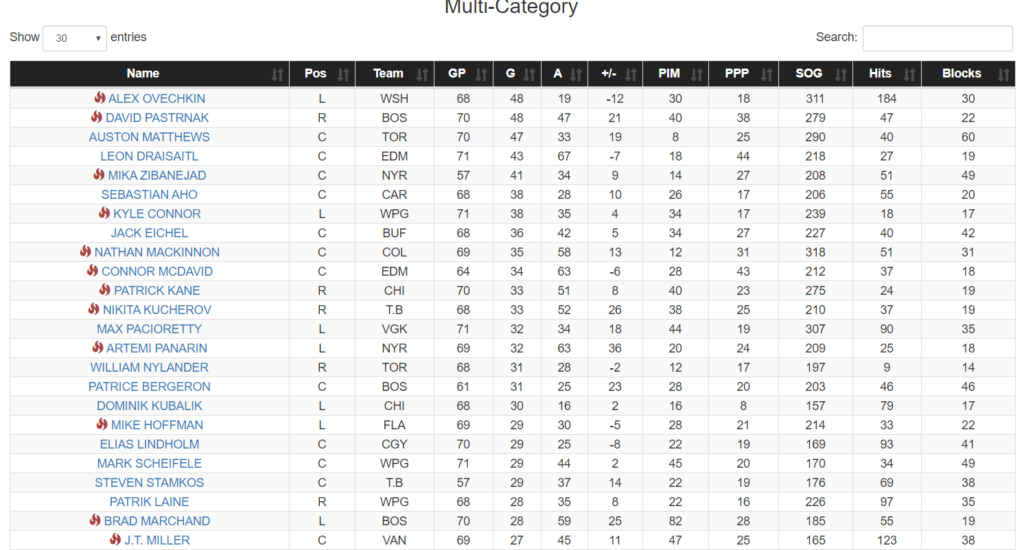
Alex Ovechkin tops the list and well, it is hard to argue with him being placed there. His shot and hit numbers are elite. This week though we are not focusing on forwards, but defensemen so I am going to export the list so I can run some filters on it.
For the purposes of this column, I am mostly going to be looking at shots, hits, and blocks. As you can see the report also gives points so if I want to use a point floor at a later date, I can do that. I am not going to use penalty minutes at the moment, even though I know some leagues still utilize that stat. I am also going to try an account for games played so I put all of the 2019-20 stats in a per-game rate, but will also filter for at least 20 games played to eliminate players with very small sample sizes.
Just quickly then, our leaders in shots per game:
| Name | Pos | Team | GP | SOG/G | Hit/G | Block/G |
| ROMAN JOSI | D | NSH | 69 | 3.77 | 0.75 | 1.57 |
| DOUGIE HAMILTON | D | CAR | 47 | 3.62 | 1.11 | 1.34 |
| ALEX PIETRANGELO | D | STL | 70 | 3.21 | 0.67 | 1.27 |
| BRENT BURNS | D | S.J | 70 | 3.21 | 1.03 | 1.64 |
| SHEA THEODORE | D | VGK | 71 | 3.08 | 0.28 | 0.97 |
| ZACH WERENSKI | D | CBJ | 63 | 2.97 | 0.57 | 0.92 |
| KRIS LETANG | D | PIT | 61 | 2.90 | 1.66 | 1.49 |
| SHEA WEBER | D | MTL | 65 | 2.85 | 1.72 | 1.75 |
| JOHN CARLSON | D | WSH | 69 | 2.74 | 0.80 | 1.57 |
| THOMAS CHABOT | D | OTT | 71 | 2.62 | 1.11 | 1.20 |
Our leaders for hits per game:
| Name | Pos | Team | GP | SOG/G | Hit/G | Block/G |
| MARK BOROWIECKI | D | OTT | 53 | 1.19 | 3.75 | 2.26 |
| DENNIS GILBERT | D | CHI | 21 | 0.57 | 3.52 | 1.57 |
| LUKE SCHENN | D | T.B | 25 | 1.24 | 3.32 | 0.84 |
| CALVIN DE HAAN | D | CHI | 29 | 1.45 | 3.21 | 2.52 |
| ILYA LYUBUSHKIN | D | ARI | 51 | 0.80 | 2.96 | 1.04 |
| RASMUS RISTOLAINEN | D | BUF | 69 | 1.86 | 2.94 | 1.19 |
| CONNOR CLIFTON | D | BOS | 31 | 0.65 | 2.90 | 1.06 |
| ANTHONY BITETTO | D | WPG | 51 | 1.06 | 2.84 | 0.98 |
| BRAYDEN MCNABB | D | VGK | 71 | 1.03 | 2.83 | 1.87 |
| BRENDEN DILLON | D | WSH | 69 | 0.84 | 2.81 | 1.07 |
And blocks per game:
| Name | Pos | Team | GP | SOG/G | Hit/G | Block/G |
| OSCAR KLEFBOM | D | EDM | 62 | 2.56 | 0.73 | 2.90 |
| ALEXANDER EDLER | D | VAN | 59 | 2.00 | 1.83 | 2.75 |
| CALVIN DE HAAN | D | CHI | 29 | 1.45 | 3.21 | 2.52 |
| MARK GIORDANO | D | CGY | 60 | 2.62 | 0.70 | 2.47 |
| ANDY GREENE | D | NYI | 63 | 0.95 | 0.48 | 2.46 |
| DAVID SAVARD | D | CBJ | 68 | 1.43 | 1.90 | 2.40 |
| CONNOR MURPHY | D | CHI | 58 | 2.02 | 2.21 | 2.38 |
| CHRISTOPHER TANEV | D | VAN | 69 | 0.65 | 0.46 | 2.30 |
| ALEC MARTINEZ | D | VGK | 51 | 1.47 | 0.84 | 2.29 |
| ROMAN POLAK | D | DAL | 41 | 0.83 | 2.54 | 2.29 |
In most standard Yahoo points league the value of each of these stats is about the same. So in order to rank a multi-cat player when they all have different strengths and weaknesses I am adding their average stats per game in each of these categories. It certainly is not a foolproof method and if your league assigns different weights to these categories, you will obviously get slightly different results.
| Name | Pos | Team | GP | SOG/G | Hit/G | Block/G | Multi-Cat Points |
| MARK BOROWIECKI | D | OTT | 53 | 1.19 | 3.75 | 2.26 | 7.21 |
| CALVIN DE HAAN | D | CHI | 29 | 1.45 | 3.21 | 2.52 | 7.17 |
| DARNELL NURSE | D | EDM | 71 | 2.39 | 2.42 | 1.99 | 6.80 |
| JACOB TROUBA | D | NYR | 70 | 2.40 | 2.47 | 1.83 | 6.70 |
| CONNOR MURPHY | D | CHI | 58 | 2.02 | 2.21 | 2.38 | 6.60 |
| ALEXANDER EDLER | D | VAN | 59 | 2.00 | 1.83 | 2.75 | 6.58 |
| SHEA WEBER | D | MTL | 65 | 2.85 | 1.72 | 1.75 | 6.32 |
| OSCAR KLEFBOM | D | EDM | 62 | 2.56 | 0.73 | 2.90 | 6.19 |
| ROMAN JOSI | D | NSH | 69 | 3.77 | 0.75 | 1.57 | 6.09 |
| DOUGIE HAMILTON | D | CAR | 47 | 3.62 | 1.11 | 1.34 | 6.06 |
| RYAN PULOCK | D | NYI | 68 | 2.40 | 1.62 | 2.04 | 6.06 |
| KRIS LETANG | D | PIT | 61 | 2.90 | 1.66 | 1.49 | 6.05 |
| JAKE MUZZIN | D | TOR | 53 | 1.87 | 2.06 | 2.08 | 6.00 |
| RASMUS RISTOLAINEN | D | BUF | 69 | 1.86 | 2.94 | 1.19 | 5.99 |
For the most part, there aren't any real shockers on this list. Mark Borowiecki leading the way is a little surprising given how little he shoots, but obviously leading the group in hits by a wide margin and doing well in blocks helps. Oscar Klefbom also ranks well considering that he doesn't really hit, but his shots and blocks clearly make the difference. It is a little surprising to not see guys like Colton Parayko (29th), and Ivan Provorov (47th) on this top 15 list. They have been making a name for themselves in recent seasons by contributing across the board. Alex Edler, of course, has been a bit of a fantasy darling in recent years as his contributions in these categories have been excellent. He has actually dropped a bit as he lost his power-play role and time on ice to Quinn Hughes.
It is also really interesting to see some good point producers on this list. Guys like Kris Letang, Dougie Hamilton, Shea Weber, and Roman Josi all high have point upside, which makes them significantly valuable adds as they are able to contribute across the board.
I next wanted to compare 2019-20 to our recent history and see if there were any trends.
If we look at shots first, In 2019-20 we have five players who are pacing higher than three shots per game: Roman Josi, Dougie Hamilton, Brent Burns, Alex Pietrangelo, and Shea Theodore. Over the prior three seasons, only three have been able to keep that pace (Burns, Josi, Hamilton). We could guess that it is harder over the longer sample size, or that shooting has gone up, but there are actually fewer players shooting 2-3 shots per game in 2019-20 (38) than in the prior three years (42). So we have more elite shooters, but fewer good shooters in 2019-20.
The trend is all negative in hits. In 2019-20 we have four defensemen hitting more than three times per game (Boroweicki, Dennis Gilbert, Luke Schenn, and Calvin De Haan). The prior three seasons it was six. We also had 36 hitters averaging between two and three hits per game in 2019-20 when in the prior three years we had 41. So we had fewer elite hitters and fewer good hitters when compared to the prior sample.
The blocks category is heading the other direction. While neither comparison had a player who averaged more than three blocks per game, there were 20 players in 2019-20 who averaged more than two blocks per game. In the prior three years, we were at 15. This would be consistent with the idea that there are more shots happening per game, or that teams are getting better at blocking them.
When taken as a unit, though, we have very similar numbers between the samples. There are 13 players in 2019-20 who are averaging more than six multi-cat points per game. In the prior three years, there were 14.
That is all for this week. Thanks for reading.
Stay safe out there.
Want more tool talk? Check out these recent Frozen Tool Forensics Posts.
Frozen Tools Forensics: Helping make fantasy decisions
Frozen Tools Forensics: Comparing deadline acquisitions
Frozen Tools: Secondary assist rates
Related Posts


UPCOMING GAMES
Starting Goalies
Top Skater Views
Top Goalie Profile Views
LINE COMBOS
| Frequency |
| |
|---|---|---|
| 23.1 | BRADY TKACHUK SHANE PINTO DRAKE BATHERSON | |
| 20.4 | MATHIEU JOSEPH RIDLY GREIG CLAUDE GIROUX | |
| 16.7 | JIRI SMEJKAL ZACK MACEWEN DOMINIK KUBALIK | |
DobberHockey Podcasts

Keeping Karlsson: No. 533 – Ultimate Champion Interview + Playoff Preview
On this week’s Keeping Karlsson Fantasy Hockey Podcast mega-show, Elan and Brian gather and analyze the latest fantasy hockey news, notes and data.

Fantasy Hockey Life: Tim-Eh’s Time in the TIDY Top Tier
When one of the managers in the TIDY league top tier left midseason, Patron Tim volunteered to give up his excellent team to take over a mid-season orphan fighting to escape relegation. And Tim did not go quietly. Ryan, Jesse and Victor welcome Tim to talk through his experience and the trades he made in […]
Keeping Karlsson: Better Off Nedeljkovic
On this week’s Keeping Karlsson Fantasy Hockey Podcast mega-show, Elan and Brian gather and analyze the latest fantasy hockey news, notes and data from the past season to work on projecting the 2023-24 NHL and fantasy hockey season. — Join the Keeping Karlsson patron community! Patrons get guaranteed KKUPL invitations, plus monthly bonus AMA episodes, and full access to […]
Fantasy Hockey Life: FHL Player Cards with Brandon
Our guy Brandon has been doing great work behind the scenes to great Fantasy Hockey Life prospect player cards, visualizations with the metrics we care about most – including BASH. These are a great tool to catch at a glance the stats for upcoming players. Jesse interviews Brandon and Victor on the decisions behind what […]
Keeping Karlsson: Short Shifts – One Final Lap
Lewis goes for a solo skate to bring Short Shifts season five to a close. He starts by covering some of the headlines including broken records for Quinn Hughes and Nikita Kucherov, taps the stick for Jeremy’s brilliant call on Matchup Maximizer to stream Trevor Moore for his hat trick, and celebration for Wyatt Johnston […]