Capped: Changes in hit rates over the years
Alexander MacLean
2020-04-30
A friend of mine recently asked me whether there was any way to measure if the NHL was faster and less physical now than it was 10, 20, or 30 years ago. We all know that the number of fights has plummeted, but is there any other data that we can go on? And what does it mean for fantasy hockey now and in the future?
Generally, I am going to look at hits, as we have all seen that penalty minutes have gone down, but I can't remember anyone going over hit totals. Through the Frozen Tools Reports page, I was able to browse the data all the way back to the 2007-2008 season. This should be able to show any obvious trends from recent history, while the data from anything earlier is generally incomplete where you can find it, or just completely unavailable.
One thing to be aware of is the changes in rules and parameters that played roles in how the game is shaped today. The rolling out of new rules on occasion, especially after the 2005 lockout, provided new freedom to the skilled players, and was widely considered to be the beginning of this "faster" era. If the players say the game is faster, that is probably the best indicator. They would know better than any of us, and likely better than any number could show. However, we're going to look into a few numbers anyways.
With regards to the hits data, the expectation would be that the numbers are slowly declining as the game gets faster, and more focused on offence. In theory, this would make the top hits producers a rarer and more valuable commodity in fantasy leagues. On the contrary however, the hits numbers are fairly consistently in the low to mid-40s. The number of top hits producers fluctuates, but it doesn't have any dominant trends. For the top hit producers, I arbitrarily used over 200 in a season to show us the upper echelon. There are both peaks and valleys, but they don't seem to be much rarer now than any period in the last dozen seasons.
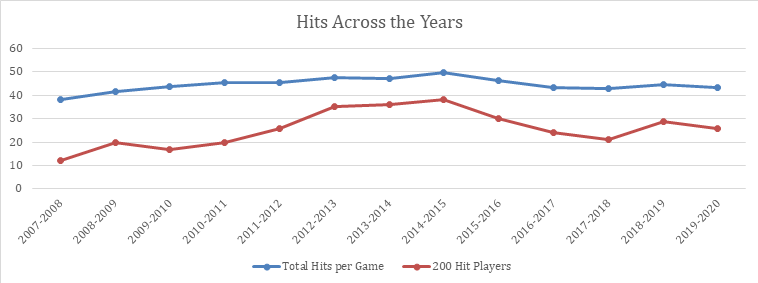
*For the shortened seasons, I paced the league over an 82-game schedule to account for lower values.
**The jump in 200 hit players in the 2018-2019 season includes four players exactly on 200 hits, so the number is skewed a little higher without having that many players "over" 200.
It appears hit levels haven't changed too much over the last number of years, nor do they fluctuate much from year to year. This is good news for those of us who juggle a lot of fantasy leagues, as it means we don't have to re-evaluate how much stock to put into our hitters every year, like it seems necessary to do with goaltenders. What we may have to evaluate, is the growing cost of these top hitters. I took a quick look at the top hitter from each of the 13 years I tracked (man was Matt Martin ever a wrecking ball) and the cap hit of the top hitter in the league has been consistently growing. Growth would be expected as the NHL cap continues to go up, however the cap hit percentage of these contracts is going up steadily as well. Through the majority of the last dozen years, the hits leader has been between one to two percent of the total cap, while the last two years on Ryan Reaves' $2,775,000 deal, it went up over three percent of the cap for the first time. The year before that, Nikita Zadorov started the upward trend of hits leaders being paid more with his $2,150,000 deal. So while there may be similar amounts of hits around the league, the cost of the top hitters appears to be going up, so we will have to be smart about perhaps amassing a collection of hitters, instead of overpaying for the top guy like Reaves or Zadorov.
***
Looking at player speed, the NHL has apparently started collecting data, but it does not appear to be public at the time (if anyone knows where I can find this sort of data, please let me know!). In the meantime, the data from the NHL's fastest skater will have to do in giving us some insight into the speed available around the league, making the assumption that a rising tide lifts all boats, and that the fastest player is an indicator of the distribution of the rest of the league to some extent.
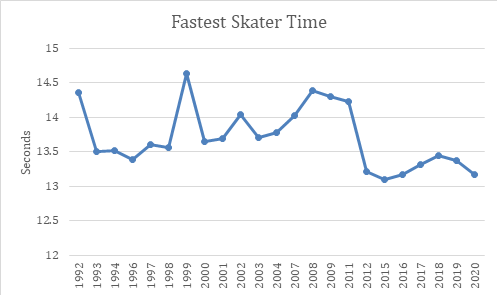
*Dylan Larkin's "running start" in 2016 should have an asterisk, however there is still an interesting gap between the 2010s, and the other decades.
Seven of the top eight times recorded in the fastest skater competition are from the last seven times that the event was held (three being Connor McDavid). We seem to have reached a new plateau of max player speed. Whether that is due to the game being faster now, or if it is mostly due to advancements in training and equipment, the top speed in the game must bring up the speed around the rest of the league in order to keep up, especially without all of the penalties (hooking and grabbing) that was more prevalent in previous decades. If anyone has some insight into how the Fastest Skater competition has evolved over the years in terms of rules, track length, or other changes, that may have some small impacts on times. I was not able to easy find the outlines, so we're running under the assumption here that everything else was the same.
One article that I found tried to compare the speed of teams/players across different zones through different eras in order to provide some insight into the changing pace of the game. The data is compiled manually, and it isn't a large sample size, but it does show some numbers trending towards a faster pace in today's game. Maybe this is one case where it is much harder to quantify something with numbers than it is to accept a conclusion based solely on the eye test. Go back and watch a game from the 80s, the 2000s, and one from this past season. There is a noticeable difference in terms of the strategy, the pace, and the speed of both the players and the puck in the game.
This doesn't have much of a direct impact on the fantasy game but it does have some secondary impacts on stats that are regularly tracked such as goals, shots, plus-minus, and others to a lesser extent. The players that have the speed to keep up with today's game are the ones setting career highs in goals, and breaking out more regularly than the players who have other talents, but aren't as adept at moving their feet. Shots and plus-plus minus follow to some extent, with the players in better positions to shoot being the ones that can skate, find open ice, and make plays. These players are scoring more goals, and generally more adept at the puck retrieval side of the game, leading to better goal differentials when they are on the ice, aiding their plus-minus stat.
There are three total players who have amassed 1000 points since the start of the 2007 season, Alex Ovechkin, Sidney Crosby, and Patrick Kane. We are going to leave out Crosby, as he was dealing with concussion and neck issues around the main transition time of the top speeds in the game. We are going to look at Ovechkin, whose game is not generally based on speed, compared to Kane, who is a much speedier and dynamic player. Around the 2012-2013 lockout is seemingly when the speed game really took off. It also shows a bit of a transition in the data in the three charts below. See for yourself:
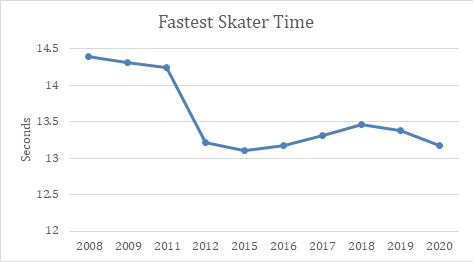
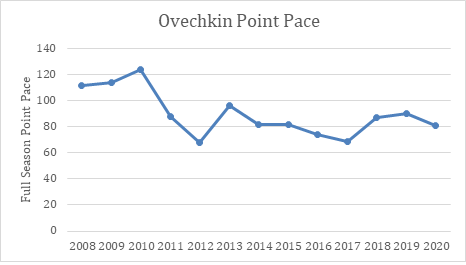
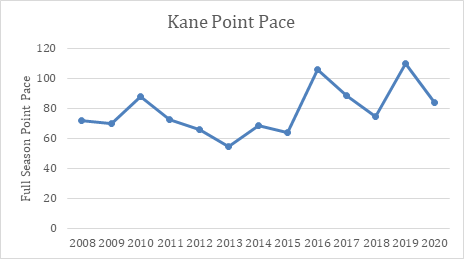
Looking at their career point paces alongside the top speeds from the competition as shown above, there's a noticeable similarity between the trends of the data. Now I know that this is a coincidental find to some extent but looking at a dominant player like Ovechkin whose career track did not follow the usual development path, it's interesting to wonder why he has never topped his numbers from his first three seasons. Ovechkin's highs and lows match up to a very similar shape as that of the top speed of the NHL players, where the 2012 season was a low point for Ovie, as well as the start of a set of much faster times in the NHL skills competition. On the flip side, Kane's numbers do jump around, but the general upward trend, especially after 2012, could be in part to Kane adapting to a speedier NHL, which suits his style of play
This doesn't mean that players whose games are based solely off speed are always going to better than players who are shooters, passers, or net-front guys, however, the ice does seem to be tilting slightly in favour of the players with more of a speed aspect to their game.
****
What does all of this have to do with contracts? Basically nothing. However, in cap leagues we are constantly trying to sort out how to best allocate our money, and this at least helped settle a few debates in my mind as to whether I should be changing my approach to spending on hits (no), and whether the game is continually moving in the favour of the speedy players (a little, but not to the extent that it should affect a lot of fantasy decisions).
****
While we wait for hockey to return, stay safe everyone!
If you have questions or comments about the process or the data from this week, let me know. As this also shows, I'm up for whatever kinds of article requests you can come up with. You can find me on Twitter @alexdmaclean.
All statistics are all pulled from FrozenTools.
****
Previous Capped articles:
Impacts of Recent and Potential Signings
Discussing The Potential Picks for Seattle's Expansion Draft
Related Posts
UPCOMING GAMES
Starting Goalies
Top Skater Views
| Players | Team | |
|---|---|---|
| ELIAS PETTERSSON |
| |
| J.T. MILLER |
| |
| LANE HUTSON |
| |
| SETH JARVIS |
| |
| EVAN BOUCHARD |
| |
Top Goalie Profile Views
LINE COMBOS
| Frequency |
| |
|---|---|---|
| 22.6 | TYLER TOFFOLI SEAN MONAHAN NIKOLAJ EHLERS | |
| 20.1 | COLE PERFETTI RASMUS KUPARI MASON APPLETON | |
| 13.9 | GABRIEL VILARDI BRAD LAMBERT ALEX IAFALLO | |
DobberHockey Podcasts

Keeping Karlsson: No. 533 – Ultimate Champion Interview + Playoff Preview
On this week’s Keeping Karlsson Fantasy Hockey Podcast mega-show, Elan and Brian gather and analyze the latest fantasy hockey news, notes and data.

Fantasy Hockey Life: Tim-Eh’s Time in the TIDY Top Tier
When one of the managers in the TIDY league top tier left midseason, Patron Tim volunteered to give up his excellent team to take over a mid-season orphan fighting to escape relegation. And Tim did not go quietly. Ryan, Jesse and Victor welcome Tim to talk through his experience and the trades he made in […]
Keeping Karlsson: Better Off Nedeljkovic
On this week’s Keeping Karlsson Fantasy Hockey Podcast mega-show, Elan and Brian gather and analyze the latest fantasy hockey news, notes and data from the past season to work on projecting the 2023-24 NHL and fantasy hockey season. — Join the Keeping Karlsson patron community! Patrons get guaranteed KKUPL invitations, plus monthly bonus AMA episodes, and full access to […]
Fantasy Hockey Life: FHL Player Cards with Brandon
Our guy Brandon has been doing great work behind the scenes to great Fantasy Hockey Life prospect player cards, visualizations with the metrics we care about most – including BASH. These are a great tool to catch at a glance the stats for upcoming players. Jesse interviews Brandon and Victor on the decisions behind what […]
Keeping Karlsson: Short Shifts – One Final Lap
Lewis goes for a solo skate to bring Short Shifts season five to a close. He starts by covering some of the headlines including broken records for Quinn Hughes and Nikita Kucherov, taps the stick for Jeremy’s brilliant call on Matchup Maximizer to stream Trevor Moore for his hat trick, and celebration for Wyatt Johnston […]