As the fantasy hockey season crosses its one-third mark, a critical reassessment of earlier strategies becomes essential. This article revisits previous analyses, offering a mid-season update enriched with the latest data and advanced metrics. By re-evaluating player performances and statistical trends at this crucial juncture, we aim to provide a grounded, data-driven perspective for fantasy hockey enthusiasts. The updated graphs and in-depth data analysis included here are not just revisions; they are vital tools for recalibrating strategies in a season characterized by volatility and emerging patterns. This piece serves as a guide for those seeking to optimize their decision-making process, whether to maintain a league lead or engineer a turnaround. Let’s explore the insights that the current season’s data offers and understand its implications for the remainder of the fantasy hockey campaign.
Efficiency Analysis in Fantasy Hockey: TOI vs Points
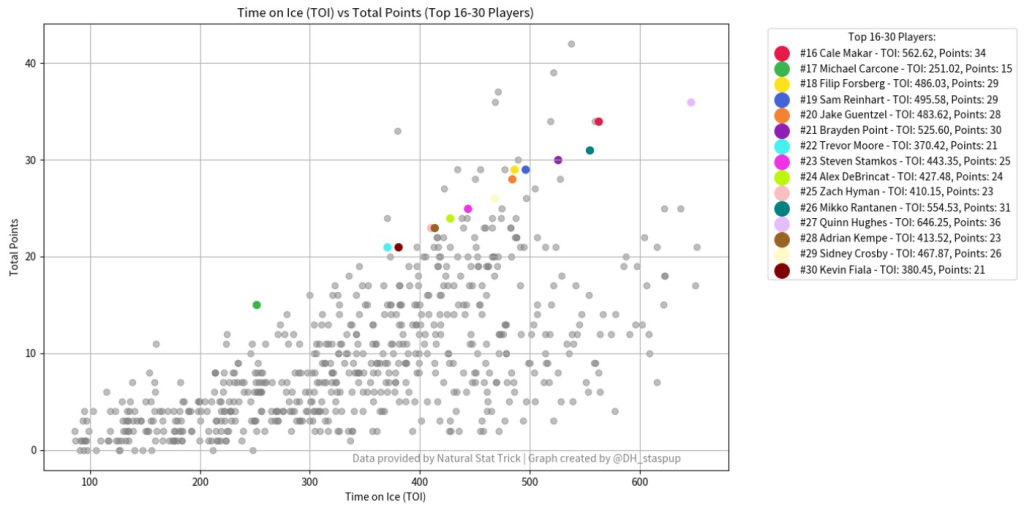
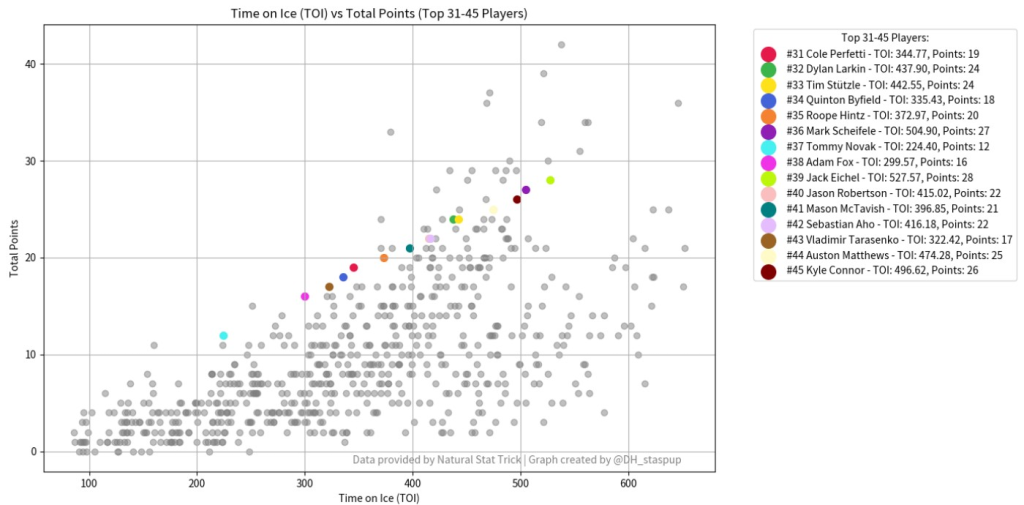
In the realm of fantasy hockey, efficiency is as crucial as raw performance. The upcoming graphs offer a focused analysis of Time on Ice (TOI) against Total Points, providing insights into player productivity. This analysis, split into three categories (Top 1-15, 16-30, and 31-45 Players), highlights efficiency across various TOI levels. These visualizations are key in identifying players who maximize point-scoring within their ice time, offering a critical perspective for strategic decisions in fantasy hockey.
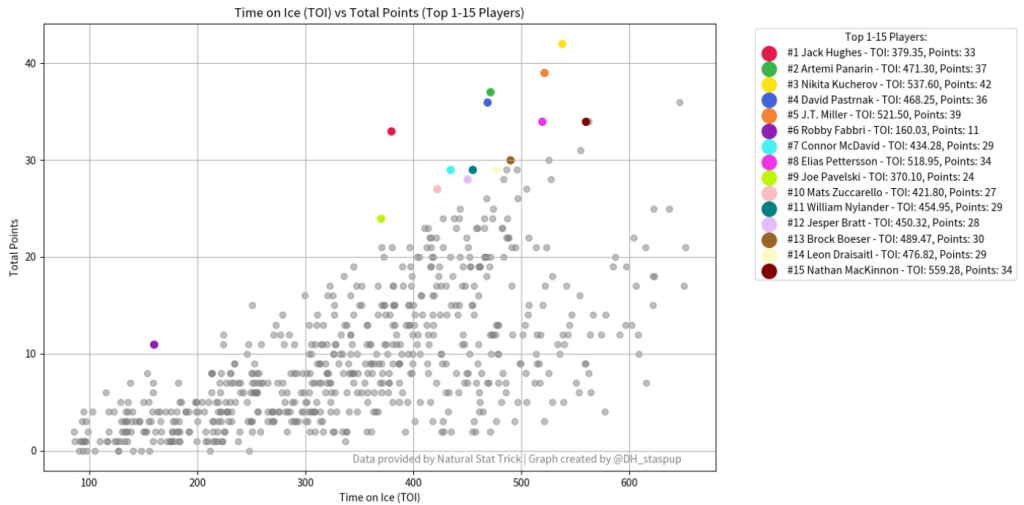
The series of graphs titled ‘Time on Ice (TOI) vs Total Points’ offer a unique perspective on player efficiency in fantasy hockey. To interpret these graphs effectively, imagine a bar graph where each ‘TOI-Block’ represents a segment on the x-axis. In this context, the x-axis (Time on Ice) is segmented into blocks, each representing a range of TOI that players fall into. The y-axis indicates the Total Points scored by the players.
Within each TOI-Block, players are plotted based on the total points they have accumulated. Those who appear higher on the y-axis within their respective TOI-Block are demonstrating greater efficiency. This means they are maximizing their point-scoring opportunities in the amount of ice time they have received. Essentially, players who achieve more points in less TOI are highly efficient, making them valuable assets in fantasy hockey.
By dividing the analysis into three separate graphs (Top 1-15 Players, Top 16-30 Players, and Top 31-45 Players), we gain a clearer view of efficiency across different performance tiers. This segmentation allows us to identify not just the overall top performers, but also those who excel within their specific TOI range.
This approach to analyzing player data underscores the importance of considering both the quantity (Time on Ice) and quality (Points scored) of a player's performance. It highlights players who may not have the most ice time but utilize their time effectively to contribute to their team's success, thus offering valuable insights for making informed decisions in fantasy hockey leagues.
Analyzing Player Efficiency: Shots and Shooting Percentages
Precision is paramount in fantasy hockey—a player’s value is often found in their ability to capitalize on shooting opportunities. This analysis presents a critical look at Shots on Goal versus Shooting Percentage (SH%), segmented into three tiers of player rankings (Top 1-15, 16-30, and 31-45). The graphs illustrate the correlation between the frequency of shots and the rate of successful goal conversions, providing a clear depiction of player efficacy. For fantasy hockey managers, these insights offer a quantitative foundation for optimizing lineup choices and maximizing scoring potential.
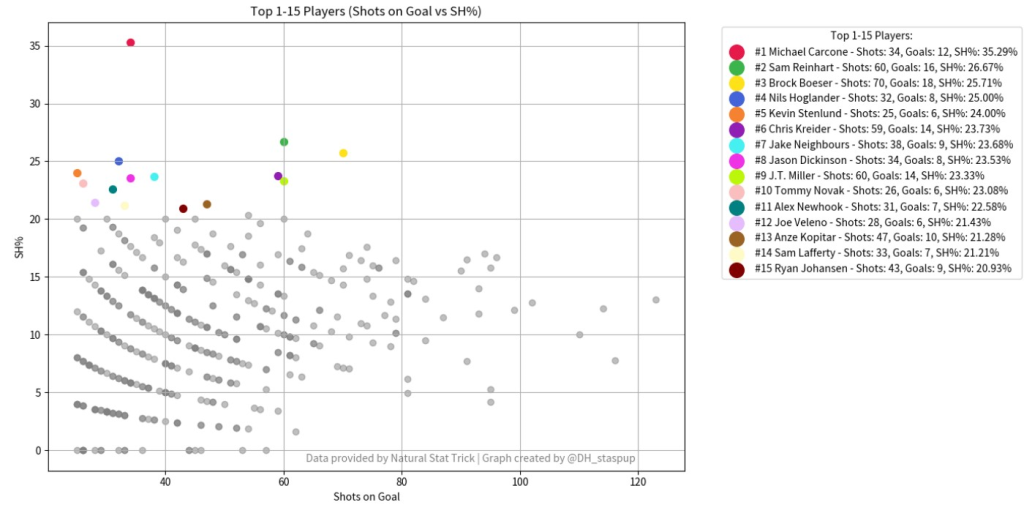
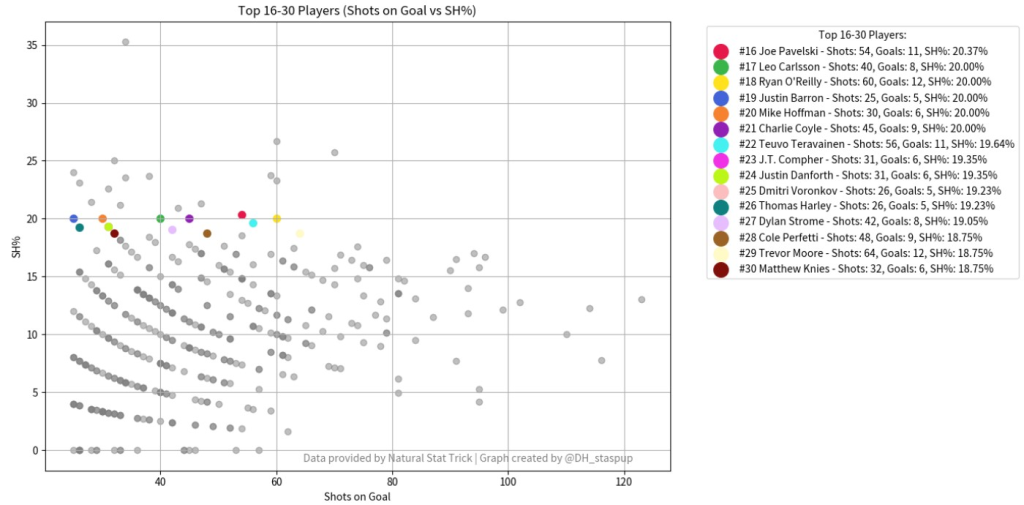
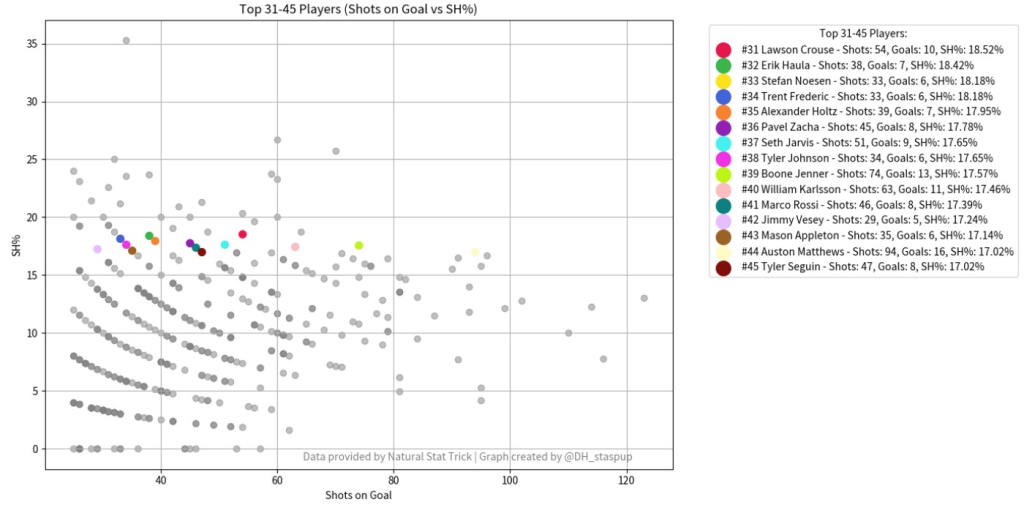
The graphs showcasing ‘Shots on Goal vs. Shooting Percentage (SH%)’ dissect player performance from a lens of precision and effectiveness. To analyze these graphs, focus on the relationship between the number of shots taken (x-axis) and the player’s shooting percentage (y-axis).
Players plotted higher on the y-axis have a higher SH%, indicating a higher efficiency in scoring goals relative to their total shots taken. This efficiency metric is crucial as it reflects a player’s proficiency in turning shots into goals. It’s not just about how many shots a player takes but how well they capitalize on these opportunities.
The segmentation into three distinct graphs for Top 1-15, 16-30, and 31-45 players allows for a comparison within and across these performance brackets. For instance, a player with fewer shots but a higher SH% might be a more strategic choice than one with many shots but a lower conversion rate, especially in tight matchups where every goal counts.
In essence, these visual data points guide fantasy hockey managers to discern the sharpshooters who maximize goal-scoring chances. This analysis is key to identifying under-the-radar players who, despite a lower volume of shots, demonstrate the capacity to contribute significantly to their teams with high-quality attempts. Such insights are invaluable for optimizing fantasy rosters and making strategic plays throughout the hockey season.
Harnessing Efficiency Metrics for Fantasy Hockey
The mid-season data analysis emphasizes the critical role of efficiency in player selection. As demonstrated, players with optimal Time on Ice (TOI) to Points ratios and superior Shots on Goal to Shooting Percentage (SH%) conversions are the keystones of a robust fantasy hockey strategy. These insights should guide managers in their pursuit of competitive advantage, encouraging a focus on quality over quantity in player performance.
For any questions or further discussion on this article or any future, I am available for contact on Twitter/X @DH_staspup. Feel free to DM to see any specific graphs based on these metrics.
Related Posts


UPCOMING GAMES
| Oct 07 - 17:10 |
| vs |
| |
| Oct 07 - 20:10 |
| vs |
| |
| Oct 07 - 22:10 |
| vs |
| |
Starting Goalies
Top Skater Views
| Players | Team | |
|---|---|---|
| JACKSON BLAKE |
| |
| BRADY TKACHUK |
| |
| AUSTON MATTHEWS |
| |
| RYAN DONATO |
| |
| JAKE GUENTZEL |
| |
Top Goalie Profile Views
| Players | Team | |
|---|---|---|
| CARTER HART |
| |
| ILYA SOROKIN |
| |
| FILIP GUSTAVSSON |
| |
| JEREMY SWAYMAN |
| |
| JET GREAVES |
| |
LINE COMBOS
| Frequency |
| |
|---|---|---|
| 27.0 | JAMES VAN RIEMSDYK KENT JOHNSON ADAM FANTILLI | |
| 21.6 | SEAN MONAHAN KIRILL MARCHENKO BOONE JENNER | |
| 20.5 | DMITRI VORONKOV COLE SILLINGER MATHIEU OLIVIER | |
DobberHockey Podcasts

Keeping Karlsson: Because It’s the KKUPFL, Season 11
Elan and Brian reveal a key change for Season 11 of the Keeping Karlsson Ultimate Patron Fantasy League (KKUPFL), the world’s top fantasy hockey league. They also share and consider feedback from Season 10 managers, responding with tips and thoughts on fantasy hockey league building and philosophy.

Fantasy Hockey Life: Los Angeles Kings with Dennis Bernstein
Dennis Bernstein of The Fourth Period is here to report on the LA Kings.
Keeping Karlsson: Red Boys of 2024-25
Elan and Brian dig into the NHL players who started strong but sputtered badly in the second half of 2024-25, and how much this impacts their desirability for 2025-26 NHL fantasy hockey drafts.
Fantasy Hockey Life: Ottawa Senators with Alex Adams
Alex Adams of Sportsnet is here to report on the Ottawa Senators. Jesse and Victor interview Alex about returning pros Tim Stutzle, Drake Batherson, Brady Tkachuk, Dylan Cozens, Claude Giroux, Shane Pinto, Ridly Greig, Fabian Zetterlund, Jake Sanderson, Thomas Chabot, Jordan Spence, Linus Ullmark, and Leevi Meralainen. In Cat’s Instincts, Cat Silverman of InGoal mag […]
Fantasy Hockey Life: Washington Capitals Preview with Dan Holmi of Locked on Caps
Dan Holmi is here to report on the Washington Capitals. Jesse and Victor interview Dan about returning pros Alex Ovechkin, Dylan Strome, Aliaksei Protas, Pierre-Luc Dubois, Tom Wilson, Connor McMichael, Ryan Leonard, John Carlson, Jakob Chychrun, Rasmus Sandin, Logan Thompson, and Charlie Lindgren. In Cat’s Instincts, Cat Silverman of InGoal mag breaks down Garin Bjorklund. […]