In the strategic landscape of NHL hockey, the potency of power plays cannot be overstated. They are moments where games can pivot, and players’ talents can shine or falter under pressure. This article takes a deep dive into the analytical world, focusing on Individual Points Percentage (IPP) and Individual Expected Goals (ixG)—metrics that reveal the intricate dynamics of a player’s performance during these critical segments of the game. By dissecting IPP and ixG, we aim to illuminate the depth of players’ contributions to their teams’ offensive surges during power plays.
Understanding the Metrics
To truly appreciate a player’s power play prowess, we must delve into IPP and ixG. The former is the proportion of scoring plays a player directly contributes to while on the ice during a power play. It’s an encompassing metric that captures not only the player's ability to score but also to enhance the scoring chances for teammates.
The latter – ixG – is derived from advanced predictive models that evaluate the likelihood of a player scoring from their specific shot locations and types during power plays. It accounts for factors such as shot angle, distance, and situational context, offering a sophisticated estimate of a player’s scoring chances.
By integrating IPP and ixG, analysts gain a powerful perspective on a player's comprehensive offensive capabilities during power plays. A high IPP may point to a player’s central role in the power play unit, while a high ixG underscores their threat as a scorer. These metrics are pivotal in discerning not just the frequency of a player’s contributions, but also the quality and potential impact of their offensive actions.
Understanding these metrics in tandem allows teams and fans alike to move beyond box-score stats and appreciate the finer nuances of player contributions that are critical during the high-stakes moments of power plays.
Methodology
The methodology employed in this analysis begins with the careful selection of NHL player data, focusing specifically on those with a significant power play presence. Criteria for inclusion are stringent: players must have participated in at least 10 games and logged a minimum of 50 minutes on power play time. The chosen data points are then plotted on a scatter graph, comparing IPP to ixG for each player. This visual representation allows for an immediate grasp of where players stand in relation to each other in terms of power play productivity and efficiency. The scatter plot serves as a foundation for deeper analysis, identifying trends, outliers, and drawing correlations between a player’s expected and actual contributions during power plays.
Analysis and Findings
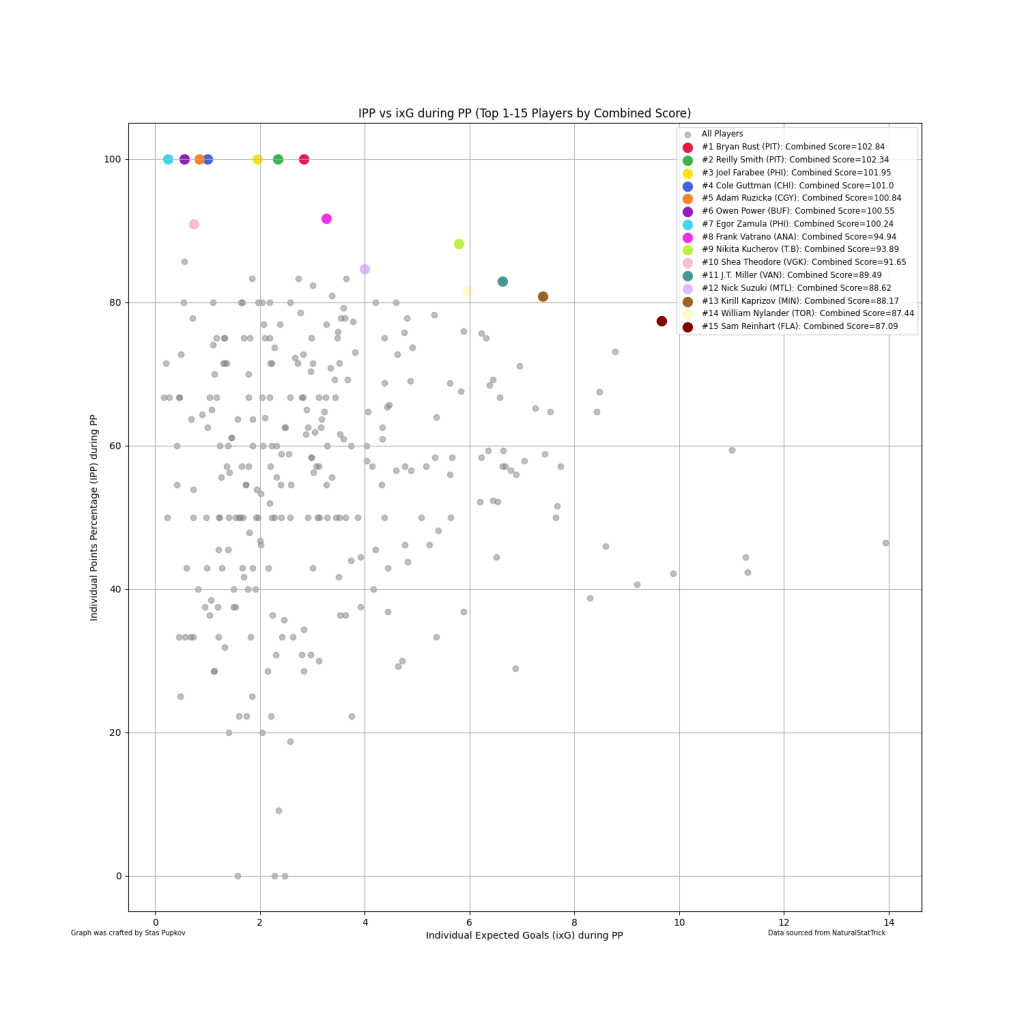
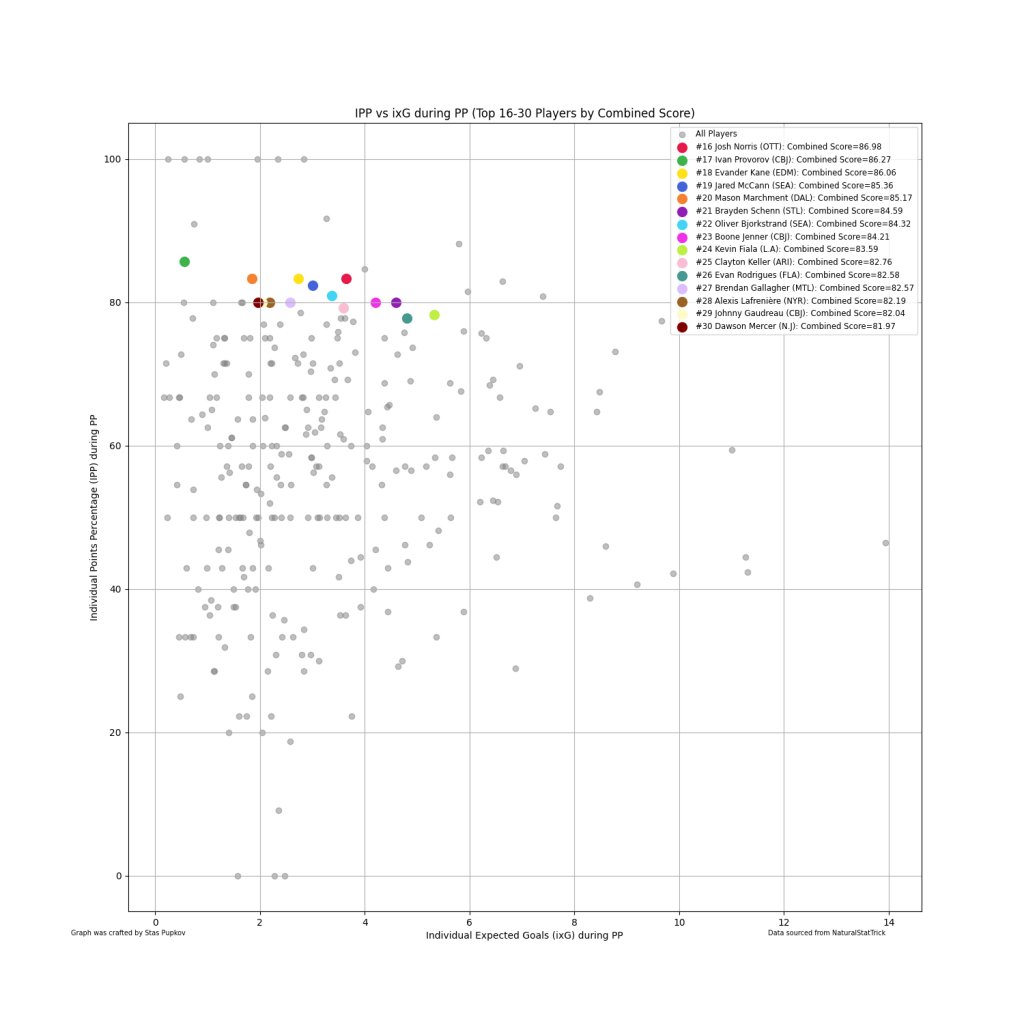
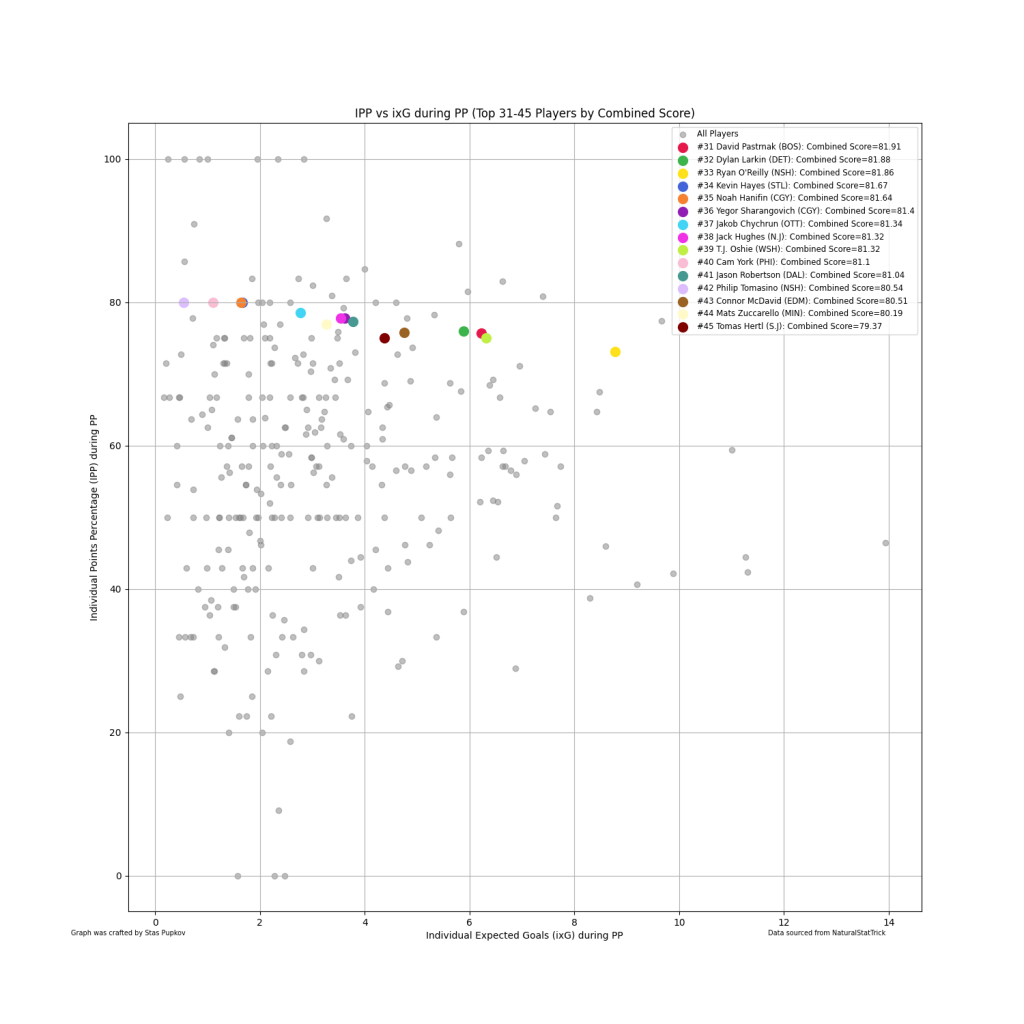
Our scatter plot analysis of IPP versus ixG yields a multi-dimensional view of player performance during power plays. Players with high IPP scores are those whose influence permeates throughout the power play, contributing to goals whether through direct scoring or assists. Conversely, players with high ixG scores demonstrate an ability to create high-quality scoring opportunities, even if not all result in a goal.
A particularly revealing aspect of the scatter plot is the relationship between IPP and ixG, which can vary greatly among players. Some players may have a high ixG but a lower IPP, suggesting they are in positions to score but may not be converting as expected. Others may have a high IPP but lower ixG, indicating they are capitalizing on chances or are involved in plays leading to goals by others.
The analysis also identifies outliers – players whose performance in power plays defies common trends. These individuals may have unique skills or roles that allow them to exceed expectations in either metric.
Interpreting the Graph
Interpreting the IPP vs. ixG scatter plot requires an understanding of the axes. The x-axis (ixG) reflects the expected goals a player is likely to score based on shot quality, while the y-axis (IPP) measures the percentage of team scoring plays a player contributes to during power plays. Players in the upper right quadrant excel in both metrics, indicating they are both creating and finishing scoring opportunities. Those in the lower right may be creating chances but not finishing, whereas players in the upper left are contributing to goals without necessarily creating high-quality shots. The lower left quadrant players may be underperforming in both areas or could be facing a streak of bad luck.
Conclusion
The analytical deep dive into IPP and ixG has provided a compelling narrative about player contributions during NHL power plays. Players who excel in both metrics are invaluable during these crucial game moments, while those with room to improve offer opportunities for strategic development. For team management, these insights can inform roster decisions and power play tactics. Fantasy hockey players, meanwhile, can leverage this data to identify undervalued players and potential breakout stars. Ultimately, this analysis reinforces the significance of power play dynamics in the pursuit of victory on the ice.
Thank you for reading and have a great rest of your day!
Twitter/X – @DH_staspup for any questions, corrections, or comments
If you want to see how your team looks on the graph, DM me a list/photo of your roster.
Related Posts
UPCOMING GAMES
Starting Goalies
Top Skater Views
Top Goalie Profile Views
| Players | Team | |
|---|---|---|
| JAKUB DOBES |
| |
| ILYA SOROKIN |
| |
| ILYA SAMSONOV |
| |
| CARL LINDBOM |
| |
| JOHN GIBSON |
| |
LINE COMBOS
| Frequency |
| |
|---|---|---|
| 20.2 | DAVID PASTRNAK ELIAS LINDHOLM MORGAN GEEKIE | |
| 14.6 | PAVEL ZACHA FABIAN LYSELL MARAT KHUSNUTDINOV | |
| 13.4 | CASEY MITTELSTADT VINNI LETTIERI COLE KOEPKE | |
DobberHockey Podcasts

Fantasy Hockey Life: Draftastic 2 – Q&A on the NHL Draft
Victor and Jesse are back in studio as Victor reports on his time at the NHL Draft and his outlook on fantasy rookie drafts. We discuss Michael Misa, Matthew Schaefer, Cole McKinney, Mason West, Milton Gastrin and Jacob Ihs-Wozniak with player audio. Victor also answers patron questions on which players you’ll want to target for […]
Fantasy Hockey Life: Draftastic 1 – NHL Draft Talk with Prospect Writers
Victor reports from the NHL Draft in Los Angeles.

Keeping Karlsson: Dobson is Free
On this edition of the Keeping Karlsson Fantasy Hockey Podcast, Elan and Brian ride the highway of National Hockey League offseason news, draft notes and transactions before the Free Agent Frenzy begins. All night long.
Fantasy Hockey Life: Calgary Flames with Steve MacFarlane
Steve MacFarlane is here to report on the Calgary Flames. Jesse and Victor interview Steve about returning pros Nazem Kadri, Jonathan Huberdeau, Matt Coronato, Connor Zary, Yegor Sharangovich, Morgan Frost, Martin Pospisil, Joel Farabee, MacKenzie Weegar, Rasmus Andersson, Zayne Parekh, Dustin Wolf, Dan Vladar, and Devin Cooley. In Cat’s Instincts, Cat Silverman of InGoal mag […]
Fantasy Hockey Life: Sheng Peng on the San Jose Sharks
Sheng Peng is here to report on the San Jose Sharks.