Welcome back to another week of Analytics Advantage. This week, we are shifting our focus to a playoff edition, where we will analyze and visualize the performance metrics that were so crucial during the 2023/24 regular season. Our goal is to bring attention to a few key graphs and metrics that can help highlight players who may be underappreciated or to further commend those already recognized for their excellent performance.
Previously, we have comprehensively covered each team that was eliminated in the first round of the playoffs (part one and part two). In this edition, we will delve into data visualizations from playoff games spanning April 20, 2024, to May 15, 2024.
There are some important considerations as we proceed. Teams that have advanced to the second round will naturally have more complete data sets. To ensure fair comparisons across different metrics and to account for varying game times and player usage, we will use z-scores instead of raw values specifically for the quadrant analysis. Z-scores standardize the data, allowing us to compare players on a level playing field, which mitigates the skew in numbers that could arise from different sample sizes.
It is crucial to remember that, as with any dataset, the information we present is not exhaustive enough to make judgments with 100% accuracy. Playoff hockey is highly unpredictable, and any player has the potential to be a game-changer on any given night.
Moving into the analysis, we will focus on two main visualizations: the players who have produced the most fantasy points per game and the PDO vs. xGF quadrant analysis. The fantasy points per game metric will highlight the most productive players in terms of overall contribution to their teams. Meanwhile, the PDO vs. xGF quadrant analysis will offer insights into how players are performing relative to expectations, shedding light on who might be getting unlucky or lucky and who is producing results that might not be immediately apparent on the scoresheet.
These visualizations and analyses are designed to provide a deeper understanding of player performance during the playoffs. We hope to identify players whose efforts might not be fully appreciated in traditional statistics and recognize those who are making significant impacts.
Fantasy Points Per Game Analysis
To kick off our analysis, let’s look at the players who have produced the most Fantasy Points Per Game (FPPG) during the playoffs. This metric is crucial as it gives us a comprehensive view of a player’s overall contribution, factoring in goals, assists, shots, blocked shots, and hits.
Overall Top 15 Players by FPPG
Our first graph displays the top 15 players in terms of FPPG. This visualization highlights the standout performers who have been instrumental for their teams during the playoffs. Each player’s performance is plotted against their Time On Ice (TOI), providing context on their efficiency and usage. The player that I would focus on is Sam Reinhart, as he is producing FPPG near the likes of Leon Draisaitl who has 20 points, while Reinhart only has 9. This means that Reinhart is producing and one of these main attributors to his FPPG is his league leading shots with a total of 46 shots in 10 games played. This is also producing rebounds, as he is top five in rebounds created with 10 (this places him tied for 3rd with Brent Burns and Cale Makar). Keep an eye on Reinhart as he seems to be an energy beacon for this elite Panther squad.
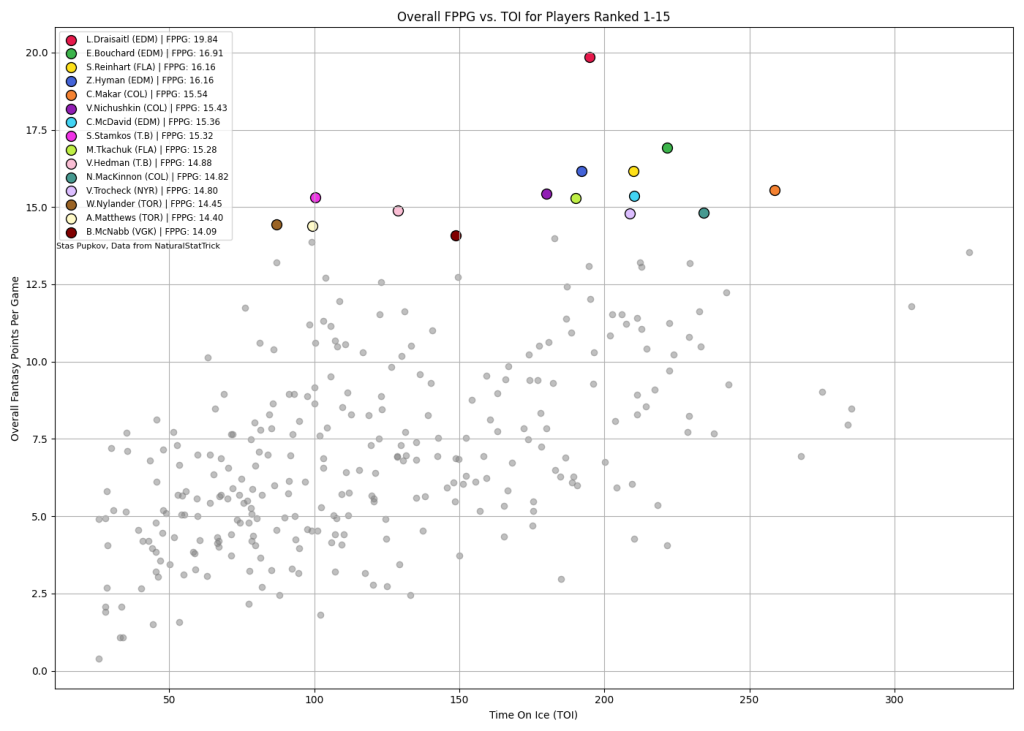
In this graph, we see a mix of offensive powerhouses and all-around contributors. Players with higher TOI and FPPG are likely those relied upon heavily by their teams, both in regular play and critical moments.
Top 15 by Defensive FPPG
Next, we narrow our focus to defense. Defense is the cornerstone of playoff hockey, and often contribute differently compared to more offensive minded players, so it’s insightful to view their performance separately. This graph shows the top 15 defensive players ranked by FPPG, also plotted against TOI. One player I would like to highlight is Jacob Trouba, who is one of the top FPPG players defensively, and one of the big reasons is his heart and sacrifice that is coming from his shot blocking numbers. He is 2nd in the league behind Chris Tanev, Tanev has 47 blocks, and Trouba has 45. You might be asking, where is Tanev in the top 15? Even though Trouba has 2 less blocks, the amount of hits he has laid has been top tier, as the only players above him have either played more games or have had outlier playoff hitting numbers. Trouba has posted 36 hits through nine games, which places him at 12th overall in hitting.
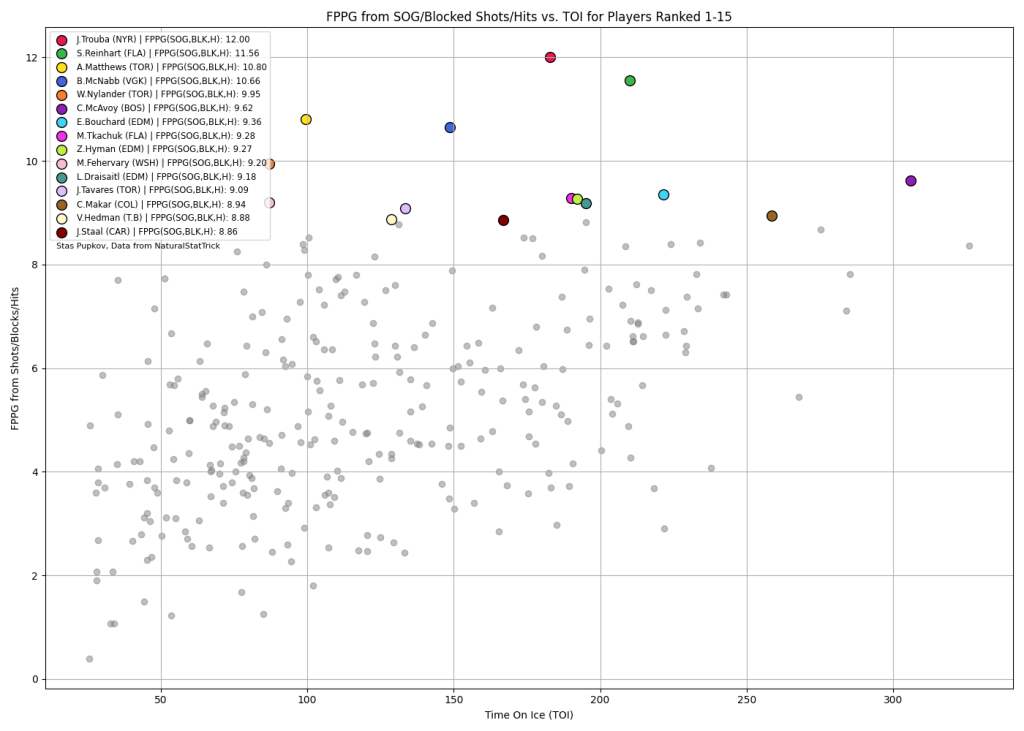
This visualization sheds light on which defensemen are not only strong in their primary defensive roles but also contribute significantly to their team’s offense through goals, assists, shots, and blocked shots.
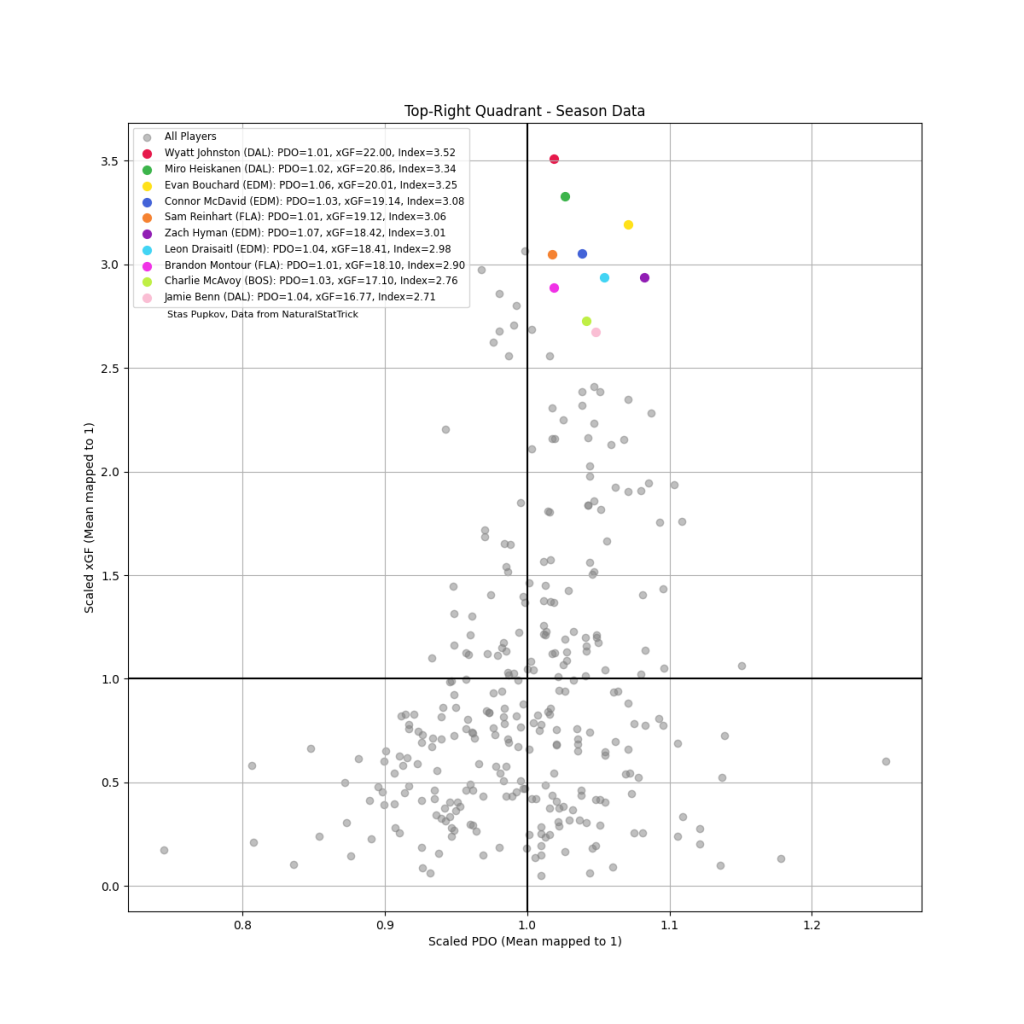
PDO vs. xGF Quadrant Analysis
Moving on to the PDO vs. xGF quadrant analysis, this visualization helps us understand how players are performing relative to their expected goals and actual outcomes. PDO (a combination of shooting percentage and save percentage) indicates luck or variance, while xGF (Expected Goals For) represents the quality of scoring chances a player generates.
Top-Right Quadrant (High xGF, High PDO)
Players in this quadrant are performing exceptionally well, both in generating high-quality scoring chances and converting them effectively. These players are likely key contributors, showcasing both skill and favorable outcomes.
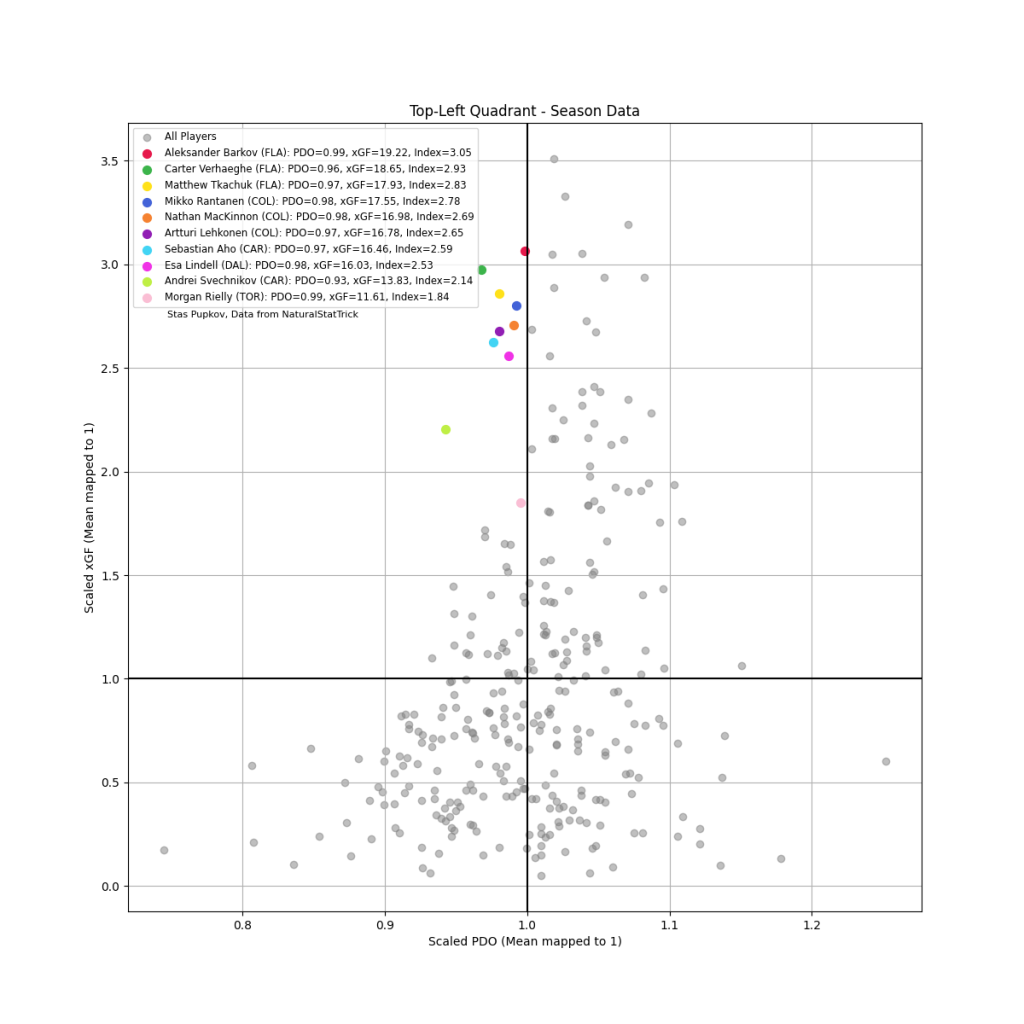
Top-Left Quadrant (High xGF, Low PDO)
This quadrant features players who are creating plenty of scoring opportunities but experiencing poor conversion rates. These players might be considered unlucky or suffering from poor finishing or goaltending support. However, their high xGF suggests they are still valuable assets.
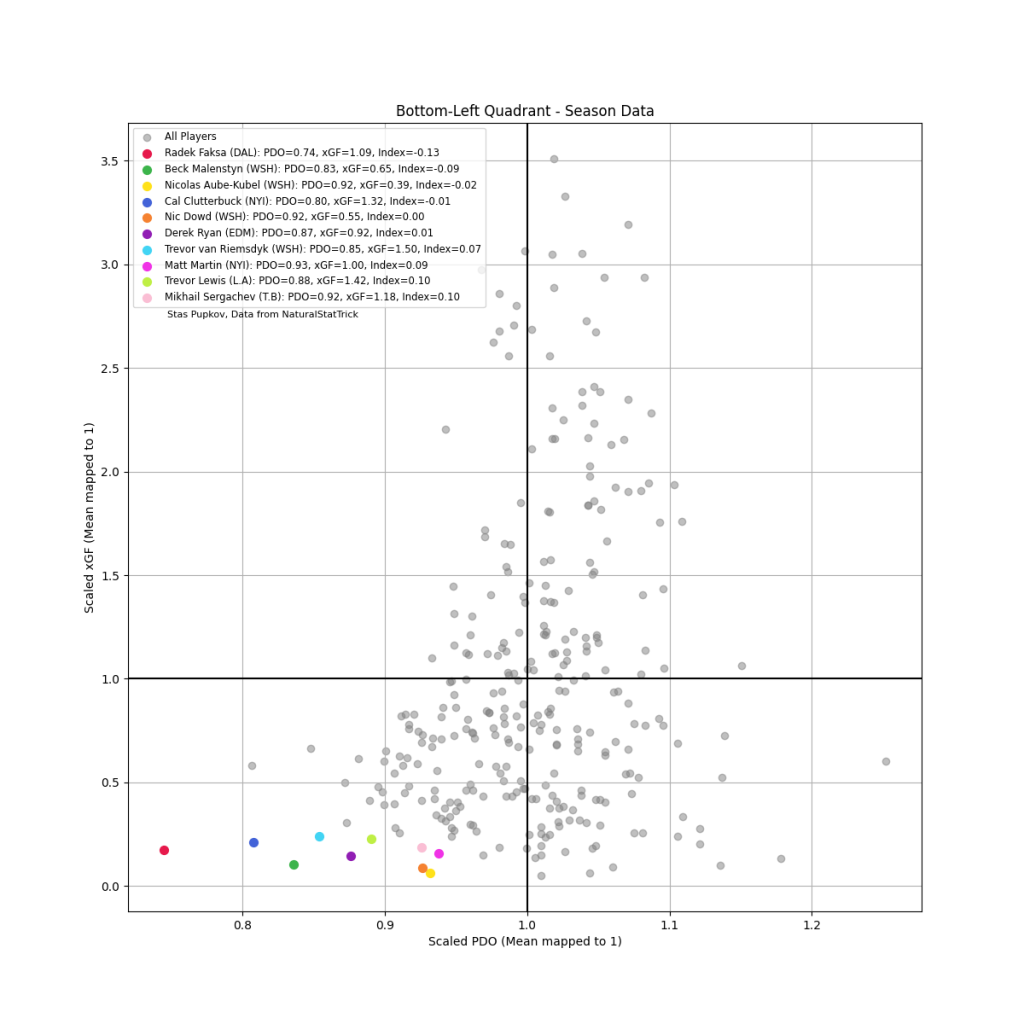
Bottom-Left Quadrant (Low xGF, Low PDO)
Players here are struggling both in generating scoring chances and in converting those they do create. This could indicate underperformance or tougher defensive roles. Identifying these players can help teams understand areas needing improvement.
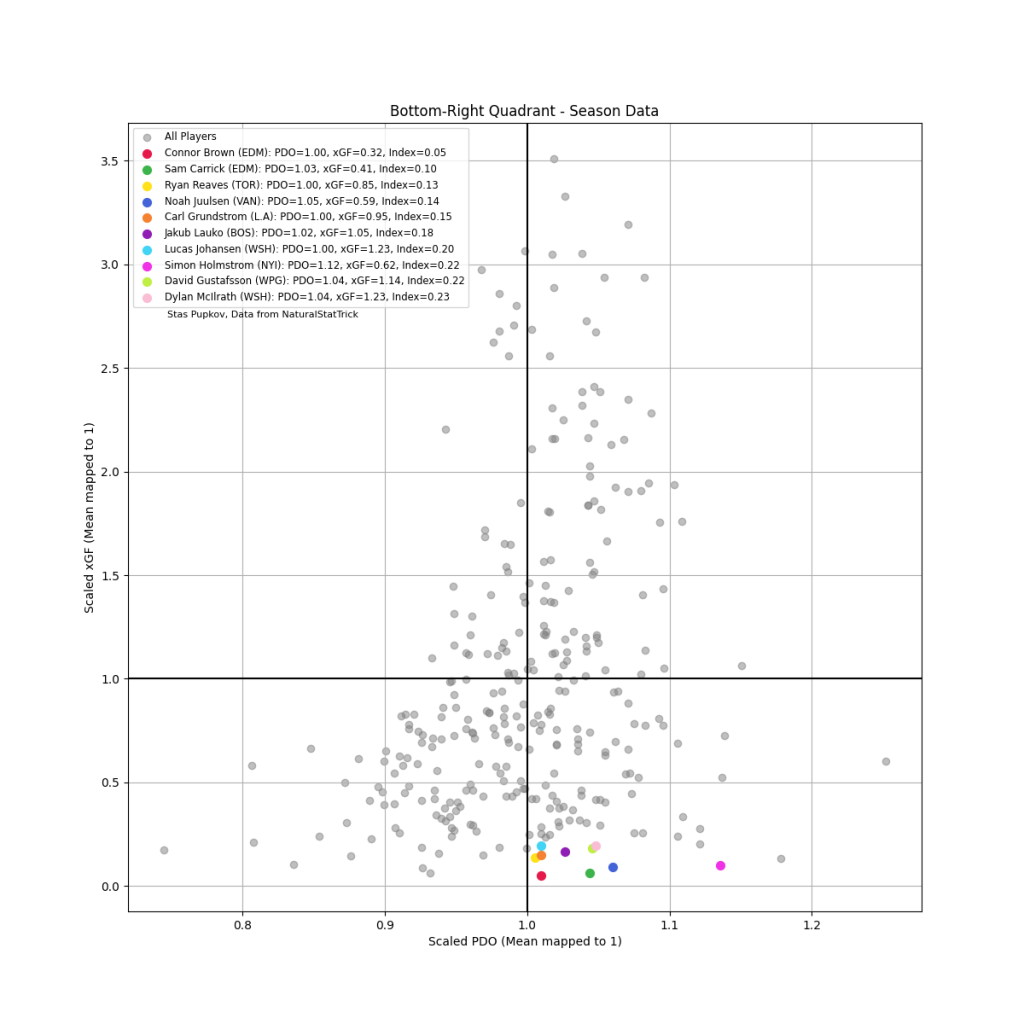
Bottom-Right Quadrant (Low xGF, High PDO)
Players in this quadrant have low xGF but high PDO, suggesting they are overperforming relative to their chance creation. These players might be benefiting from favorable shooting percentages or exceptional goaltending, which could indicate potential regression.
Conclusion
These visualizations provide a deeper understanding of player performance during the playoffs. By looking at FPPG and the PDO vs. xGF analysis, we can identify standout performers, potential breakout players, and those who might be under or overperforming relative to their underlying metrics.
Such insights are invaluable for coaches, analysts, and fans alike, offering a more nuanced view of the game beyond traditional statistics. As the playoffs continue, keep an eye on these metrics to see how player performances evolve and impact their teams’ success.
Thank you for reading and have a great rest of your day!
Twitter/X – @DH_staspup for any questions, corrections, or comments
Player Data sourced from NaturalStatTrick
Related Posts

UPCOMING GAMES
| Oct 07 - 17:10 |
| vs |
| |
| Oct 07 - 20:10 |
| vs |
| |
| Oct 07 - 22:10 |
| vs |
| |
Starting Goalies
Top Skater Views
| Players | Team | |
|---|---|---|
| JACKSON BLAKE |
| |
| LOGAN COOLEY |
| |
| KAAPO KAKKO |
| |
| DILLON DUBE |
| |
| CAL FOOTE |
| |
Top Goalie Profile Views
LINE COMBOS
| Frequency |
| |
|---|---|---|
| 19.8 | TREVOR ZEGRAS MASON MCTAVISH SAM COLANGELO | |
| 19.5 | ALEX KILLORN CUTTER GAUTHIER LEO CARLSSON | |
| 16.2 | FRANK VATRANO TROY TERRY RYAN STROME | |
DobberHockey Podcasts

Keeping Karlsson: Because It’s the KKUPFL, Season 11
Elan and Brian reveal a key change for Season 11 of the Keeping Karlsson Ultimate Patron Fantasy League (KKUPFL), the world’s top fantasy hockey league. They also share and consider feedback from Season 10 managers, responding with tips and thoughts on fantasy hockey league building and philosophy.

Fantasy Hockey Life: Los Angeles Kings with Dennis Bernstein
Dennis Bernstein of The Fourth Period is here to report on the LA Kings.
Keeping Karlsson: Red Boys of 2024-25
Elan and Brian dig into the NHL players who started strong but sputtered badly in the second half of 2024-25, and how much this impacts their desirability for 2025-26 NHL fantasy hockey drafts.
Fantasy Hockey Life: Ottawa Senators with Alex Adams
Alex Adams of Sportsnet is here to report on the Ottawa Senators. Jesse and Victor interview Alex about returning pros Tim Stutzle, Drake Batherson, Brady Tkachuk, Dylan Cozens, Claude Giroux, Shane Pinto, Ridly Greig, Fabian Zetterlund, Jake Sanderson, Thomas Chabot, Jordan Spence, Linus Ullmark, and Leevi Meralainen. In Cat’s Instincts, Cat Silverman of InGoal mag […]
Fantasy Hockey Life: Washington Capitals Preview with Dan Holmi of Locked on Caps
Dan Holmi is here to report on the Washington Capitals. Jesse and Victor interview Dan about returning pros Alex Ovechkin, Dylan Strome, Aliaksei Protas, Pierre-Luc Dubois, Tom Wilson, Connor McMichael, Ryan Leonard, John Carlson, Jakob Chychrun, Rasmus Sandin, Logan Thompson, and Charlie Lindgren. In Cat’s Instincts, Cat Silverman of InGoal mag breaks down Garin Bjorklund. […]