Welcome back to another week of Analytics Advantage! This week we are going to be looking at the exact same bar graph as last week (5-Year IPP), but this week it is going to be CorsiFor% (CF%) over the past five seasons, as well as more graphs because those do more talking than I could possibly do. I will talk about how to read each graph to make some educated guesses towards possible players to note for the 24/25 fantasy year.
What is CF%?
Corsi For Percentage (CF%) measures a player’s or team’s puck possession and shot attempt differential. It's calculated by taking the number of shot attempts (Corsi For) a player or team generates and dividing it by the total number of shot attempts (Corsi For + Corsi Against) while the player is on the ice, then multiplying by 100. In other words, CF% shows how much a player or team controls the puck and creates offensive opportunities compared to their opponents.
Why Analyze CF% Changes?
Watching CF% changes can reveal a lot about a player’s or team’s performance and potential. If a player’s CF% is rising, it means they're controlling the puck more and generating more scoring chances, which is a good sign for their future performance. On the flip side, if their CF% is dropping, it might indicate they're having trouble maintaining puck control or facing tougher competition.
CF% is great for spotting players who are making a big impact on the game, even if they're not scoring a lot of goals. While CF% shows how well a player or team is doing in terms of puck possession, it doesn't tell you everything about the quality of their shots or individual contributions. So, use CF% as part of a broader analysis to make the best fantasy hockey decisions.
Data Sources The data for this analysis was sourced from player statistics spanning the 2019-2024 NHL campaigns, obtained from NaturalStatTrick.
Data Processing Player statistics from the 2019-2024 campaigns were combined into a single dataset, then filtered for players who played at least ten games in each year to ensure a significant amount of playing time.
I have randomly selected seven players I thought had some valuable-looking graphs without needing other metrics to get a good idea of the trend. For reference, the league average CF% is very close to 50 every year, deviating slightly ±1 from 50. So even though it looks like the line is flat, it is very slightly different each year.
Many of the trends these graphs will show have been heavily tied into the success of the team, style of play, and linemates. It is very important to distinguish the difference between a player who is creating all of the good chances and a player benefiting from his team's elevated level play.
Graphs:
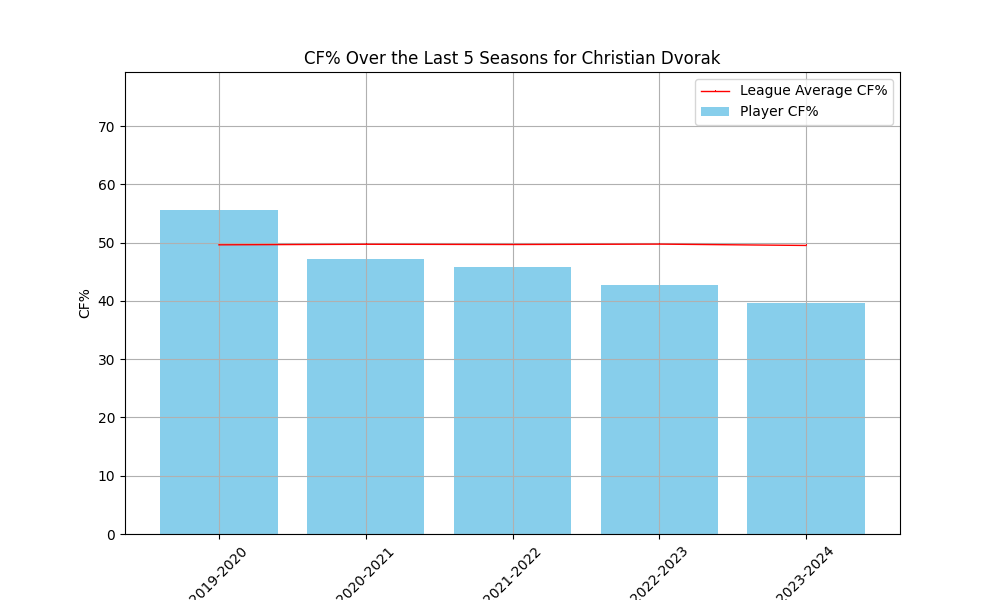
Christian Dvorak has seen a drop in production over the past five years, as he has been struggling with injuries that have limited his playing time and valuable development time for him in his prime years.
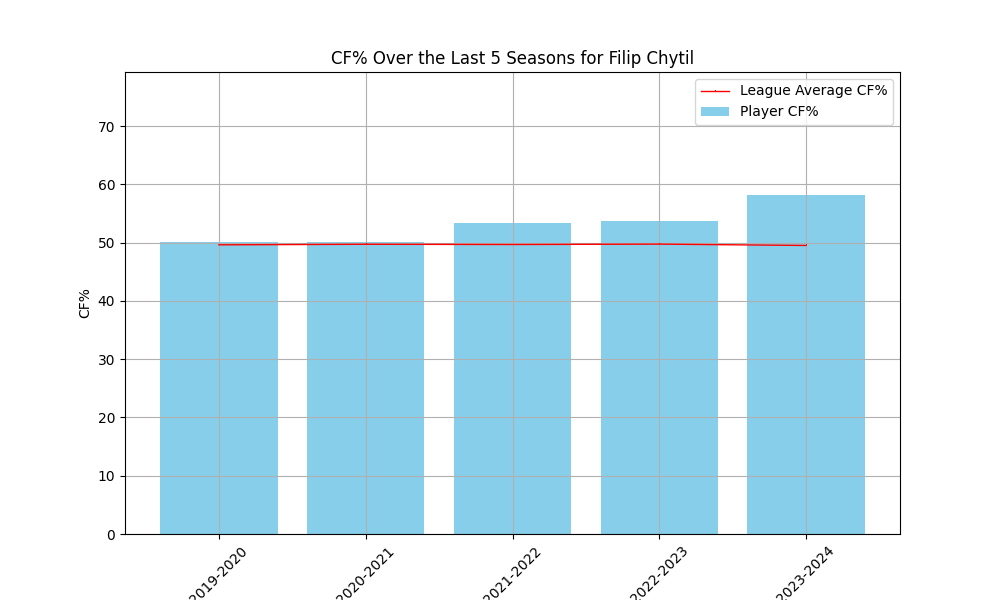
Filip Chytil was injured most of 23/24 after having a very good development jump in 22/23. He is expected to be a big part of the New York Rangers top-six forward group, and he has some playoff experience, even though he was very unproductive these playoffs.
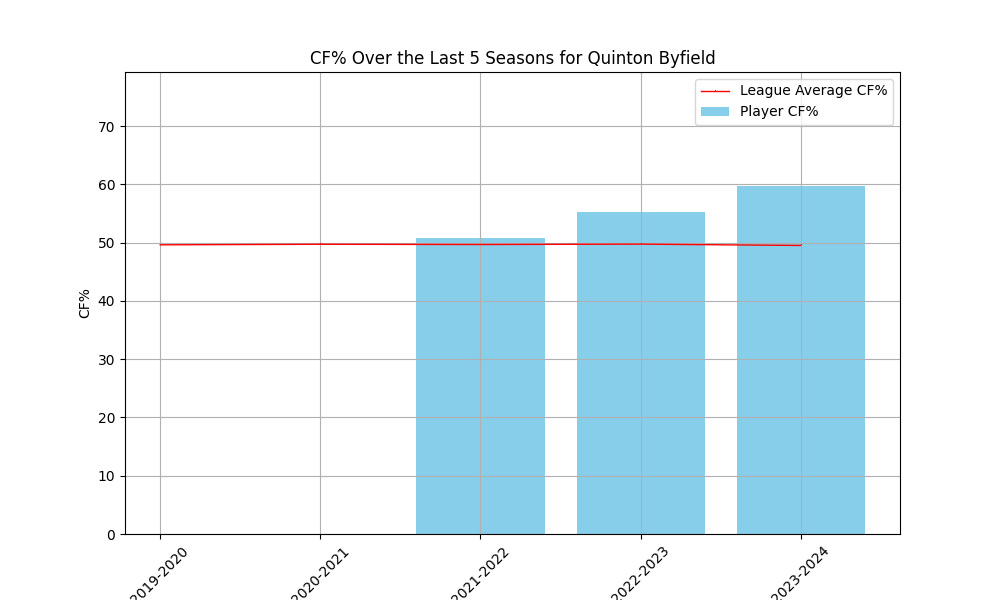
Quinton Byfield has been turning into a very solid forward and core of the Los Angeles Kings and the future of the team when Anze Kopitar and Drew Doughty are gone. He has shown growth every year, and he is going to hopefully show even more progress this upcoming year.
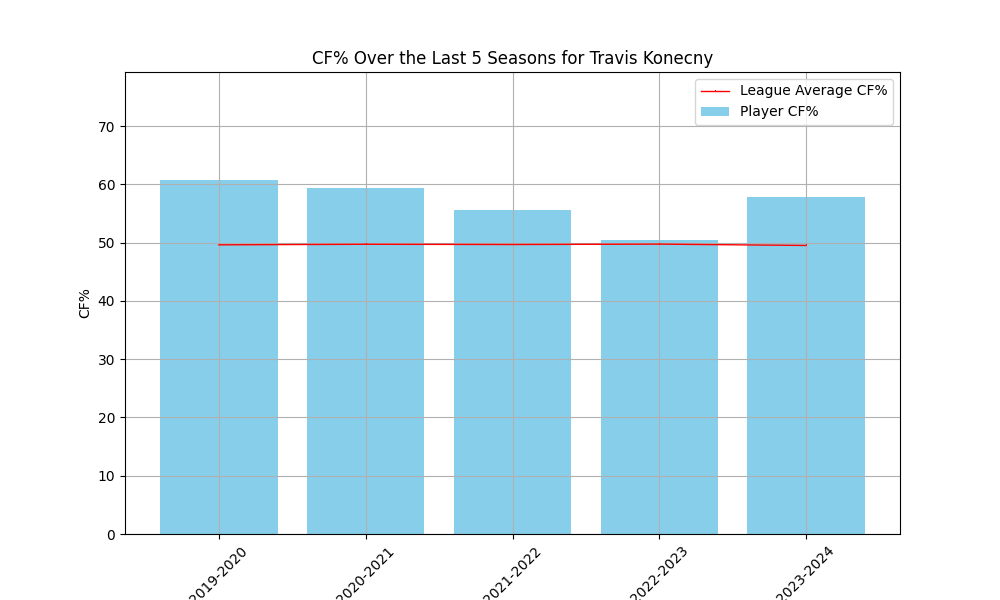
Travis Konecny has had five 20-plus goal campaigns in his career, and he is currently hot with back-to-back 30-goal campaigns. With Matvei Michkov coming sooner than expected, I believe that he will put up another 30-goal campaign alongside Michkov, and that the Flyers are trying to become competitive as soon as possible, as there are many opportunities to slide into the playoffs.
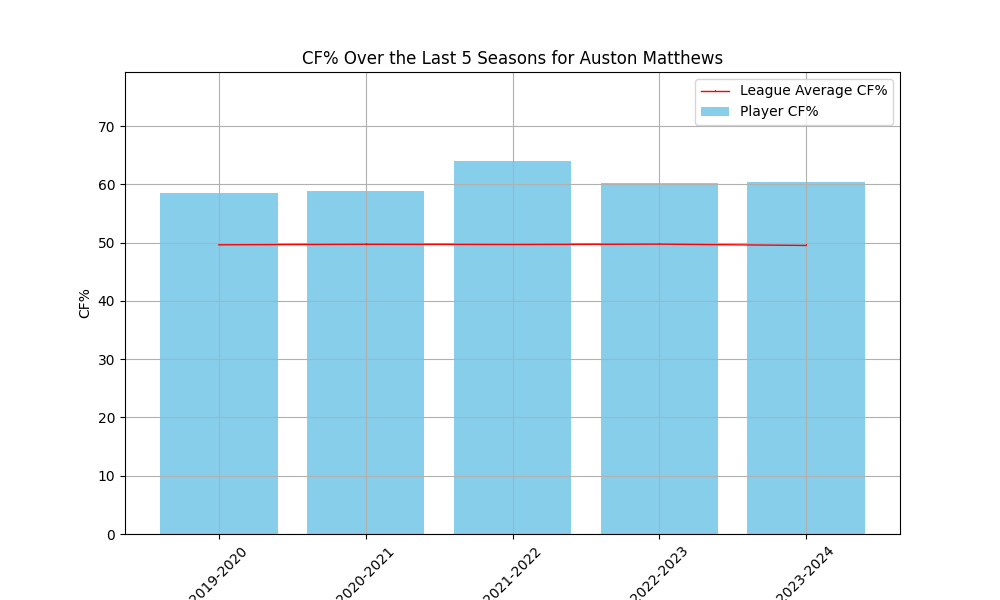
Auston Matthews is the offensive juggernaut he always is. He is here to show a player who is around a league-leading producer of his team every single year, and how valuable he is to the Maple Leafs' success.
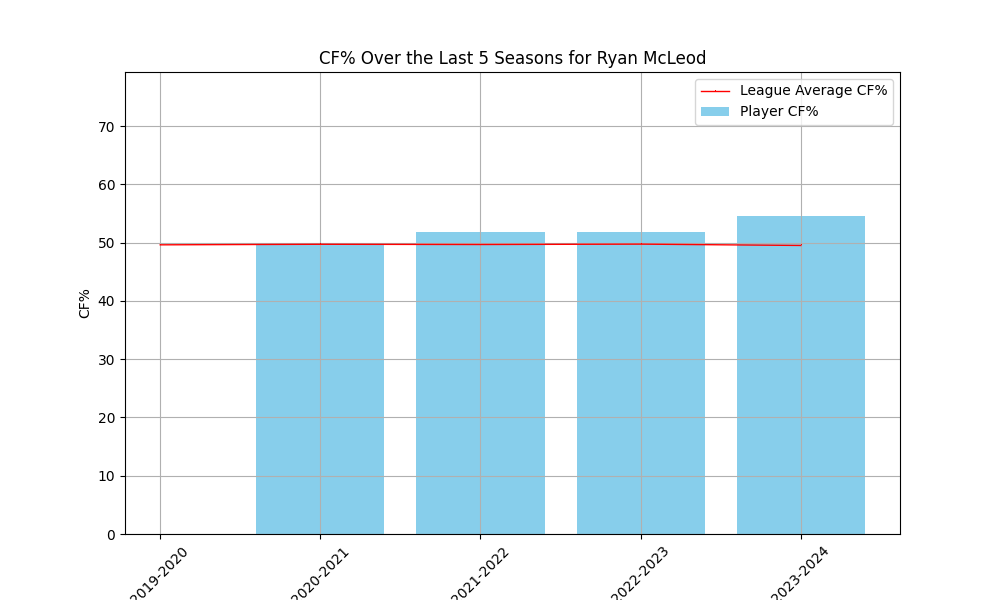
Ryan McLeod has been a part of an elite offense for a couple of years now, and he has slowly grown into a bigger part of it, but he was traded to the Buffalo Sabres this summer, and this new scene can allow him to be a bigger part of the offense. The Oilers heavily rely on the top players, and for McLeod from an individual stats standpoint, it was not a good fit. Buffalo should play him more and entrust him with a bigger role.
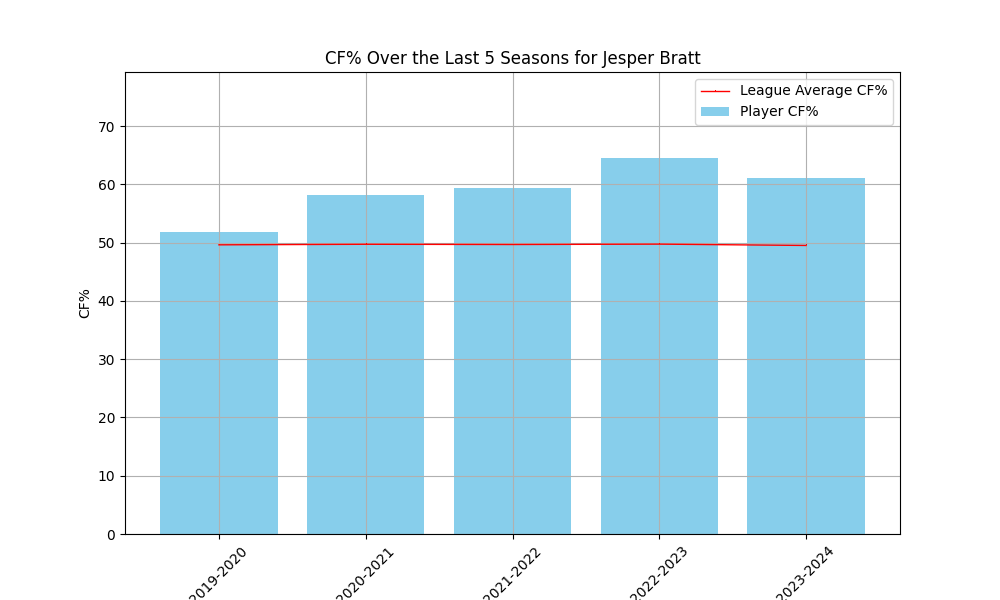
Jesper Bratt has exploded into his role with the New Jersey Devils. He has now put up three 70-point campaigns in a row, and he improved his stats when the Devils took a massive injury bug and had many setbacks this 23/24 year. The New Jersey offense looks even better. The whole team looks like they are going to be cup contenders with the moves that have been made this offseason, so I think that Bratt should see a point total around 70 again.
Thank you for reading and have a great rest of your day! Twitter/X – @DH_staspup for any questions, corrections, or comments Please feel free to ask for any player’s graph, I can post it or DM.
Related Posts


UPCOMING GAMES
| Oct 07 - 17:10 |
| vs |
| |
| Oct 07 - 20:10 |
| vs |
| |
| Oct 07 - 22:10 |
| vs |
| |
Starting Goalies
Top Skater Views
Top Goalie Profile Views
LINE COMBOS
| Frequency |
| |
|---|---|---|
| 13.9 | BRAYDEN POINT NIKITA KUCHEROV JAKE GUENTZEL | |
| 10.5 | NICK PAUL YANNI GOURDE CONOR GEEKIE | |
| 9.4 | LUKE GLENDENING ZEMGUS GIRGENSONS MITCHELL CHAFFEE | |
DobberHockey Podcasts

Keeping Karlsson: Because It’s the KKUPFL, Season 11
Elan and Brian reveal a key change for Season 11 of the Keeping Karlsson Ultimate Patron Fantasy League (KKUPFL), the world’s top fantasy hockey league. They also share and consider feedback from Season 10 managers, responding with tips and thoughts on fantasy hockey league building and philosophy.

Fantasy Hockey Life: Los Angeles Kings with Dennis Bernstein
Dennis Bernstein of The Fourth Period is here to report on the LA Kings.
Keeping Karlsson: Red Boys of 2024-25
Elan and Brian dig into the NHL players who started strong but sputtered badly in the second half of 2024-25, and how much this impacts their desirability for 2025-26 NHL fantasy hockey drafts.
Fantasy Hockey Life: Ottawa Senators with Alex Adams
Alex Adams of Sportsnet is here to report on the Ottawa Senators. Jesse and Victor interview Alex about returning pros Tim Stutzle, Drake Batherson, Brady Tkachuk, Dylan Cozens, Claude Giroux, Shane Pinto, Ridly Greig, Fabian Zetterlund, Jake Sanderson, Thomas Chabot, Jordan Spence, Linus Ullmark, and Leevi Meralainen. In Cat’s Instincts, Cat Silverman of InGoal mag […]
Fantasy Hockey Life: Washington Capitals Preview with Dan Holmi of Locked on Caps
Dan Holmi is here to report on the Washington Capitals. Jesse and Victor interview Dan about returning pros Alex Ovechkin, Dylan Strome, Aliaksei Protas, Pierre-Luc Dubois, Tom Wilson, Connor McMichael, Ryan Leonard, John Carlson, Jakob Chychrun, Rasmus Sandin, Logan Thompson, and Charlie Lindgren. In Cat’s Instincts, Cat Silverman of InGoal mag breaks down Garin Bjorklund. […]