Welcome back to another edition of Analytics Advantage. With the first round of the 2025 NHL Playoffs in full swing, I've shifted focus this week toward a more visual breakdown of team performance. Using data from Natural Stat Trick (postseason only, current through April 29), I've built four Tableau charts that explore different areas of team and player impact. These charts are interactive , you can hover over team logos, click to highlight specific players or teams, and use the filters to isolate matchups or group.
Rather than just drop visuals and call it a day, I'll walk through each one with a hockey lens: what it actually means to be "up and to the right," or low and left. These axes aren't just stat positions, they reflect style of play, team systems, and how things are going in real matchups. Let's get into it.
Goaltending: Save Percentage vs. Average Shot Distance
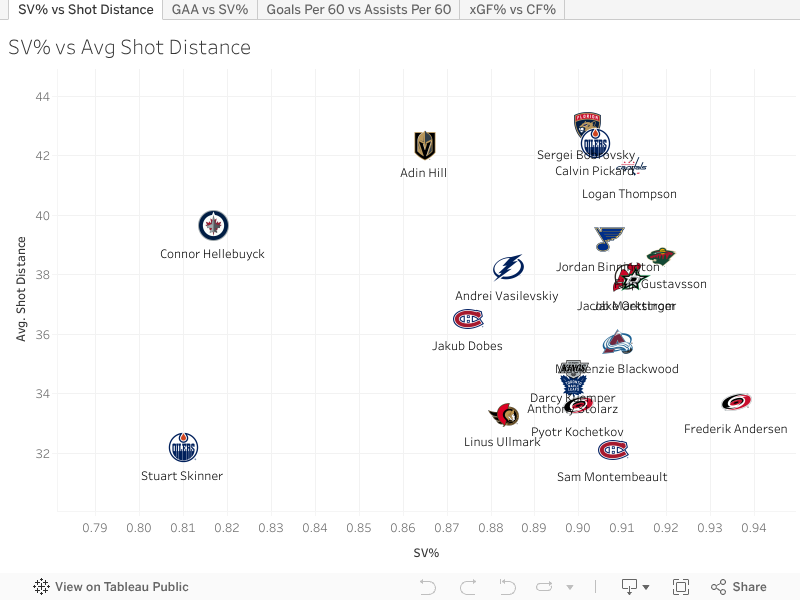
This first chart looks at Save Percentage (horizontal x-axis) and Average Shot Distance (vertical y-axis) for each playoff goalie. A higher SV% indicates better performance, while a higher shot distance suggests opponents are kept to the outside.
What jumps out immediately is the gap between Stuart Skinner and Calvin Pickard. Pickard has been excellent since stepping in, and a key factor might be the distance difference, Pickard is seeing shots come from roughly 10 feet farther out than Skinner was. That's a huge difference in the playoffs. Edmonton's structure in front of Pickard has tightened up, forcing opponents to shoot from less dangerous areas. That's helping him succeed.
Conversely, Skinner's numbers reflect a tougher workload, closer chances, more chaos in the slot, and tougher saves. And when you scan further right of Skinner on the chart, you'll see other goaltenders dealing with similar issues: teams that allow a lot of inside chances and expect their goalies to bail them out. That's rarely a sustainable formula.
Also worth noting is Connor Hellebuyck, who is sitting in an uncomfortably similar space to Skinner. A goalie of Hellebuyck's caliber to be performing this poorly, while facing that level of danger, is a clear red flag for Winnipeg. Meanwhile, Adin Hill appears to be handling things a little better, sitting slightly higher and further to the right.
There's a mid-cluster of goalies near the average for both metrics, but what that group tells us is mostly situational, average save rates and mid-distance chances could be matchup-dependent or the result of score effects. Either way, this visual sets the tone for how structured or scattered each team is in the crease.
Goaltending: Goals Against Average vs Save Percentage
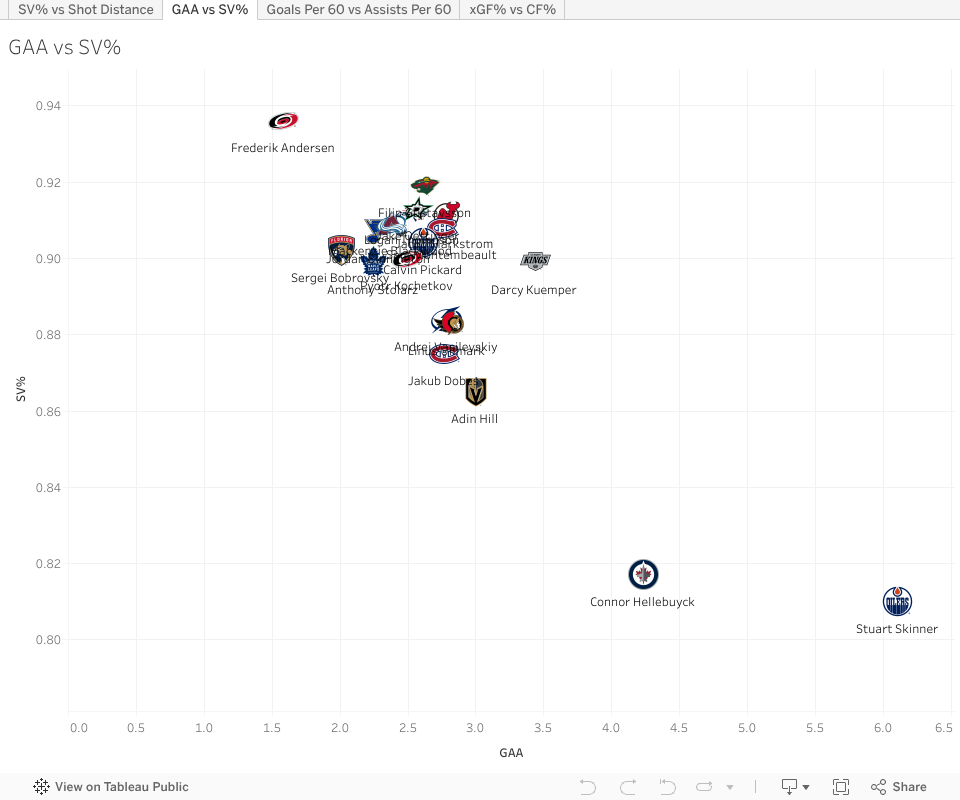
This second chart maps Goals Against Average (GAA) on the x-axis and Save Percentage (SV%) on the y-axis. It gives us a clearer view of which goalies are both stopping pucks and keeping their overall goals allowed low.
The key takeaway here is that Stuart Skinner and Connor Hellebuyck are isolated in the bottom right: High GAA, low SV%. That's the worst possible area to be in, and the fact that both are there says a lot about how their teams have fared so far. Neither is getting the results needed, and they're not doing enough to change momentum in a series. In Hellebuyck's case, we are talking about an expected 4-0, 4-1 series win, and comfortable, not a tight 2-2 series.
Darcy Kuemper, on the other hand, stands out a bit. He's been facing a high volume and still managing to perform reasonably well. While not elite on this chart, he's in a zone that reflects workload more than failure. You can also see goalies from teams that are already eliminated beginning to drift toward the lower clusters. That tells part of the story behind why those teams are out, or on the way out
The middle-right cluster includes teams still in the mix but relying heavily on saves to stay competitive. Teams in the top-left quadrant are the real standouts, those getting both consistent goaltending and strong defensive structure. Frederik Andersen is the best example of that. His numbers are excellent, and Carolina has benefited heavily from his play. He did get injured, but the latest reports say he's day-to-day and expected to be available for the next round. If he returns at the same level, the Hurricanes are going to be tough to beat. That said, when Pyotr Kochetkov is in net, the Hurricanes haven't looked quite as sharp. Andersen's presence clearly stabilizes the group in front of him, and that shows up in this chart. If he's healthy, they're in a great spot.
Skater Production: Goals per 60 vs Assists per 60
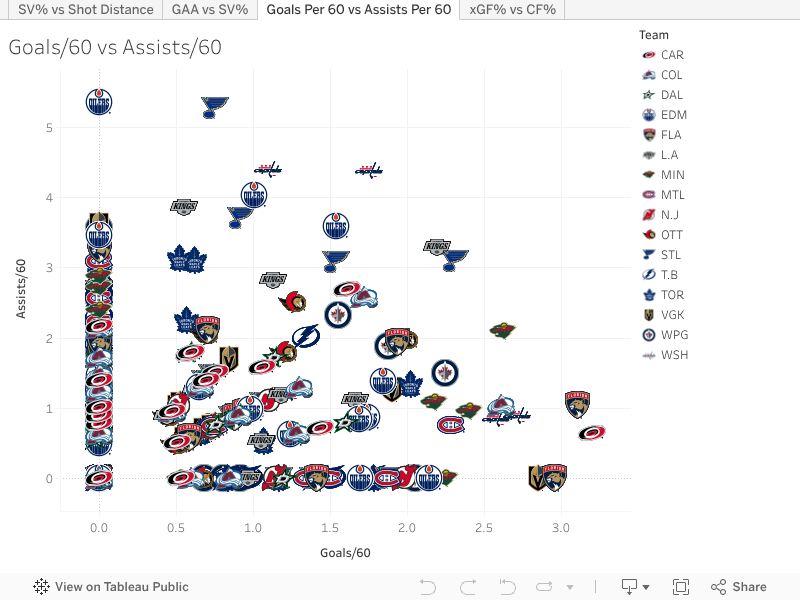
The third chart breaks down individual player production by comparing Goals per 60 (x-axis) and Assists per 60 (y-axis). Moving right means a player is scoring more goals, while moving up indicates more assists. Players in the top-right quadrant are producing well in both areas, which is where you want your top forwards to be during the playoffs.
Among the most productive players on this graph are Cam Fowler, Dylan Strome, Adrian Kempe, Pavel Buchnevich, Kirill Kaprizov, Matthew Tkachuk, and Andrei Svechnikov. These are the guys who are pushing their teams forward , contributing both as finishers and facilitators.
Players leaning further right but sitting lower on the Y-axis are mostly pure goal scorers. Players higher up but not as far right are leaning more toward playmaking. You want balance, but some teams have role specialists who still provide high value.
This chart is useful for identifying which skaters are leading the charge in raw point generation, rather than just territorial metrics. For teams trying to come back in a series, players in the lower left , low goals and low assists , are likely the ones who need to step up.
Skater Process: Expected Goals-For% vs Corsi-For%
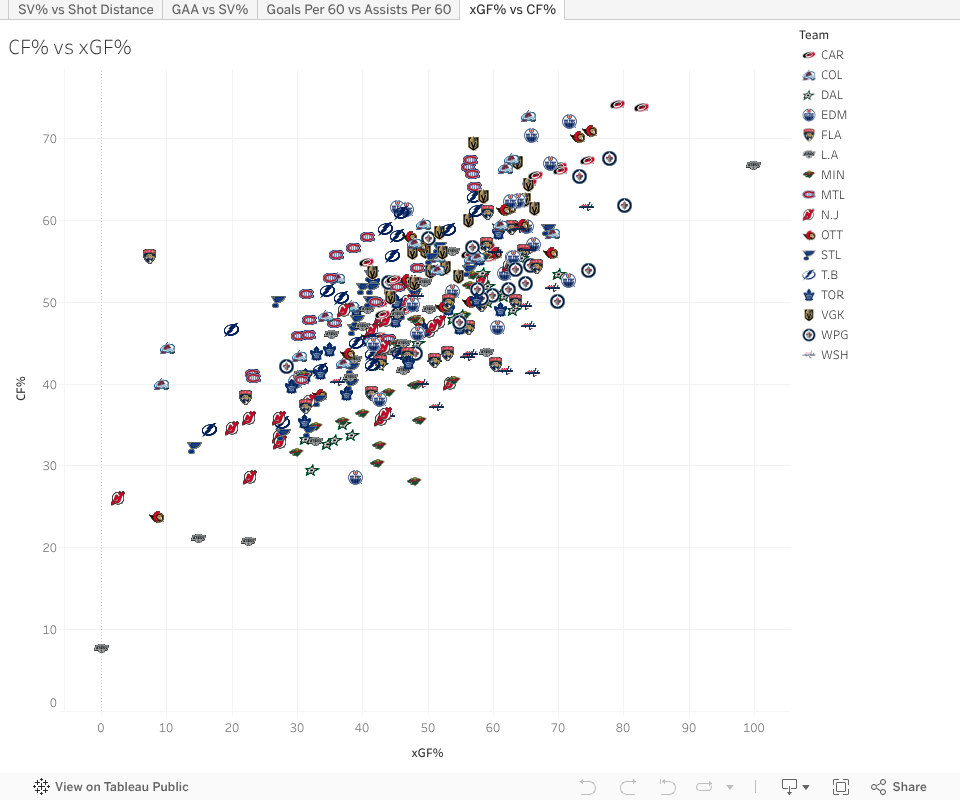
This last chart plots Expected Goals For Percentage (x-axis) against Corsi For Percentage (y-axis). xGF% tells us about shot quality , how dangerous a team's chances are. CF% tells us about shot volume, how much puck possession a team has relative to its opponent. In hockey terms, right means better chances, and up means more control of the game.
The top-right area is where you want to be: High quality, high volume. Carolina is right there. They've been excellent, both at generating dangerous opportunities and maintaining offensive pressure.
When filtering by team, the Hurricanes stand out across the board. Their top performers are Shayne Gostisbehere, Andrei Svechnikov, Jesperi Kotkaniemi, Mark Jankowski, and Sean Walker. Players like Sebastian Aho and Jackson Blake are also contributing solid numbers, keeping Carolina's overall performance steady.
Colorado is a bit lower on the chart, and that speaks more to their depth. Their top players – Gabriel Landeskog, Nathan MacKinnon, Martin Necas, and Artturi Lehkonen – are all showing well individually, but the team's overall position suggests some inconsistency across lines.
Dallas is even lower, which reflects a more conservative or grinding approach. That shows up in how their players cluster with lots of them in the same mid-zone. Jamie Benn, Matt Duchene, Lian Bichsel, and Roope Hintz are doing fine, but there's less separation from the rest of the lineup.
Looking at Edmonton, there is no surprise as Leon Draisaitl is way up there. He's been a standout, and even Corey Perry is second on the team in Corsi. Connor McDavid is right behind them. After that, it's more even. Evan Bouchard, Vasily Podkolzin are all mid-pack, and guys like Viktor Arvidsson are contributing but not breaking out. Still, the Oilers are dominating the Kings in terms of possession and quality , something that becomes even clearer if you highlight both teams on the chart.
Florida's top players – Carter Verhaeghe, Sam Reinhart, Matthew Tkachuk, and Aleksander Barkov – are all showing up well. Their balance is what stands out.
For Minnesota, Kirill Kaprizov, Joel Eriksson Ek, Matt Boldy, Zeev Buium and Mats Zuccarello are leading the charge. Brock Faber and Jonas Brodin are holding their own on the back end.
Among other teams, Cole Caufield is producing well for Montreal, along with Nick Suzuki, Juraj Slafkovsky, and Lane Hutson. It's a positive sign for their young core.
The Devils, now eliminated, had Timo Meier, Ondrej Palat, Luke Hughes, Johnathan Kovacevic, and Dennis Cholowski performing well individually, but it wasn't enough.
Ottawa's leading contributors include Tim Stutzle, Brady Tkachuk, Drake Batherson, Thomas Chabot, and Claude Giroux.
The Blues' top player based on this chart is Jimmy Snuggerud; a surprise but supported by the data. Zachary Bolduc, Cam Fowler, and Alex Texier are next in line.
Tampa's standout names include Jake Guentzel, Nikita Kucherov, Brayden Point, Brandon Hagel, Nick Perbix, Victor Hedman, and Nick Paul.
In Toronto, William Nylander, John Tavares, Auston Matthews, Matthew Knies, Nick Robertson, and Calle Jarnkrok are all up there. It's good to see their top players driving play, now the question is whether they can close out their series.
Vegas is well above the median line for both xGF% and CF%, so they've been dominant. Pavel Dorofeyev was their top skater before getting hurt, and guys like Tomas Hertl, Nicolas Roy, Brendan Saad, Shea Theodore, Kaedan Korczak, and Zach Whitecloud are all contributing at a strong clip. But Jack Eichel's name is notably absent from that top mix. He's buried lower on the graph, which reflects the eye test, he hasn't taken over the series yet, and Vegas will likely need him if they want to go deeper.
Wrapping It Up
These four visuals provide a snapshot of how teams and players are performing so far in the 2025 NHL Playoffs. Whether you're looking at goaltending structure, shot suppression, or offensive balance, interpreting these axes through a hockey lens gives the numbers real meaning.
Use these charts to isolate team strengths, assess individual workloads, and compare playoff performers in context , not just by the box score. Each Tableau chart in this article is interactive. You can hover, filter by team, or click to highlight individual players. Use the controls to isolate matchups and compare trends.
Thanks for reading. As always, you can reach out to me @DH_staspup with questions or feedback. See you next week.
Related Posts

UPCOMING GAMES
| Oct 07 - 17:10 |
| vs |
| |
| Oct 07 - 20:10 |
| vs |
| |
| Oct 07 - 22:10 |
| vs |
| |
Starting Goalies
Top Skater Views
| Players | Team | |
|---|---|---|
| JACKSON BLAKE |
| |
| LOGAN COOLEY |
| |
| KAAPO KAKKO |
| |
| DILLON DUBE |
| |
| CAL FOOTE |
| |
Top Goalie Profile Views
LINE COMBOS
| Frequency |
| |
|---|---|---|
| 19.6 | BRENDAN GALLAGHER CHRISTIAN DVORAK JOSH ANDERSON | |
| 13.8 | NICK SUZUKI JURAJ SLAFKOVSKY COLE CAUFIELD | |
| 12.4 | ALEX NEWHOOK JAKE EVANS IVAN DEMIDOV | |
DobberHockey Podcasts

Keeping Karlsson: Because It’s the KKUPFL, Season 11
Elan and Brian reveal a key change for Season 11 of the Keeping Karlsson Ultimate Patron Fantasy League (KKUPFL), the world’s top fantasy hockey league. They also share and consider feedback from Season 10 managers, responding with tips and thoughts on fantasy hockey league building and philosophy.

Fantasy Hockey Life: Los Angeles Kings with Dennis Bernstein
Dennis Bernstein of The Fourth Period is here to report on the LA Kings.
Keeping Karlsson: Red Boys of 2024-25
Elan and Brian dig into the NHL players who started strong but sputtered badly in the second half of 2024-25, and how much this impacts their desirability for 2025-26 NHL fantasy hockey drafts.
Fantasy Hockey Life: Ottawa Senators with Alex Adams
Alex Adams of Sportsnet is here to report on the Ottawa Senators. Jesse and Victor interview Alex about returning pros Tim Stutzle, Drake Batherson, Brady Tkachuk, Dylan Cozens, Claude Giroux, Shane Pinto, Ridly Greig, Fabian Zetterlund, Jake Sanderson, Thomas Chabot, Jordan Spence, Linus Ullmark, and Leevi Meralainen. In Cat’s Instincts, Cat Silverman of InGoal mag […]
Fantasy Hockey Life: Washington Capitals Preview with Dan Holmi of Locked on Caps
Dan Holmi is here to report on the Washington Capitals. Jesse and Victor interview Dan about returning pros Alex Ovechkin, Dylan Strome, Aliaksei Protas, Pierre-Luc Dubois, Tom Wilson, Connor McMichael, Ryan Leonard, John Carlson, Jakob Chychrun, Rasmus Sandin, Logan Thompson, and Charlie Lindgren. In Cat’s Instincts, Cat Silverman of InGoal mag breaks down Garin Bjorklund. […]