With the second round of the playoffs underway, this week's edition of Analytics Advantage takes a look at how teams and players are trending based on their underlying numbers. The box score doesn't always tell the full story, and these updated Tableau visuals offer more context behind who's driving results and who might be falling behind.
Each chart includes player and team filters to help isolate matchups, highlight contributors, and explore playoff workloads in more detail. From goaltending under pressure to puck control and finishing trends, this week's visuals cover the key areas shaping the second round.
Expected Goals Against (xGA) vs Save Percentage

This chart plots expected goals against on the X-axis and save percentage on the Y-axis. Goalies in the top right are facing tough chances and still thriving. That is clutch goaltending and exactly what you want in the playoffs. Top left means you're facing a lot but struggling. Bottom right means you're seeing a lighter workload but staying efficient. Bottom left is the red zone , not facing much and still underperforming.
Looking at the top right, the three best-performing goalies are Frederik Andersen, Jake Oettinger, and Logan Thompson. Andersen and Oettinger have been excellent. Thompson is getting peppered and has been the only thing keeping the Caps in the series , it could easily be a sweep without him.
In the bottom right, Joseph Woll is having a strong series with a lighter load. On the other side, a handful of goalies are having a rough time. Connor Hellebuyck, Sergei Bobrovsky, and Adin Hill all show up in tough spots. Calvin Pickard hasn't looked great either with the minutes he's seen.
Average Shot & Goal Distance vs xGA
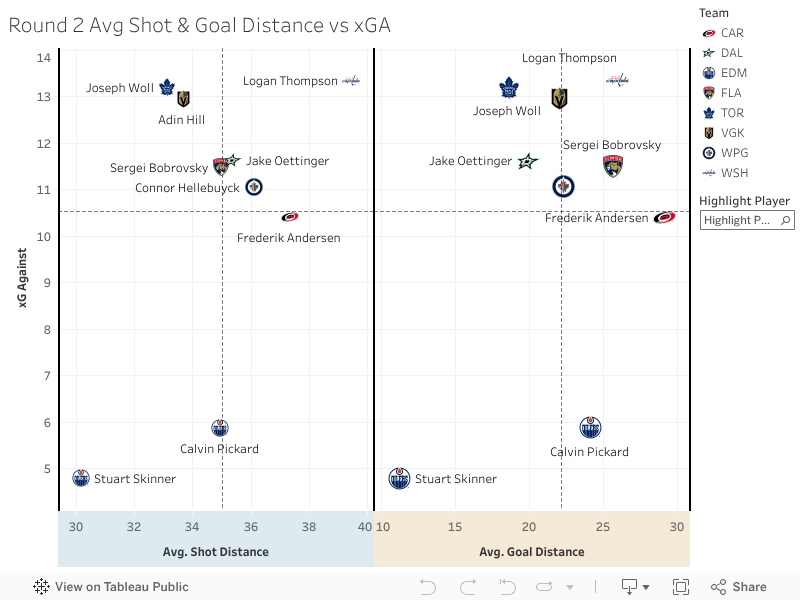
This chart shows how far shots and goals are coming from on the X-axis and compares that with expected goals against on the Y-axis. Players further to the left are facing closer chances, and players to the right are keeping shots and goals to the outside. Higher on the chart means more expected goals against aka more dangerous workload.
If you're up top on the right, it means you're allowing a lot of goals despite keeping things to the outside , usually a system or volume issue. Top left means you're giving up a lot of dangerous chances from in close. Bottom right is where you want to be , keeping chances to the outside and limiting damage. Bottom left is more of a risky zone, but it might be working for now.
Looking at the data, Calvin Pickard and Stuart Skinner show up at the bottom with the lowest xGA, but that's only because they've split time. If you combine their numbers, they're around average.
One of the biggest standouts is Logan Thompson. He's getting peppered from all over the ice. Carolina's system just throws pucks on net constantly , that's how they play. Joseph Woll is also seeing a lot of close-in chances, and Adin Hill shows up in a similar spot.
There's a tight cluster in the middle with Bobrovsky, Oettinger, Hellebuyck, and Andersen. These are goalies playing well or working within defensive systems that are holding things to around average.
Looking at the right side, where we can break down goal distance specifically, Andersen shows a high number of goals allowed from distance. Joseph Woll and Stuart Skinner are letting in more from in close. Jake Oettinger is in a similar spot , letting in more from short range.
PDO vs Shot Attempt Share (CF%)
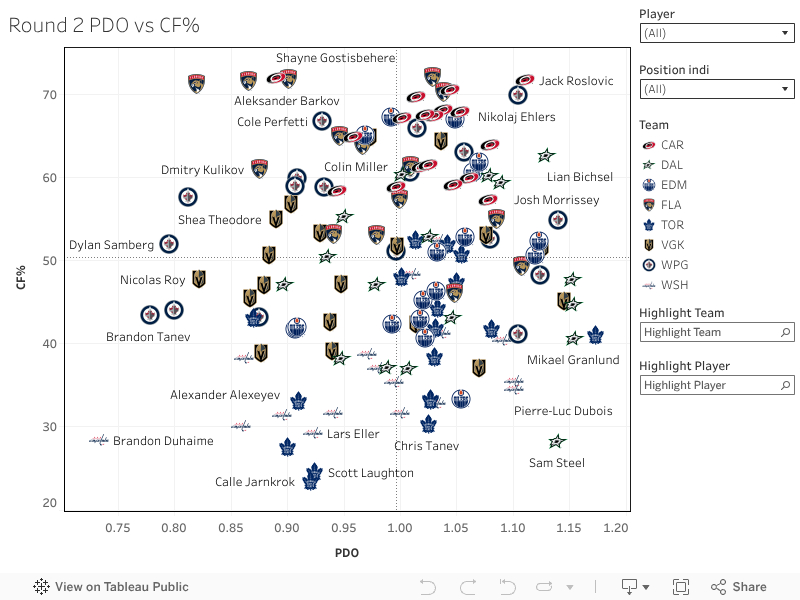
This chart maps PDO on the X-axis and Corsi For % (CF%) on the Y-axis. Players in the top right are in total control — they're driving play and getting the bounces. Top left means they're generating chances but not getting rewarded yet. Bottom right players are benefiting from puck luck despite not controlling play, which usually means regression is coming. Bottom left is the worst case , not driving play and not getting any help.
Brandon Duhaime stands out for all the wrong reasons. He's sitting firmly in that bottom left quadrant, having a rough series with low impact and no luck. That seems to be a theme for the Capitals. Aside from Alex Ovechkin, who's the only Capital above average in Corsi, the rest of the team is below the line. That's not what you want to see at this point in the playoffs.
On the flip side, the Jets look strong, but the results haven't been showing it. Multiple players are driving play, and Nikolaj Ehlers is leading the charge. Their weakest link so far has been Brandon Tanev. Vegas has a couple of high points in Tomas Hertl and Victor Olofsson, both sitting in the top right. Jack Eichel is right in the middle , just average across the board.
Toronto, similar to Washington, isn't showing up where you'd hope. Only three players are above the average Corsi line: John Tavares, William Nylander, and Auston Matthews. And even with Matthews being in the right spot on this graph, he's got zero goals in the series. The Leafs need more out of him and everyone else if they want to stay in the playoffs.
Florida is trending in the right direction. They're producing, and even the players who aren't getting lucky are still driving play. If that continues, you'd expect the results to improve even more. Edmonton's getting the benefit of puck luck , they've been above average in both metrics and just closed out their series 4–1 against Vegas in overtime.
Dallas is looking like a deep, well-rounded team. Most of their roster sits in the top right, and they're doing exactly what a contending team should be doing. Carolina is even more impressive. Nearly their entire team is above average in Corsi, and they're getting bounces too. There's not a single player below the line. This team is a wagon.
xGA vs Goals Against (GA)
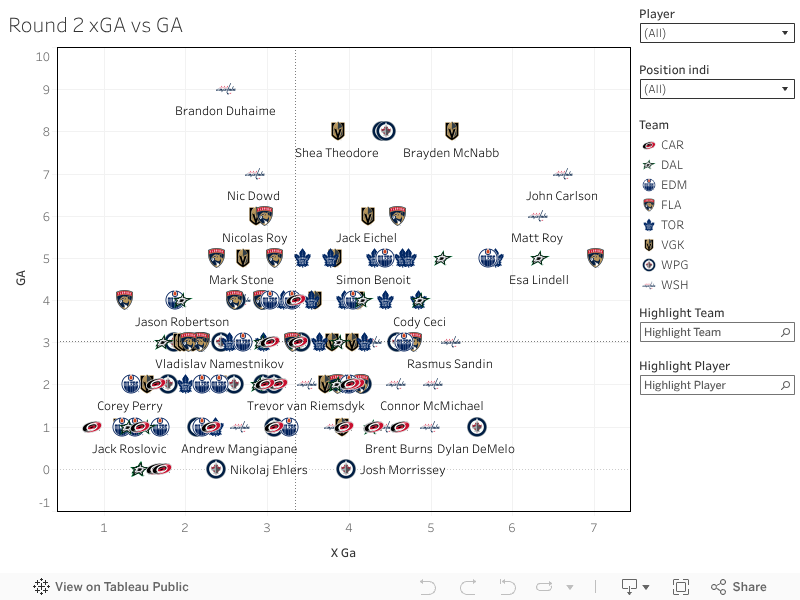
This chart plots expected goals against on the X-axis and actual goals against on the Y-axis. Top right is the danger zone, you're allowing high-danger chances, and the results reflect it. That means you're getting exposed. Top left is where things are breaking down , not giving up much, but still getting scored on, which usually points to bad luck or poor goaltending. Bottom right is a little more forgiving, you're allowing a lot, but the goals aren't going in. That can mean your goalie is bailing you out. And bottom left is the best-case scenario: lockdown defense, limiting both chances and goals.
Brandon Duhaime shows up again, and not in a good way. He's in the top left, which means he's not allowing much but is still getting scored on. That lines up with what we saw in the PDO chart, he's getting incredibly unlucky and not getting the support you'd hope for.
In the top right, you'll see players who are struggling defensively, the ones who are just letting in too much. This is not where you want to be.
On the other end, players in the bottom left are handling business. That's where you find the solid defensive efforts, keeping chances low and goals even lower.
You'll see some of the same team trends here as in the other charts. It is worth scrolling through the graph and hovering over different teams. You don't even need to filter, just roll over a team name to see how their skaters are doing defensively. It's a quick way to spot breakdowns or highlight who's holding it down in their own zone.
Expected Goals For (xGF) vs Goals For (GF)
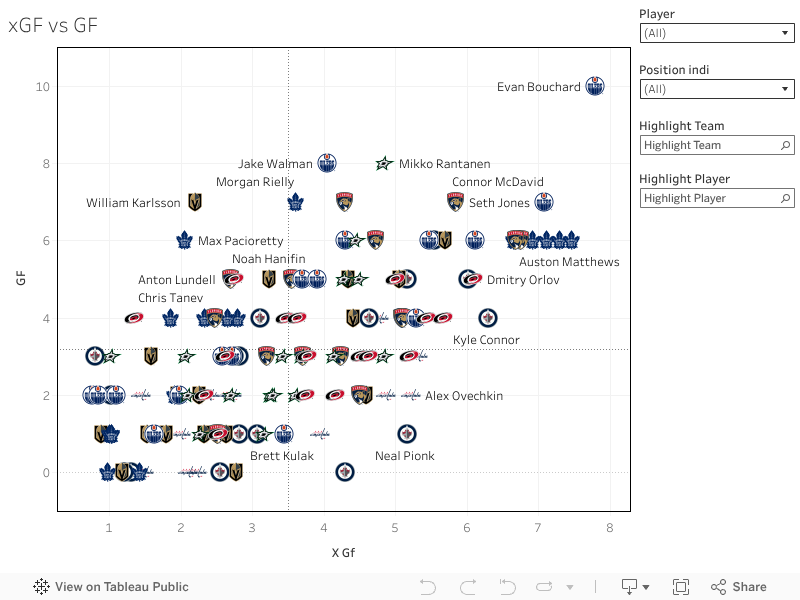
This chart shows expected goals for on the X-axis and actual goals for on the Y-axis. Top right is the sweet spot , players generating quality chances and converting them. Top left means you're creating looks but not finishing, which could be due to bad luck or poor shooting. Bottom right is where the hot hands live , not generating much, but still scoring. And bottom left is flat all around , low creation and low output.
Evan Bouchard is having himself a playoff. He shows up well here and continues to look like a major piece for Edmonton. Connor McDavid's right there too, along with Seth Jones, Mikko Rantanen, Jake Walman, and Carter Verhaeghe , all guys producing at a high level.
Auston Matthews is an interesting case. He is in the right spot statistically, having been on the ice for a lot of goals. But he still hasn't scored one himself in this series. That stands out.
Looking at the Leafs as a whole, they're split. Only about five players are above average on this graph, and the rest fall short. It shows the imbalance in their forward group right now , some guys are doing their part, others aren't generating much.
You'll notice Vegas is also struggling offensively. They've got a lot of players hanging around the lower half of the graph. That might explain some of their inconsistency scoring so far in the playoffs.
Use the filters and inputs to compare matchups, highlight teams, or zero in on individual players. There's a lot you can take away from just seeing who's above the line and who's getting stuck in the wrong quadrant.
Thanks for checking it out. If you've got questions or want to dig into something specific, you can always find me @DH_staspup. See you next week.
Related Posts


UPCOMING GAMES
| Oct 07 - 17:10 |
| vs |
| |
| Oct 07 - 20:10 |
| vs |
| |
| Oct 07 - 22:10 |
| vs |
| |
Starting Goalies
Top Skater Views
Top Goalie Profile Views
LINE COMBOS
| Frequency |
| |
|---|---|---|
| 21.9 | AUSTIN WATSON CRAIG SMITH TYLER MOTTE | |
| 21.3 | MARCO KASPER PATRICK KANE ALEX DEBRINCAT | |
| 17.2 | VLADIMIR TARASENKO MICHAEL RASMUSSEN J.T. COMPHER | |
DobberHockey Podcasts

Fantasy Hockey Life: Columbus Blue Jackets with Brian Hedger
Brian Hedger of the Columbus Post Dispatch joins to talk Columbus Blue Jackets. Jesse and Victor interview Brian about returning pros Sean Monahan, Kirill Marchenko, Kent Johnson, Boone Jenner, Adam Fantilli, Dmitri Voronkov, Yegor Chinakhov, Cole Sillinger, Luca Del Bel Belluz, Zach Werenski, Denton Mateychuk, Elvis Merzlikins, and Jet Greaves. In Cat’s Instincts, Cat Silverman […]
Keeping Karlsson: Because It’s the KKUPFL, Season 11
Elan and Brian reveal a key change for Season 11 of the Keeping Karlsson Ultimate Patron Fantasy League (KKUPFL), the world’s top fantasy hockey league. They also share and consider feedback from Season 10 managers, responding with tips and thoughts on fantasy hockey league building and philosophy.

Fantasy Hockey Life: Los Angeles Kings with Dennis Bernstein
Dennis Bernstein of The Fourth Period is here to report on the LA Kings.
Keeping Karlsson: Red Boys of 2024-25
Elan and Brian dig into the NHL players who started strong but sputtered badly in the second half of 2024-25, and how much this impacts their desirability for 2025-26 NHL fantasy hockey drafts.
Fantasy Hockey Life: Ottawa Senators with Alex Adams
Alex Adams of Sportsnet is here to report on the Ottawa Senators. Jesse and Victor interview Alex about returning pros Tim Stutzle, Drake Batherson, Brady Tkachuk, Dylan Cozens, Claude Giroux, Shane Pinto, Ridly Greig, Fabian Zetterlund, Jake Sanderson, Thomas Chabot, Jordan Spence, Linus Ullmark, and Leevi Meralainen. In Cat’s Instincts, Cat Silverman of InGoal mag […]