NHL Draft Visualized: Tableau Deep Dive into Point Shares and Development Trends
This week, I've built on last week's draft value work by digging into player outcomes with a fresh set of Tableau visuals. The core metric driving this analysis is Point Shares, a stat from Hockey Reference that functions similarly to WAR (Wins Above Replacement). It assigns a single number to estimate a player's overall contribution to team success, making it perfect for comparing across eras, draft slots, and positions.
To define success, I used Byron Bader's criteria from HockeyProspecting.com, which classifies players as Stars, NHLers, or Busts based on thresholds of games played and production. It's a simple, intuitive framework that reflects real-world value while allowing us to cut through the noise.
The visuals below cover a lot of ground, from the biggest steals in draft history to team-level trends by era. We'll look at:
- Point Share by Era
- Point Share vs. Games Played
- Team Draft Performance by Era
- Total League Point Shares by Draft Year
- Star/NHLer/Bust Outcomes Over Time
- Top Point Share Players by Era
Each graph is fully interactive and built for exploring. Hover to see player names, filter by team or era, and find your favorite draft-day gems or flops. There’s a lot here, so this isn't a linear article but a jumping-off point. Use it to dig into the data and see what trends stand out to you.
Point Share by Era
The first visualization is a scatter plot of Point Shares vs. Overall Draft Pick, broken down by era. On the X-axis, we've got overall pick number; on the Y-axis, total career Point Shares.
This is where the true steals of the draft shine. Players like Henrik Lundqvist, Joe Pavelski, and Pekka Rinne are clear standouts, drafted deep but producing elite-level careers. These outliers float well above the cluster of mid- to late-round players, showing just how rare these home runs really are.
You can also use the highlight tool to explore how specific teams have fared. For example, the Tampa Bay Lightning pop off the chart with their core stars, like Steven Stamkos, Nikita Kucherov, Victor Hedman, and Andrei Vasilevskiy stacked in the upper-left quadrant. That kind of cluster isn’t luck; it's strong scouting and smart drafting.
Use this chart to explore your favorite team's hits and misses over time, or just browse the eras to see how different decades stack up. Whether you’re hunting for Hall of Famers or cult heroes, this viz has plenty to explore.
Point Share vs. Games Played by Era

This second visualization expands on the first by shifting the X-axis to Games Played instead of draft slot. It lets us explore how career longevity relates to overall value, using Point Shares as the Y-axis once again.
Right away, you'll notice a familiar curve: most players cluster toward the bottom-left, short careers with limited impact. But what really stands out are two things:
First, the upper-left section is dominated by goalies and elite skaters are in the upper right who played long careers and contributed huge value.
Second, look at the players high on the X-axis but low on the Y-axis. These are your 1,000-game guys who may not have produced tons of Point Shares but still carved out legitimate NHL careers. They stuck around, filled roles, and made their teams better in ways that don't always show up in a stat like Point Shares.
That's the reason this graph matters. Point Shares are powerful, but they don't capture everything. Some players stick because of their grit, reliability, or defensive prowess, things harder to quantify. This chart gives those players their space in the conversation.
Point Share by Era and Team

This next visualization breaks things down by team and era, showing how well each franchise has drafted over time in terms of total Point Shares generated by their picks.
This one is a little more straightforward. It doesn't give us as much player-level detail, but it's useful for spotting which teams had strong draft stretches in specific eras. For example, you can clearly see that the Pittsburgh Penguins dominated the 2000–2005 window , thanks to picks like Sidney Crosby, Evgeni Malkin, and Marc-Andre Fleury, all of whom racked up major value.
One important note: this chart assigns a player's career value to the team that drafted them. So even if they were traded early, everything they did still counts for the drafting team. It's a way to isolate drafting success, not development or roster management.
Filter by era and team, and you'll see other spikes, like Washington in the late 2000s, or Edmonton's recent surge, carried heavily by Connor McDavid. It's a solid way to measure who really found value at the draft table, and who didn't.
NHL Point Shares Over Time
This chart shows us how much total NHL value each draft class has produced, essentially how strong a given draft year turned out to be, based on Point Shares.
Right away, you can spot the 2003 draft, often considered one of the deepest in NHL history and standing tall above the rest. The data backs that up completely here. That class was loaded, and you see the full impact in this visual.
From there, things become more varied. Some draft years end up producing a ton of NHL players; others, not so much. You'll notice a consistent range most drafts fall into, with many clustering around that 2012-2015 average mark.
Something else to keep in mind: some drafts are heavy on skaters, while others leaned more toward goalies, which can affect total point share outcomes. This chart doesn't try to control for position, it just shows the end result: how much value each draft class has contributed to the league.
Have a look through and see which years stand out to you, both the powerhouses and the ones that might've underwhelmed.
How the League Has Looked Over Time (Star/NHLer/Bust Ratios)
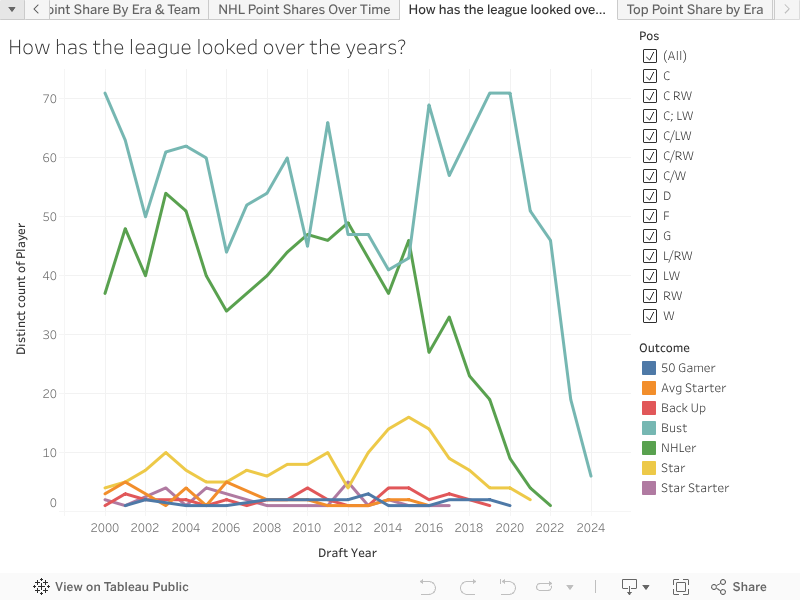
This next visual breaks down how each draft class has fared in terms of producing Stars, NHLers, and Busts , with a "bust" being a player who played fewer than 50 NHL games.
Right off the bat, you can see the harsh reality of the draft: most players don’t stick in the league. The majority of each draft class ends up in the bust category. That's just how hard it is to make it to the NHL, let alone become a regular contributor or a star.
That said, there's a noticeable sweet spot: between 2012 and 2016, there was a spike in both NHLers and Stars. Fewer busts, more impact players, that era stands out as a stronger run of drafting overall. If you're trying to identify the best recent draft periods, those years should be near the top of your list.
So, while the draft is always a gamble, some years clearly hit better than others, and this chart makes it obvious which ones delivered.
Top Point Share by Era

Wrapping things up, this last visualization highlights the top point share contributors by era. As expected, there’s a clear downward trend in total point shares as we move toward more recent draft years, simply because newer players haven't had as much time to accumulate value.
I've included a sliding filter so you can adjust the point share threshold, as well as color-coded team indicators to help you quickly identify where players came from. It's a useful way to break things down visually, when you look closely, each era really only has a handful of dominant names carrying the load.
Some of those eras are still taking shape. But one name that already stands out in the modern era is Auston Matthews. Based on point shares, he's currently the top modern player, showing just how impactful he's been already in his career.
Use this viz to explore your favorite teams, identify hidden gems, or just get a sense of how elite talent emerges over time. Hover over each bar to see the exact players driving each team's success.
Final Thoughts
This deep dive into draft outcomes through the lens of Point Shares and Byron Bader's star/NHLer/bust framework offers a fresh way to evaluate drafting success over time. Whether you’re looking at franchise-level trends, the biggest steals in history, or simply who turned into what, they all tell part of the bigger story.
There's no single way to win the draft, but the data makes it clear that some teams and some years have been better than others at turning picks into value. The mix of scouting, development, and luck shows up in every chart.
I encourage you to dig into the Tableau dashboard, filter by your favorite teams, and zoom in on different eras. There's a lot to explore, and even more questions to ask.
Thanks for reading. Let me know what stands out to you or if there are other angles you’d want to see next. The draft is just the start, what happens after is where the story really begins.
Related Posts
UPCOMING GAMES
Starting Goalies
Top Skater Views
Top Goalie Profile Views
| Players | Team | |
|---|---|---|
| JAKUB DOBES |
| |
| ILYA SOROKIN |
| |
| ILYA SAMSONOV |
| |
| CARL LINDBOM |
| |
| JOHN GIBSON |
| |
LINE COMBOS
| Frequency |
| |
|---|---|---|
| 19.6 | BRENDAN GALLAGHER CHRISTIAN DVORAK JOSH ANDERSON | |
| 13.8 | NICK SUZUKI JURAJ SLAFKOVSKY COLE CAUFIELD | |
| 12.4 | ALEX NEWHOOK JAKE EVANS IVAN DEMIDOV | |
DobberHockey Podcasts

Fantasy Hockey Life: Draftastic 2 – Q&A on the NHL Draft
Victor and Jesse are back in studio as Victor reports on his time at the NHL Draft and his outlook on fantasy rookie drafts. We discuss Michael Misa, Matthew Schaefer, Cole McKinney, Mason West, Milton Gastrin and Jacob Ihs-Wozniak with player audio. Victor also answers patron questions on which players you’ll want to target for […]
Fantasy Hockey Life: Draftastic 1 – NHL Draft Talk with Prospect Writers
Victor reports from the NHL Draft in Los Angeles.

Keeping Karlsson: Dobson is Free
On this edition of the Keeping Karlsson Fantasy Hockey Podcast, Elan and Brian ride the highway of National Hockey League offseason news, draft notes and transactions before the Free Agent Frenzy begins. All night long.
Fantasy Hockey Life: Calgary Flames with Steve MacFarlane
Steve MacFarlane is here to report on the Calgary Flames. Jesse and Victor interview Steve about returning pros Nazem Kadri, Jonathan Huberdeau, Matt Coronato, Connor Zary, Yegor Sharangovich, Morgan Frost, Martin Pospisil, Joel Farabee, MacKenzie Weegar, Rasmus Andersson, Zayne Parekh, Dustin Wolf, Dan Vladar, and Devin Cooley. In Cat’s Instincts, Cat Silverman of InGoal mag […]
Fantasy Hockey Life: Sheng Peng on the San Jose Sharks
Sheng Peng is here to report on the San Jose Sharks.