

Ramblings: Dostál Extended; Yegor Chinakhov News; Changes in Ice Time at Even Strength and the Power Play – July 18
Michael Clifford
2025-07-18
The 2025-26 Dobber Hockey Fantasy Guide is close to being finished and will be released before the end of the month. Dobber is hard at work on projections while the writing team is putting together a host of articles from category-specific players, to risers and fallers from last year, delving into each team's roster changes, and a whole lot more. It is part of the Dobber Hockey Keeper Pack which includes both the Guide itself and the Prospects Report, which is already available for download. Help support what we do and get yourself a great head start on your league mates by heading to the Dobber Shop and ordering a Keeper Pack!
*
The Anaheim Ducks have signed goalie Lukas Dostal to a five-year extension carrying an AAV of $6.5M. That will carry though to the end of the 2029-30 season, and Dostál's age-29 season. He has a career .902 save percentage across 107 starts and 121 appearances, which is a miracle considering how bad the Ducks have been over the last four years. He looks like one of the next great goalies in the league, but he won't elevate in the fantasy game until the team in front of him drastically improves. They are on their way up, but there's a large gap between where he and the Ducks are now, and where goalies like Connor Hellebuyck and Andrei Vasilevskiy are with their respective squads.
*
It looks as though Columbus forward Yegor Chinakhov has requested a trade:
He had a great start last season with 7 goals and 7 assists in 21 games before an upper-body injury caused him to miss over three months. He returned to the lineup in early March but went from 17+ minutes a game before he got hurt to under 14 minutes a game after his return. He also saw a lot of healthy scratches over the last few weeks of the season with Columbus chasing a playoff spot. A bunch of different injuries have limited him to just 113 games over the last three years and it's tough to gain footing averaging 38 games played per season. He has offensive talent to produce well, but it seems as if it won't be in Columbus.
*
In my two Ramblings earlier this week, we started an offseason series about how to project the following season. On Tuesday, we looked at first steps to take when creating projections, and yesterday extended on that by looking at how projecting defencemen differs from projecting forwards. Today, we're going to build off what we did yesterday by looking at the league environment. Player data is from Evolving Hockey with some power play data from Hockey Reference.
In these Ramblings couple months ago, the changing league environment was discussed in terms of shots, hits, and blocks. Go read that for a head start on how those stats have been shifting over the last few years (and last decade).
There are several ways to start looking for changes in the scoring environment. One thing that affects production more than just about any other aspect of a player's total output is what they can do on the power play. Consider that in the three years from 2021-2024, the top-99 point producers got an average of 31.7% of their overall point total from the power play (mean) and none of those 99 top producers got less than 14% of their production on the man advantage (min):
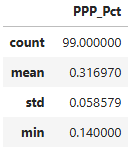
That is a huge, huge chunk of production. If someone posts an 80-point season, and nothing changes the next year except a drop from the average of 31.7% to the minimum of 14%, that is a total production decline of 14-15 points. Getting that valuable power play time is key to being a high producer.
That is why it's crucial to highlight what a shift this recent season was in terms of power play opportunities. For basically a decade, the NHL had operated in an environment where teams averaged somewhere between 2.9 and 3.1 power play opportunities per game (there were a couple years of 2.89 and one of 3.11, but nonetheless). That gave us a very stable framework when projecting power-play production the following season.
That all changed in 2024-25. The following graph shows how much power-play opportunities changed in a given season since 2013-14 when compared to the year before. The 2024-25 campaign was like nothing else in recent NHL history:
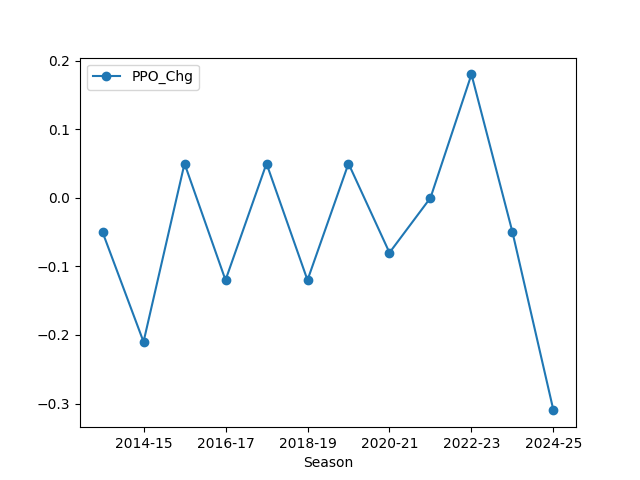
Where we had generally seen changes between +/- 0.2 PP opportunities per team per game year after year, this past season saw a decline of -0.31 power play opportunities per team per game. With 32 teams playing 82 games each, there are 2624 team games in a season. A drop like this is around 800 fewer power-play opportunities in one season. At an average power-play conversion rate of around 21.6%, we're looking at 176 fewer PP goals when compared to 2023-24. That is a lot of PP goals missing.
The question is whether we stay at this level in 2025-26, decline further, or power play opportunities climb. Given that the chart mostly shows declines followed by increases, my best guess is that we add some PP opportunities to what happened in 2024-25, but even if that's the case, how much that actually rises is another question entirely.
Something else that has a huge effect on production is ice time. Being able to produce a lot of points requires a lot of minutes, and players skating 16-17 minutes have a cap on their upside by lack of volume. To look at any potential changes in ice time, we are going to use data from Frozen Tools.
We have seen a big decline in power-play opportunities in 2024-25, but the twist here is that top PP guys were used more compared to recent NHL seasons. In the table below, the red box shows the average PP percentage, or share of the team's PP time, of the top-100 skaters by PP usage in each season, and the black box shows the lowest percentage of PP time among those 100 skaters:
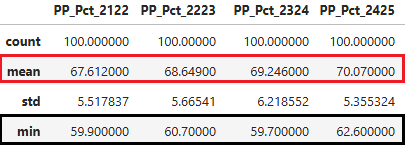
Steadily, the very top power-play options across the league are being used more and more, climbing from an average of 67.6% of the power-play time in 2021-22 to 70.1% this past campaign. If a player skates in all 82 games and his team gets five minutes per game in PPTOI, it means an additional 9-10 minutes a season of PPTOI just through that increased league-wide usage alone. Apply that to 100 skaters and getting 900-1000 extra minutes of PPTOI from the top options is a big help in mitigating that overall PP opportunity drop we saw in the league.
This change isn't limited to just the power play, either. For example, let's look at defencemen from each of the last four seasons. We are going to do the same thing we did with the power play and look at the top-100 most-used defencemen at even strength from those four years and how that compares year-over-year. This is a case where I expected to find one thing but found another:
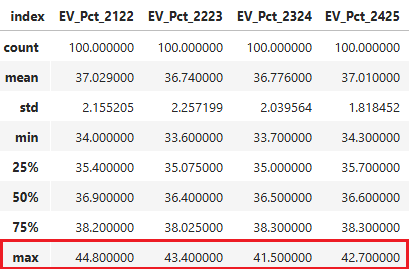
What I expected to find was that the average usage of top defencemen had declined over the last few years. That isn't the case as the "mean" row shows little change. In fact, the average percentage of EVTOI from the top-100 defencemen in 2024-25 was a shade over 37%, the same as it was in 2021-22. So, small variations year-to-year, but not a whole lot has changed on average.
But we can look at more than the average. See the red box in that table? That shows the maximum EVTOI percentage from a given defenceman in a given season. That has declined a lot in recent years, from between 43%-45% in 2021-22 and 2022-23 compared to between 41%-43% in each of the last two seasons. That change, at the very top, means about 40 fewer minutes per season for that player. And it goes beyond just the very top as the 2022-23 season saw 10 different defencemen skate at least 40.5% of their team's even-strength ice time. The 2024-25 season saw just six defencemen reach that mark.
All that means that, on average, a team's top three defencemen are averaging roughly the same ice time per game at even strength that they have for the last few years. But the absolute apex of defencemen – the top 10-or-so options – are getting less.
Is it really a surprise, though? Remember that top skaters have been getting a bigger and bigger share of their team's power-play time over the last four years. Those top skaters will naturally include top defencemen as there is a lot of overlap between a team's top even-strength defenceman and their PP quarterback. So, they're losing some even-strength ice time but gaining that back in PPTOI.
There is a lot more we can go through here. Obviously, we have to do this for forwards, probably split between centres and wingers, look at short-handed time, and on and on. But this should highlight that the NHL environment changed in a big way in 2024-25 and what was true even 2-3 years ago is no longer the case. Whether it is changes in shot volume, blocks and hits, who is getting power-play time, or how much ice time the top players are earning, the NHL is in a state of flux. That can be frustrating when thinking about projecting a year ahead, but it also makes fantasy hockey such a fun game to research year after year.
Related Posts



Starting Goalies



Top Skater Views
| Players | Team | |
|---|---|---|
| ROOPE HINTZ |
 DAL DAL | |
| ALEX LAFERRIERE |
 L.A L.A | |
| LUKE HUGHES |
 N.J N.J | |
| OWEN TIPPETT |
 PHI PHI | |
| KEVIN FIALA |
L.A
| |
Top Goalie Profile Views
 WSH
WSH CBJ
CBJ MIN
MIN UTA
UTA


LINE COMBOS
| Frequency |
 CHI Players CHI Players
| |
|---|---|---|
| 21.9 | RYAN GREENE RYAN DONATO ANDRE BURAKOVSKY | |
| 20.7 | FRANK NAZAR NICK LARDIS CONNOR BEDARD | |
| 19.5 | ILYA MIKHEYEV ANTON FRONDELL TYLER BERTUZZI | |
DobberHockey Podcasts

Keeping Karlsson: The 2026-27 Keeping Karlsson Breakfast Club
Don’t you forget about them! Elan and Brian remind you of at least one player on each NHL team whose name you might forget to consider at the draft table.

Fantasy Hockey Life: Tampa Bay Lightning with Erik Erlendsson
Erik Erlendsson joins the program to discuss the Tampa Bay Lightning. Jesse and Victor ask about pros Nikita Kucherov, Jake Guentzel, Brandon Hagel, Brayden Point, Anthony Cirelli, Ilya Mikheyev, Gage Goncalves, Conor Geekie, Benjamin Rautiainen, John Carlson, Victor Hedman, Charle-Edouard D’Astous, Andrei Vasilevskiy, Jonas Johansson, and Dennis Hildeby. In Cat’s instincts, Cat Silverman of InGoal […]
Fantasy Hockey Life: New York Rangers with Colin Stephenson
Colin Stephenson joins the program to discuss the New York Rangers.
Keeping Karlsson: Matchup Maximizer Schedule Deep Dive
Elan is joined by the Keeping Karlsson Accountability Czar Trev to take a deep dive into the NHL schedule for next season and how it should affect our drafting decisions.
Fantasy Hockey Life: Carolina Hurricanes with Ryan Henkel
Ryan Henkel joins the program to discuss the Carolina Hurricanes. Jesse and Victor ask about pros Sebastian Aho, Seth Jarvis, Andrei Svechnikov, Nikolaj Ehlers, Jackson Blake, Logan Stankoven, Jordan Staal, Bradly Nadeau, Felix Unger Sorum, Shayne Gostisbehere, K’Andre Miller, Alexander Nikishin, Sean Walker, Brandon Bussi, and Pyotr Kochetkov. In Cat’s instincts, Cat Silverman of InGoal […]