

Frozen Tools Forensics: (In)Consistent Scoring for Kucherov, Seguin, Jack Hughes, and More
Chris Kane
2025-08-01
This week we are turning our collective attention to a Dobber Report that focuses a bit more on descriptive information than the data that informs our typical analysis. Usually, we are looking at data points that can help us determine if a performance we are seeing from a player is sustainable or if we should be expecting something different from them in the future. Today we are solely going to focus on the descriptive stat of consistency. I call it solely description because it really can shed some light on what it feels like to roster a specific player, but since I haven't found it to be particularly repeatable it doesn't do much to tell us what is going to happen in the future. So, welcome to Frozen Tool Forensics: The Cathartic Edition.
First up, let's take a look at the players who have were the most consistent during the 2024-25 season. The following table contains some basic player information about a player's season to date (name, games played, points, and points per game) and then gives us a stat labeled consistency percentage. This number is simply what percentage of games does said player actually get a point. The report I pulled this from contains a lot more data, things like multi-point consistency, goal consistency, assist consistency, etc. but for the purposes of today we are going to focus just on point production.
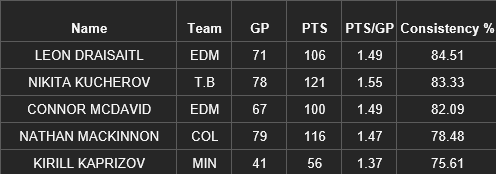
So, big shocker right off the bat here that all of the most consistent players have very high point-per-game number. This makes sense. Nikita Kucherov, who has a ton of points, is likely getting them across a lot of games and therefore has a high percentage of games with a point. Conversely, a player who only has a few points clearly has a lot of games without a point. What makes this more interesting is when we attempt to account for point paces. Essentially, we can use the data we have to establish a trend line and an expected consistency rate for each point pace. For example, given the data this year we would expect someone with a 50-point pace (.61 points per game) to point in about 46 percent of their games. Someone on a 100-point pace (1.22 points per game) would be expected to point in about 74 percent of their games. With this data we can then compare how often a player is pointing (how consistent they are), with how consistent we expect a player to be at their point production rate and see how those numbers differ.
Generally, players who are more consistent than expected are more likely to give you lesser production over more games, so fewer multi-point games, but more games with a point overall. When these players are on my roster I feel like my emotional relationship with them is pretty stable, usually not over the moon, but usually not disappointed. On the other hand, players who are less consistent than their point paces suggest are going to be a bit more boom or bust. They have more games than expected with zero points, but more games than expected with multi-point games. They are the ones who can be absolutely infuriatingly silent one week, prompting you to question your faith in them, and then joyously explode the next.
To start with we are going to visit our most consistent players. In the table below we have the same data as above with the addition of our expected consistency rate, and then the difference between the two.
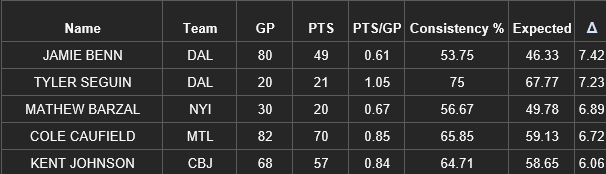
I won't hit all of the players in each list here, but I did want to highlight a few names.
Jamie Benn wasn't incredibly productive in 2024-25, but he certainly was consistent. He ended the season with only four multi-point games, and two of those were right at the end of the season. For the most part then, he was getting single points a bit more often than expected. There were still a couple of dry spells, with a six-game and a four-game stretch with no points, but generally he didn't leave a team hanging too often.
Cole Caulfield had a higher point pace, so we should expect to see some more multi-point games than with Benn. That is true as he put up 14 two-point games, but no game with three points in the entire season. There were very few weeks where he missed helping his manager, with one four-game stretch and one three-game stretch where he didn't point. It took until the end of January for Caulfield to put up two stretches of two or more games without a point.
On the flip side we also have players who have been less consistent than expected.
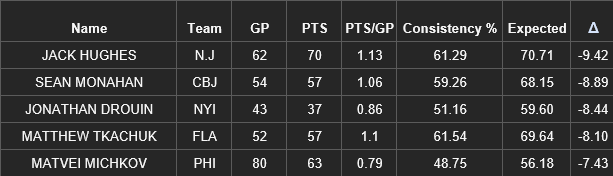
Phew, Jack Hughes was a roller coaster. He had ten three-point nights and 12 two-point nights. He made it until November 19th before he had two stretches of two or more games without a point. It took Caufield two more months to match that, even though his point pace was certainly quite a bit lower. With his point pace, we certainly would have expected Hughes to be quite a bit more consistent. Add to that the injury troubles and having Hughes on your roster was not for the faint of heart.
Jonathan Drouin essentially matched Caufield's point pace and put up 13 multi-point games (compared to Caufield's 14), but in almost half the games. It took him 12 games to get to his second multi-game stretch without a point; it took Caulfield 48. This is just an effective comparison at the difference in rostering these two players. In any 20-game sample Caufield was pointing in about 17 games, Drouin in about 10. The experience in rostering those players was just so entirely different.
That is all for this week.
Do your part to support organizations working to make hockey for everyone.
Professional Women's Hockey League
Related Posts



Starting Goalies



Top Skater Views
| Players | Team | |
|---|---|---|
| ROOPE HINTZ |
 DAL DAL | |
| ALEX LAFERRIERE |
 L.A L.A | |
| LUKE HUGHES |
 N.J N.J | |
| OWEN TIPPETT |
 PHI PHI | |
| KEVIN FIALA |
L.A
| |
Top Goalie Profile Views
 WSH
WSH CBJ
CBJ MIN
MIN UTA
UTA



LINE COMBOS
| Frequency |
 CAR Players CAR Players
| |
|---|---|---|
| 19.5 | ANDREI SVECHNIKOV JORDAN MARTINOOK SEBASTIAN AHO | |
| 18.5 | LOGAN STANKOVEN TAYLOR HALL JACKSON BLAKE | |
| 18.1 | JORDAN STAAL SETH JARVIS NIKOLAJ EHLERS | |
DobberHockey Podcasts

Keeping Karlsson: The 2026-27 Keeping Karlsson Breakfast Club
Don’t you forget about them! Elan and Brian remind you of at least one player on each NHL team whose name you might forget to consider at the draft table.

Fantasy Hockey Life: Tampa Bay Lightning with Erik Erlendsson
Erik Erlendsson joins the program to discuss the Tampa Bay Lightning. Jesse and Victor ask about pros Nikita Kucherov, Jake Guentzel, Brandon Hagel, Brayden Point, Anthony Cirelli, Ilya Mikheyev, Gage Goncalves, Conor Geekie, Benjamin Rautiainen, John Carlson, Victor Hedman, Charle-Edouard D’Astous, Andrei Vasilevskiy, Jonas Johansson, and Dennis Hildeby. In Cat’s instincts, Cat Silverman of InGoal […]
Fantasy Hockey Life: New York Rangers with Colin Stephenson
Colin Stephenson joins the program to discuss the New York Rangers.
Keeping Karlsson: Matchup Maximizer Schedule Deep Dive
Elan is joined by the Keeping Karlsson Accountability Czar Trev to take a deep dive into the NHL schedule for next season and how it should affect our drafting decisions.
Fantasy Hockey Life: Carolina Hurricanes with Ryan Henkel
Ryan Henkel joins the program to discuss the Carolina Hurricanes. Jesse and Victor ask about pros Sebastian Aho, Seth Jarvis, Andrei Svechnikov, Nikolaj Ehlers, Jackson Blake, Logan Stankoven, Jordan Staal, Bradly Nadeau, Felix Unger Sorum, Shayne Gostisbehere, K’Andre Miller, Alexander Nikishin, Sean Walker, Brandon Bussi, and Pyotr Kochetkov. In Cat’s instincts, Cat Silverman of InGoal […]