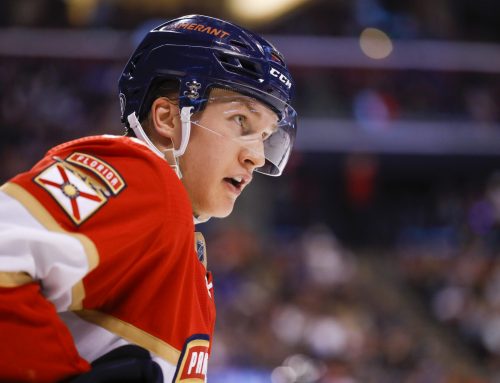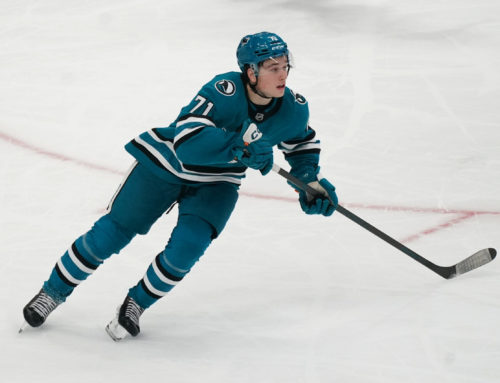
Joe Pavelski vs. Ryan Getzlaf. Despite the slow start, Getzlaf is still the better fantasy own. Five reasons why…
This week I’m finally covering a player I’ve had on my “to do” list forever – Ryan Getzlaf. I’m matching him against Joe Pavelski, not only because it’s been over two years since I last included Pavelski in the column (against Mike Richards!) but also because Getzlaf and Pavelski were selected, on average, within one spot of each other in Yahoo drafts for this season. Cage Match starts now!
Career Path and Contract Status
Getzlaf was selected 19th overall in the superb 2003 NHL draft and, upon arriving in the NHL in 2005-06, turned heads with 39 points in 58 games. He proved he was for real – and then some – by his point total climbing to 58, 82, and then 91 over the next three seasons. Although since then Getzlaf has tallied more than 76 points in a single season only once, he actually had somewhat disguised point per game or better production in four of five seasons from 2009-14 and his 206 points in 198 games over the past three was the fourth highest total of any NHLer.
Pavelski was also drafted in 2003, but not until 184 picks after Getzlaf. Pavelski’s fantasy ascension was slower and steadier – two seasons in the 50-59 point range, followed by two in the 60s, and then his most recent two full campaigns in the 70s. Poolies have embraced this upward momentum, since Pavelski was drafted earlier than Getzlaf this season (average pick 21.5 on Yahoo, vs. 22.5), although that might also be due to Pavelski having C and LW eligibility (versus just C for Getzlaf) plus Getzlaf’s and Anaheim’s slow start having an influence on drafts conducted after the season began.
According to Cap Friendly, Getzlaf counts $8.25M against the cap through 2020-21, while Pavelski’s deal runs only through 2018-19 and comes with a $6M yearly cap hit.
Ice Time
|
Season |
Total Ice Time per game (rank among team’s forwards) |
PP Ice Time per game (rank among team’s forwards) |
SH Ice Time per game (rank among team’s forwards) |
|
2014-15 |
20:05 (R.G.) – 1st 20:07 (J.P.) – 1st |
3:02 (R.G.) – 1st 3:16 (J.P.) – 1st (tied) |
1:42 (R.G.) – 4th 1:32 (J.P.) – 1st |
|
2013-14 |
21:17 (R.G.) – 1st 19:51 (J.P.) – 2nd |
3:40 (R.G.) – 1st 3:30 (J.P.) – 3rd |
2:07 (R.G.) – 2nd 1:35 (J.P.) – 2nd |
|
2012-13 |
20:11 (R.G.) – 1st 18:54 (J.P.) – 3rd |
2:46 (R.G.) – 2nd 3:00 (J.P.) – 4th |
1:29 (R.G.) – 4th 1:33 (J.P.) – 2nd |
|
2011-12 |
21:35 (R.G.) – 1st 20:36 (J.P.) – 1st |
3:40 (R.G.) – 1st 3:12 (J.P.) – 2nd |
1:02 (R.G.) – 9th 1:34 (J.P.) – 1st |
I saw things here that I expected, but others I didn’t. Predictably, the arrival of Ryan Kesler last season curtailed Getzlaf’s Ice Time somewhat and led to him posting only 70 points in 77 games; but he also had similar Ice Times in 2012-13, when he posted 49 points in 44 games. Maybe good luck significantly influenced his 2012-13 output? The same concern exists for 2013-14, since he somehow tallied 87 points despite his highest SH Ice Time and lowest PP Ice Time among these seasons.
With Pavelski, I would’ve expected his Total and PP Ice Times to have increased in each of the past few seasons, not just to track his production increases but also due to the Sharks deemphasizing Joe Thornton. As it turns out, Pavelski had nearly identical Ice Times across the board in 2014-15 (61 points in 82 games) as he did in 2011-12 (70 in 82 games), suggesting perhaps he was lucky last season, or unlucky in 2011-12. And it’s hard to see how he tallied 79 points in 2013-14, as although his PP Ice Time was up slightly, his Total Ice Time was down a bit compared to 2011-12 and 2013-14. Again, the explanation might lie in the influence of luck.
Secondary Categories
|
Season |
PIMs (per game) |
Hits (per game) |
Blocked Shots (per game) |
Shots (per game) |
PP Points (per game) |
FOW (per game) |
|
2014-15 |
0.80 (R.G.) 0.35 (J.P.) |
1.30 (R.G.) 1.18 (J.P.) |
1.23 (R.G.) 1.05 (J.P.) |
2.48 (R.G.) 3.18 (J.P.) |
0.17 (R.G.) 0.38 (J.P.) |
8.20 (R.G.) 7.82 (J.P.) |
|
2013-14 |
0.40 (R.G.) 0.39 (J.P.) |
1.43 (R.G.) 0.57 (J.P.) |
1.13 (R.G.) 0.83 (J.P.) |
2.65 (R.G.) 2.74 (J.P.) |
0.30 (R.G.) 0.38 (J.P.) |
8.98 (R.G.) 8.23 (J.P.) |
|
2012-13 |
0.93 (R.G.) 0.21 (J.P.) |
2.02 (R.G.) 1.00 (J.P.) |
0.95 (R.G.) 0.91 (J.P.) |
2.25 (R.G.) 2.71 (J.P.) |
0.34 (R.G.) 0.23 (J.P.) |
8.07 (R.G.)
📢 advertisement:
7.12 (J.P.) |
|
2011-12 |
0.91 (R.G.) 0.38 (J.P.) |
2.22 (R.G.) 0.61 (J.P.) |
0.88 (R.G.) 1.02 (J.P.) |
2.25 (R.G.) 3.28 (J.P.) |
0.28 (R.G.) 0.22 (J.P.) |
7.79 (R.G.) 6.18 (J.P.) |
Each player holds a fairly consistent advantage in certain categories, namely Getzlaf in PIM, Hits, and Blocked Shots, and Pavelski in Shots and PPP. Although FOW is essentially a wash, Pavelski holds a big edge there due to being eligible as a LW on Yahoo, resulting in valuable FOW per game from a winger.
Getzlaf’s reputation as a Hits stud might need to be dialed back; his per game rate has shrank in each of the past three seasons and in 2014-15 was 40% less than it was in 2011-12. Yet at the same time, his Blocked Shots per game rate has risen in each of the past three seasons. It turns out both Getzlaf and Pavelski are elite producers in Blocked Shots among forwards, as only them and David Backes posted 85+ Blocked Shots and 25+ goals last season.
Pavelski’s sudden jump in PPP in 2013-14 seems easier to justify because he went on to duplicate it last season. And just how hard is it to produce 30+ PPP in two straight seasons? Other than Pavelski, only four other forwards accomplished the feat in both 2013-14 and 2014-15: Sidney Crosby, Alex Ovechkin, Claude Giroux, and Nicklas Backstrom. That’s pretty fine company.
Luck-Based Metrics
|
Season |
Personal Shooting Percentage |
PDO/SPSV (5×5) |
IPP (5×5) |
IPP (5×4) |
Offensive Zone Starting % (5×5) |
|
2014-15 |
13.1% (R.G.) 14.2% (J.P.) |
1007 (R.G.) 1007 (J.P.) |
85.5% (R.G.) 68.8% (J.P.) |
63.2% (R.G.) 71.8% (J.P.) |
50.6% (R.G.) 51.9% (J.P.) |
|
2013-14 |
15.2% (R.G.) 18.2% (J.P.) |
1041 (R.G.) 1024 (J.P.) |
80.3% (R.G.) 80.4% (J.P.) |
76.0% (R.G.) 75.7% (J.P.) |
48.5% (R.G.) 47.5% (J.P.) |
|
2012-13 |
15.2% (R.G.) 12.3% (J.P.) |
1027 (R.G.) 990 (J.P.) |
76.5% (R.G.) 72.0% (J.P.) |
77.8% (R.G.) 44.4% (J.P.) |
47.6% (R.G.) 51.0% (J.P.) |
|
2011-12 |
6.0% (R.G.) 11.5% (J.P.) |
977 (R.G.) 1010 (J.P.) |
65.9% (R.G.) 66.7% (J.P.) |
68.8% (R.G.) 51.6% (J.P.) |
47.7% (R.G.) 48.6% (J.P.) |
This is the reason I track luck-based metrics, since sometimes they provide a very clear explanation for production aberrations. In the case of Getzlaf, in his 2011-12 subpar season not only saw him shoot at 6.0% (less than half his career average) but it was the only season of these four where his 5×5 IPP wasn’t at least 76.5%. Had he shot his 12.2% average instead, and had his 5×5 IPP merely been the average of the other three seasons, his point total would’ve been a far more typical 74 in 82 games instead of the outlying 57 he produced.
And looking at the numbers for Pavelski, there is concern in particular regarding his 79 point 2013-14. His 18.2% Shooting % was considerably higher than his career average of 11.6% and he also had his highest IPP at both 5×5 and 5×4 during this four season window. Plus, he did all this despite his OZ% being the lowest among these four seasons, which would normally have the effect of decreasing his point total. Had his IPPs been the average of the other three seasons and his Shooting % been 11.6%, his point total would’ve been – Pavelski owners, you should probably sit down– only 51 in 82 games, for a jaw dropping difference of 28 fewer points!
Even Pavelski’s production last season – his only other with 70+ points – has to be called somewhat into question due to his still very high Shooting % and IPPs. In reality, Pavelski probably has a ceiling of about 65-70 points, at least until Joe Thornton and Patrick Marleau are completely out of the picture and even then there are at least back of the mind concerns as to whether Pavelski can produce without them around, whereas Getzlaf has already been directly under the spotlight and carried his team’s offensive load for many years.
One last note – in 2014-15 both saw their highest OZ%s of these four seasons. While Getzlaf has proven in several instances that he can produce point per game numbers even if he’s saddled with sub-50% OZ%, Pavelski hasn’t shown he can even tally 70 without good luck smiling too brightly upon him. Thus, if Pavelski falls back below 50%, that could work against him passing the 70+ threshold again without luck like he had in 2013-14.
The winner is……..Ryan Getzlaf
It’s fairly close, but here are five reasons why Getzlaf wins this match:
1) Getzlaf’s only recent subpar season (2011-12) was a result of significant bad luck
Although the presence of Ryan Kesler means Getzlaf should be counted upon for slightly lower point totals and FOW going forward, he’s still a 75-80+ point player. His 2011-12 season can be disregarded since he had an unsustainably low Shooting % and posted points on an abnormally low percentage of goals scored while he was on the ice at 5×5, with those factors together costing him about 17 points in scoring. And the fact that Getzlaf has posted great totals in years where his Offensive Zone Starting % is below 50% is a testament to his skill and ability to produce consistently.
2) Pavelski significantly overachieved in his last two seasons
In his 79 point 2013-14, Pavelski had an outrageously high Shooting % and tallied a point on more than 80% of the goals scored at 5×5 while he was on the ice, coupled with 75% of goals at 5×4. The result was a point total that was grossly – and unsustainable – inflated. And even in 2014-15 (when he posted 70 points), his Ice Times were nearly identical to what he received in 2011-12 (when he scored 61 points), meaning he had somewhat unsustainable good luck yet again. As a result, Pavelski is being looked upon by poolies as a 75+ point player, when for now his realistic production is likely in the 65-70 range.
3) It’s not clear whether Pavelski can shine once he’s “the guy”
Although Pavelski receives the most Ice Time among Sharks forwards and is team captain, the presence of Joe Thornton and Patrick Marleau does deflect some of the pressure – on ice and off – that would otherwise fall more squarely on Pavelski. For poolies in keeper leagues, when they’re both out of the picture, it might be that Pavelski’s production suffers under the added weight and scrutiny of being “the guy.” In contrast, Getzlaf is a true “#1 center” and has thrived for many years with the spotlight shining brighter on him than it ever has – so far – on Pavelski.
4) Getzlaf is undervalued because of where he plays
While this also affects Pavelski to a degree, it has negatively impacted Getzlaf’s value more, and for longer. Getzlaf is one of just two current NHLers (Alex Ovechkin being the other) to play 550+ games while cumulatively averaging more than a point per game over the past eight seasons, yet Getzlaf was somehow only the tenth center eligible player drafted in Yahoo leagues for 2015-16.
5) Getzlaf has produced without being surrounded by supporting talent; Pavelski hasn’t
In 2012-13, Getzlaf had 49 points; the second highest among Ducks forwards was 36. In 2014-15, Getzlaf posted 70 points and the next highest total was 55. And in 2013-14, other than Corey Perry, no Ducks forward finished within 37 points of Getzlaf’s 87. Meanwhile, there were three other Sharks forwards within Pavelski’s 70 points last season, and two others within nine points of his 79 in 2013-14. This reinforces concern that Pavelski might not be able to shine once surrounding talent – notably Thornton and Marleau – are removed from the equation. Or to put it another way, Getzlaf has no downside at present or in the immediate future, while Pavelski comes with more uncertainties.
One Comment
Leave A Comment
You must be logged in to post a comment.


 MTL
MTL VGK
VGK OTT
OTT CGY
CGY DET
DET ANA
ANA NSH
NSH

Roos, nice match. Awesome information. Would love to see a couple matches between veterans and up and comers like Crosby vs Seguin (both are C @ ESPN) and Perry vs Kucherov.
cheers Grapes