

Analytics Advantage: Production Aging Curves Among Forwards, Defensemen, and Goalies
Stas Pupkov
2026-07-10
Picture two 31-year-olds, both coming off 55-point seasons, both available at the same keeper price. One is a winger and one is a defenseman. A dataset of every NHL season since 1917 says that choice isn’t close, but the reason is different from the one you usually hear, and getting it right means walking past a couple of traps that swallow most aging analysis whole. When we get to goalies, the trap turns out to be the finding itself.
Three quick definitions so this column stands on its own. 'Production Index' is a player’s scoring rate relative to his own season’s positional average, where 1.00 means exactly average. 'Share of Peak' chains together how the same player changes from age to age, so it measures aging instead of survival. And ΔSV‰ is a goalie’s save percentage minus the league’s average save percentage, in saves per thousand shots.
Both positions peak at 26
Run the delta method over 108 seasons of forwards and you get the textbook arch. Steep growth, a crest, a long slide. The folklore says defensemen bloom late, so do they peak later? No. Both curves peak at age 26. (Fig. 1.)
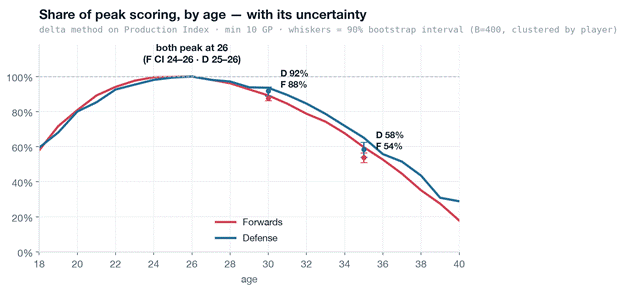
Figure 1
A curve without an uncertainty statement is a drawing rather than a finding, so I bootstrapped the whole pipeline 400 times, resampling players rather than seasons. The peak lands at 26 for forwards with a range of 24 to 26, and at 26 for defensemen with a range of 25 to 26. Anyone selling you a story about defensemen peaking at 29 is describing survivors. The careful published work lands in the same place: a 2024 peer-reviewed study of a century of point shares puts both positions’ peak at 26 to 28, together. Value metrics like WAR do peak earlier, around 23 or 24 because ice time and defensive load age on their own clocks. Scoring peaks at 26. Impact peaks a little sooner.
Where the folklore gets something right is the back side of the curve. At age 30 a defenseman keeps about 92% of his peak scoring against a forward’s 88%. Small gap, but it’s the reliable one: the bootstrap puts it at 4 points with a 90% interval running from +1 to +6, so it doesn’t cross zero. By age 35 the gap grows to about 5 points (59% against 54%), though there the interval touches zero, so treat that as a strong lean rather than settled fact. Price the same players in wins above replacement and the split gets dramatic: at 35 a defenseman holds about 52% of his peak value while a forward holds about 39%. (Fig. 2.) Every year after 29, the same keeper slot buys more future on the blue line, and the mechanism is a shallower decline the whole way down rather than any later peak.
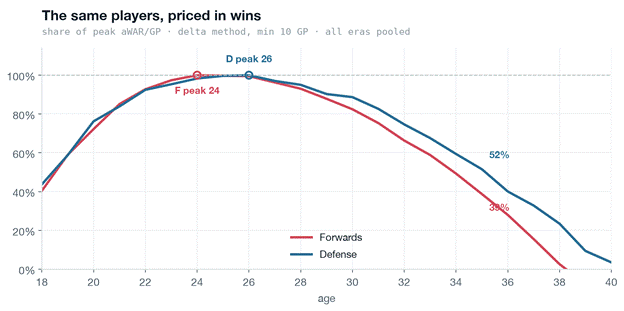
Figure 2
The trap under every aging chart
Here’s the part most aging articles skip, because it ruins the clean chart. The league deletes the sample while you’re reading it. Take every forward who held a full-time job at age 23. Fewer than half still play at 30. One in six and a half is left at 35, and one in twenty-three at 38. (Fig. 3.) Defensemen last a bit longer. Goalies last longest of all, and you should hold that thought for a few paragraphs.
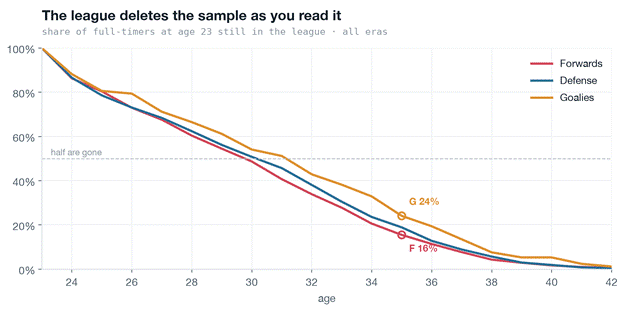
Figure 3
This survivorship problem is exactly why the delta method exists. By chaining within-player changes, it avoids comparing the age-38 survivors, your Gordie Howe and Jaromir Jagr types, against the age-24 everyman. It’s also why the popular contract-window analyses that require a player to complete the next seven seasons come out so sunny. Everyone who fell out of the league mid-deal simply vanishes from the average. So, I built the table the other way around. Dropout counts as zero, because zero is what your roster actually gets.
Here’s the honest keeper table. It shows era-calibrated wins per year over the next seven years, as a share of sign-year value:
| Sign at age | Forward | Defenseman | Avg seasons actually played (F) |
| 24 | 72% | 70% | 6.1 of 7 |
| 26 | 57% | 58% | 5.7 |
| 28 | 50% | 53% | 5.2 |
| 30 | 39% | 45% | 4.4 |
| 32 | 33% | 38% | 3.9 |
Read the age-30 row twice. A 30-year-old forward over a seven-year horizon delivers about 39% of his current value per season once the disappearing acts are priced in. The survivor-only version of that same number, the one most analyses print, is roughly 87%. That 48-point gap is survivorship bias in a single line, and it’s the most expensive illusion in keeper leagues.
One more honesty note before tiers. At every age, the spread between a 90th-percentile and a 10th-percentile forward dwarfs the aging effect. The curve tells you what a birthday costs on average, but it never tells you who the player is.
Old stars are safer than old depth, but not for the reason you think
Do stars age differently from role players? The naive way to check is to tier players by their peak, and it produces a spectacular chart with a wrong conclusion, because a fringe player’s peak is partly luck and luck regresses. So, the definitions here are strict. A player’s tier comes from his established level at ages 19 to 24 (top 10% of this range is elite and bottom 25% is fringe, within position), and aging gets measured only from 25 onward. Tier membership never gets to peek at the outcome.
Measured that way, elite forwards keep 71% of their age-25 production at 33 while fringe forwards keep 53%, and by 36 the gap roughly triples. (Fig. 4.) That’s half the size of what the naive method claims, and it’s real.
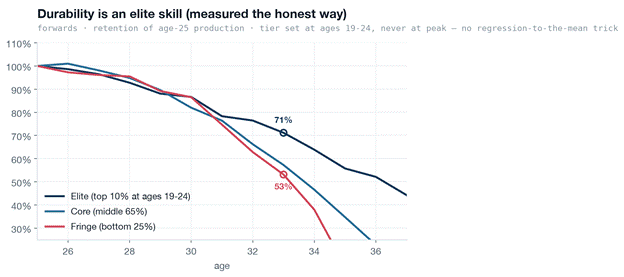
Figure 4
Before you conclude that stars carry an anti-aging gene, though, CJ Turtoro’s aging series raises the sharp objection: great players aren’t slow agers, they’re simply so good that aging takes longer to drag them out of the league. Wayne Gretzky’s best season came at 23, Howe’s at 24, Jagr’s at 23. The ageless greats all peaked young. Our data agrees with him on the physics, too. In absolute terms an elite forward actually loses more production per year after 25 (about 0.07 index points) than a fringe forward does (0.03). He just falls from four times the altitude. Both readings are true at once, faster raw decline and higher percentage retention, and the percentage version is the one your roster feels: 71% of an elite level is still a top-liner, while 53% of a fringe level is a waiver claim. Call the edge what it is: Altitude, not immunity.
Goalies: the curve that isn’t there
Run the same delta machinery on goalies and you get noise with a slope of approximately nothing. The within-goalie year-over-year change in ΔSV‰ sits around minus 2 per year at every age, the same at 24 as at 34. That’s regression to the mean wearing a birthday hat. A goalie who just posted a good relative save percentage was probably a little lucky and gives some back the next season regardless of age. Single-season save percentage is so noisy that if an age signal exists, it drowns. The best public work hits the same wall, concluding that a completely flat career can’t even be ruled out.
So, the honest chart shows something else: who’s in the net at each age, and where the starts go. (Fig. 5.) Three facts sit in one frame. The best collective net belongs to age 30, at +0.4 per thousand. The workload peaks earlier (at 26-28) and quality goes negative at 32, sinking to around minus-4 by 38 while the starts fade much more slowly. The league hands its trust to 27-year-olds, gets its best goaltending from 30-year-olds, and keeps starting 33-year-olds after the quality has left, because reputation carries a longer contract than performance. Starts are the scarce, predictable asset and save percentage is where the noise lives, so draft the workload window and stream the rest. And remember the survival chart: 24% of goalies who were full-timers at 23 still hold jobs at 35, the best survival of any position, which sitting next to that quality line is a strange kind of compliment. Survival and value are different things.
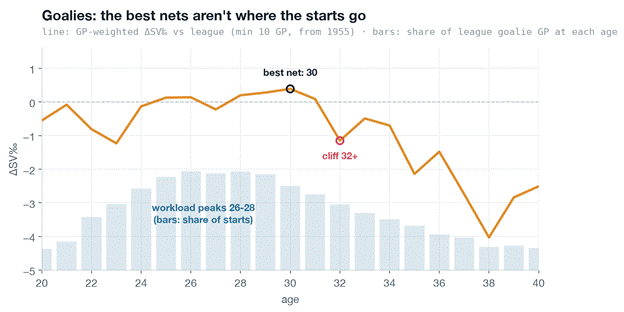
Figure 5
The careers that broke the curve
Averages describe populations. Rosters get built from individuals. (Fig. 6.) Gordie Howe was still producing at 82% of a league-average forward’s rate at age 51, which is a job, not a farewell tour. Bobby Orr peaked at 5.4 times the average defenseman, the largest positional dominance ever recorded, while Ray Bourque and Nicklas Lidstrom put up 20-year plateaus that barely acknowledge the curve exists. Martin St. Louis was below average at 23 and won an Art Ross at 37 at 2.8 times league average, the late-entry career arc that flexible aging models keep finding and the average curve pretends doesn’t exist. The goalie panel carries the whole goalie thesis in three lines: Dominik Hasek peaking at +34 per thousand shots at age 29 and still posting +23 at 41, Martin Brodeur peaking statistically at 24 and then delivering two decades of volume, and Tim Thomas putting up +25 at 36, a late bloom the population curve says shouldn’t happen. The curve prices the population. You still have to price the player.
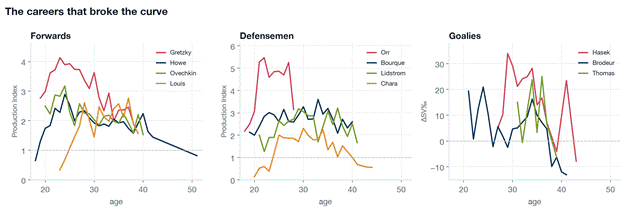
Figure 6
The playbook
- Peaks are boring. Both skater positions crest at 26. Stop paying for projected age-27 breakouts, because the growth is already priced in.
- Buy the blue line after 29. The defenseman retention edge at 30 is one of the few aging claims here that clears a confidence interval.
- Price the vanishing along with the fading. A 30-year-old forward on a seven-year horizon is worth about 39% of current value per year once dropout is included.
- Trust old stars and fear old depth. Elite level at 19 to 24 predicts holding rosterable value at 33 and beyond, through altitude rather than slower aging. Old depth has no altitude to spend.
- Never pay for a projected goalie aging pattern. The within-goalie age signal is statistically invisible. Draft the 26-to-30 workload window, fade starters 32 and older by default, and take late-bloomer flyers seriously.
- Individual variance beats every rule above. That’s why scouting exists.
Aging curves are population statements with real uncertainty, a survivorship trap, a tier structure, and, for goalies, a curve-shaped hole where the signal should be. Once all of that is priced in, the market’s aging discounts are mis-calibrated in directions you can actually know in advance. That’s the edge.
Data: NHL official league totals, 1917-18 through 2025-26, regular season, with save percentage from 1955. Delta method per Tango and Lichtman via Evolving-Hockey and Turtoro. Bootstrap and survivorship handling documented in the series methodology notes. aWAR validated against hockey-reference Point Shares (r = 0.91 to 0.93).
2 Comments
Leave A Comment
You must be logged in to post a comment.
Related Posts

Starting Goalies



Top Skater Views
| Players | Team | |
|---|---|---|
| ROOPE HINTZ |
 DAL DAL | |
| ALEX LAFERRIERE |
 L.A L.A | |
| LUKE HUGHES |
 N.J N.J | |
| OWEN TIPPETT |
 PHI PHI | |
| KEVIN FIALA |
L.A
| |
Top Goalie Profile Views
 WSH
WSH CBJ
CBJ MIN
MIN UTA
UTA



LINE COMBOS
| Frequency |
 CGY Players CGY Players
| |
|---|---|---|
| 21.5 | MATVEI GRIDIN MORGAN FROST MATT CORONATO | |
| 21.4 | JOEL FARABEE BLAKE COLEMAN MIKAEL BACKLUND | |
| 16.2 | YEGOR SHARANGOVICH ADAM KLAPKA RORY KERINS | |
DobberHockey Podcasts

Keeping Karlsson: The 2026-27 Keeping Karlsson Breakfast Club
Don’t you forget about them! Elan and Brian remind you of at least one player on each NHL team whose name you might forget to consider at the draft table.

Fantasy Hockey Life: Tampa Bay Lightning with Erik Erlendsson
Erik Erlendsson joins the program to discuss the Tampa Bay Lightning. Jesse and Victor ask about pros Nikita Kucherov, Jake Guentzel, Brandon Hagel, Brayden Point, Anthony Cirelli, Ilya Mikheyev, Gage Goncalves, Conor Geekie, Benjamin Rautiainen, John Carlson, Victor Hedman, Charle-Edouard D’Astous, Andrei Vasilevskiy, Jonas Johansson, and Dennis Hildeby. In Cat’s instincts, Cat Silverman of InGoal […]
Fantasy Hockey Life: New York Rangers with Colin Stephenson
Colin Stephenson joins the program to discuss the New York Rangers.
Keeping Karlsson: Matchup Maximizer Schedule Deep Dive
Elan is joined by the Keeping Karlsson Accountability Czar Trev to take a deep dive into the NHL schedule for next season and how it should affect our drafting decisions.
Fantasy Hockey Life: Carolina Hurricanes with Ryan Henkel
Ryan Henkel joins the program to discuss the Carolina Hurricanes. Jesse and Victor ask about pros Sebastian Aho, Seth Jarvis, Andrei Svechnikov, Nikolaj Ehlers, Jackson Blake, Logan Stankoven, Jordan Staal, Bradly Nadeau, Felix Unger Sorum, Shayne Gostisbehere, K’Andre Miller, Alexander Nikishin, Sean Walker, Brandon Bussi, and Pyotr Kochetkov. In Cat’s instincts, Cat Silverman of InGoal […]
After a couple of decades of reading Dobber, I must have read hundreds of posts about analytics. This was my favorite one! Good data, clear explanations and fantastic insight – thanks!
I almost never comment on articles but feel compelled to do so in this instance. Thanks for the very interesting, informative and well-written analysis here. One of the most fantasy-useful pieces I’ve read in a long time. *Stick tap