The Power of Numbers (Part 2)
Ryan Ma
2014-01-14

Ryan Ma checks in with part two of his Power of Numbers feature
Last week we delved into how certain numbers can be used to your advantage when planning for a victory at season's end. This week we'll take a look at the "outliers" from the first half and identify players who are due for an increase or regression for the second stanza.
Link to last week's column if you missed it.
The full lists can be downloaded from my dropbox account.
Link to the PDF File – Defenseman
Link to the PDF File – Forwards
-
Based on my research during the last 6-7 years, I’ve basically narrowed point production for all players down to 3 key factors, which are, time on ice, PP time on ice (percent of team PP) and shots on goal.
-
-
Those 3 factors are basically the most important factors in terms of correlation to point production; as with all cases, there's always going to be outliers, (highly talented rookies who are handcuffed), pass first players (Jumbo Joe) and veterans who are being “managed” (Selanne, Iggy and Alfredsson) being the most significant, so the data don’t always fit 100% of fantasy players.
-
-
With forwards, the strongest correlation to points is PP TOI, which has an R-squared value of a whopping 0.80, which is huge! Second is SOG with an R-squared value of 0.77 and third is overall TOI with an R-squared value of an R-squared value of 0.76.
-
-
With defensemen the strongest correlation to points is SOG, which has an R-squared value of a whopping 0.78, which may not be as strong as for the forward stats, but good enough in our scenario. Second is PP TOI with an R-squared value of 0.71.
-
Using FrozenPool (a tool that I can't speak more highly of), I analysed the three factors which has the greatest effect on point production. Here are the graphs of the results.
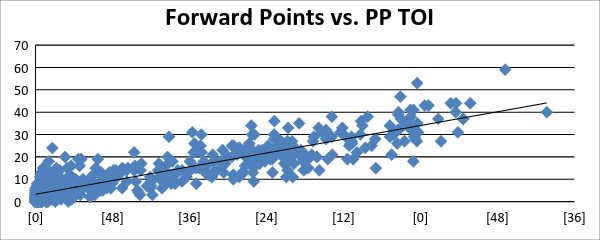
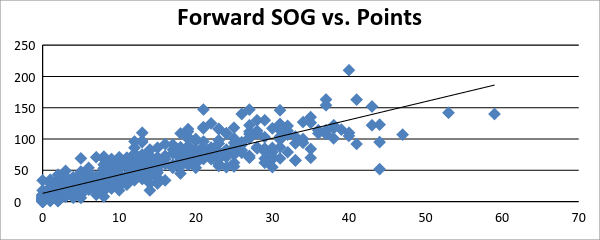
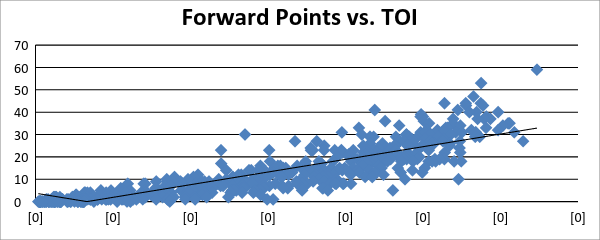
As you can tell with all three graphs, there's a pretty strong positive correlation between these three factors and point production. (download the PDF files, if you want to see the graphs a little bit better, they're skewed a bit given the dimensions of the document.) The jist of the matter is the more a player is on the ice for the power play and overall plus the more they shoot, the more points they should theoretically tally.
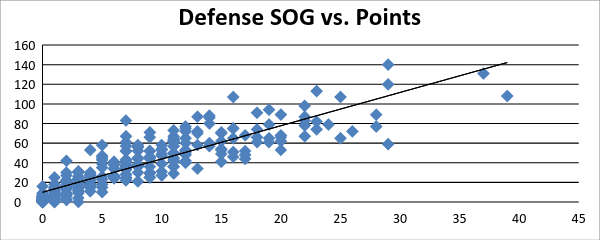
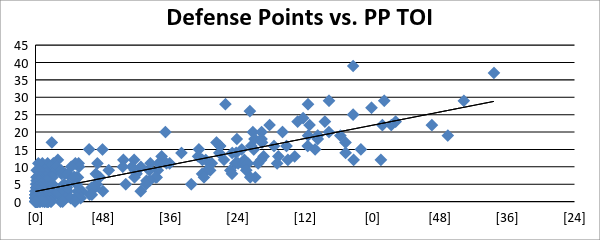
There's a similar trend with the defensemen stats. Both graphs indicate that there's a strong positive correlation between PP TOI and point production and between SOG and point production. From the data that I've gathered there wasn't a very strong correlation in terms of TOI vs. point production (somewhere around 0.49 R-squared). My hypothesis is that perhaps within the data are your "stay at home" types who are big minute chewers but aren't necessarily heavy point producers (Brayden Coburn, Josh Gorges, Willie Mitchell and Douglas Murray types), which would skew the numbers. The talking point is if you're looking for point production from the blue-line look for players who shoot a lot and garner a large portion of power play time.
Now onto the good stuff!
Buy Nows
Brad Richards – C- New York Rangers
If you look at the major three indicators, he's in for a big second half if the numbers normalize to where they should belong. He's appearing in 67.2 percent of the Rangers' PP chances (11th among all NHL forwards), and he's also averaging three SOG per game (top-35ish), yet he's only producing at a 0.66 point-per-game pace (54 point pro-rated pace). The TOI is a little bit low at 19:14, and you'd ideally want to see that into the 20s, but that's a small blip on the radar. He's a serious "buy low" candidate for the 2nd half.
Evander Kane – LW – Winnipeg Jets
Mr. Moneybags might not have his head screwed on completely straight, but there are a couple of tell-tale signs that he should be in for a big second half. He's averaging a mind boggling 4.3 SOG while garnering over 20 minutes of ice-time per contest. The downside is that the Jets tend to evenly spread their PP time around to all of their players, with Bryan Little, Olli Jokinen and Andrew Ladd comprising the top unit, and Kane, Devin Setoguchi, Blake Wheeler and Mark Scheifele relegated to picking up the scraps. If Kane can ever manage to get into that optimal 55-60 percent of PP appearances range, his numbers will completely explode.
Steve Ott – LW – Buffalo Sabres
The Sabres completely perplex me. Ott averaged just under 20 minutes (19:39) with a reasonable SOG rate of 1.8 per contest yet he operated at a 0.25 point-per-game rate! Granted the 35.3 percent of PP time is a bit of a downer, but how can T.J. Oshie (48.4, 1.7, 19:38) post a 0.85 point per game pace, but Ott is at 0.25? Yes, I know, the simple answer is Buffalo sucks! But I just don't buy that they will be this bad for the whole season.
Dustin Brown – LW – Los Angeles Kings
Brown is in a very similar situation. The three indicators show that he's underachieving by a fair margin. His SOG (2.8 per game) is still up there, and while he doesn't see top unit PP time anymore (39.2 percent), and his TOI has dropped to below 17 minutes per game, you would still expect something more than just a 0.33 point-per-game pace. He was a career 0.61 point-per-game producer prior to this season, so I don't expect him to operate at half that clip for the duration of an entire season. The Kings are very deep offensively, but Brown should still see a boost in the second stanza.
Dennis Wideman – D – Calgary Flames
The Flames' offense might not be great, but Wideman is certainly receiving plenty of responsibility in Calgary. Prior to his injury, he was operating at close to a pro-rated 40-point clip, while appearing in 67.5 of the Flames' PP opportunities. He was also averaging 26:15 along with firing 2.4 SOG per contest. If he can return to those numbers in the 2nd half, he should be a strong "buy" candidate moving forward.
Kris Letang – D – Pittsburgh Penguins
Letang has been struggling this season with injuries as well as production, posting just 11 points in 24 contests during the first half. If you compare his percentage of PP appearances (75.9) and SOG (three per game), they're along the same lines as what P.K. Subban (78.5 and 2.9) and Erik Karlsson (77.2 and 3.1) are posting, yet both are producing at rates (0.71 and 0.88 respectively) that are well above what Tanger is demonstrating. He does have "big name" status, so it'll probably be fairly difficult to pry him off his owner, but if you can manage to find a way, definitely do so.
Honorable mentions: Alex Ovechkin, Mikko Koivu, Tomas Vanek, Ryan Kesler, Zach Parise, Teddy Purcell, Mike Cammalleri, Travis Zajac, Troy Brouwer, Rick Nash, Alex Semin, Lee Stempniak, Ryan Callahan, Lubomir Visnovsky, Alex Edler and Cody Ceci.
Lay-by
Eric Staal – C – Carolina Hurricanes
See column: especially read the comments section.
Patric Hornqvist – RW – Nashville Predators
See thread in forums.
Tomas Fleischmann – RW – Florida Panthers
The Panthers are shaping up to be an "offense by committee" team, but there are some players who are garnering a slightly bigger piece of the pie. Flash is one of them as he's appearing in just over 50 percent of Florida's PP chances, while also firing at a respectable rate of 2.6 SOG per game. His current shooting efficiency of 4.7 percent is a career-low and well off his career numbers of 12.5 percent, so if that "normalizes", the second half numbers should be better than the 0.48 rate he recorded in the first half.
David Clarkson – RW – Toronto Maple Leafs
This one is a little bit of an "out there" selection. Clarko recently signed a seven-year, $36.75 mil contract with the Leafs in the off-season, and if you project his numbers for April he would post 18 points for a salary of $4.5 mil (which works out to be 250k per point). As an aside how many water bottles could Bertuzzi buy Clarko with 250k? You know what? I would honestly sit there and ensure that all of his water bottles would be protected, polished and filled for an annual salary of 250k. Anyways, I know that his role has changed from what it was with the Devils, but he has essentially been a 25-30 goal producer during the last two seasons, so a regression to a third of that is a pretty big drop off. Expect a little bit of a boost moving forward.
Brian Campbell – D – Florida Panthers
Campbell's numbers (73.1, 27:31 and 1.6) are up there as per usual, but his point production has dipped so far this campaign (0.46). Since joining the Panthers in 2011, he's recorded a 0.62 point-per-game pace, so look for him to be closer towards that mark the rest of the way.
Roman Josi – D – Nashville Predators
Ryan Suter made a pretty good living in Nashville playing alongside Shea Weber, and it appears that Josi is following along the same path. Both key indicators (58.3 percent of the PP and 2.5 SOG/G) identify Josi as a potential second half breakout candidate. The fact that he's spending 74 percent of his shifts alongside Weber is a good sign for him to improve upon his 0.40 point-per-game pace during the second half.
Honorable mentions: David Perron,Mike Ribeiro, Jason Pominville, Matt Moulson, Scott Hartnell, Cody Hodgson, Tyler Ennis, Curtis Glencross, Todd Bertuzzi, Dany Heatley, Tomas Kopecky, Steve Bernier, Andrei Markov, Keith Yandle, Paul Martin, Dion Phaneuf, Christian Ehrhoff, Mark Giordano, Jamie McBain, Kris Russell, Tyson Barrie, Philip Larsen, Jack Johnson, Sami Salo, Dougie Hamilton, Michael Del Zotto, Sami Vatanen, Dmitri Kulikov and Ryan Murray.
Farmer's Market
Marian Hossa – RW – Chicago Blackhawks
The Hawks are just posting ridiculous numbers at the moment. 3.62 goals per game is a mark that has occurred on only a handful of occasions since the 2004 lockout, and I'm not buying that this pace can be sustained for an entire season. The difference between Hossa and his teammates is that Hossa is garnering just 40.3 percent of the Hawks' PP time, compared to Patrick Kane (64.1), Jonathan Toews (60.8) and Patrick Sharp (63.3). He's also garnering just over 18 minutes per contest, which is fairly low for a player who's posting a point-per-game rate of 0.92. He won't completely fall from the face of the Earth, but this scoring rate is unsustainable if the big four remain reasonably "healthy".
Bobby Ryan – LW – Ottawa Senators
Ryan is having himself a solid fantasy season, but he lacks any "intensity" in his stats to propel him into the "elite" category. He appears in only 48 percent of the Sens' PP chances, while putting up a run-of-the-mill 2.6 SOG per contest. The big kicker for him is that he averages just 17:11 per contest, which is well below his peers who are putting up similar point totals. The trio of Kyle Turris, Clarke MacArthur and Ryan were gelling in the first half, but I wouldn't depend on that production to continue for the rest of this campaign. Maybe the Olympic snub might light a fire under his bottom, but I'm not banking on it to continue.
Matt Duchene – C – Colorado Avalanche
Duchene is in an interesting scenario, as I think he definitely has the talent to become an "elite" point-per-game plus scorer in the league someday, but unfortunately is just lacking the responsibility at the moment. A lot of his production will be determined by what the Avs do with potential UFA Paul Stastny at the trade deadline. At the moment, Stastny is occupying that "top line" center spot alongside Gabriel Landeskog and Ryan O'Reilly, while chewing up 18:41 per contest, with 2:20 of which occurring on the man advantage. If he is moved, the Avs could potentially give more responsibility to Duchene alongside the "big boys" and push him up towards the 20+ minute barrier, which tends to be where the point-per-gamers typically sit. If Stastny stays, Duchene will continue to be handcuffed and I doubt that he could maintain a point-per-game rate with limited responsibility. Duchene's fantasy production could go either way in the second half.
Jay Bouwmeester – D – St. Louis Blues
Much like the Hawks, the Blues' offense was on a bit of a tear in the first half while averaging above the 3.5 goals per game mark. St. Louis is on pace for an interesting stat, where they're the only team in the league who could potentially have three 50-point defensemen at season's end, a feat which only one team has accomplished during the last 16 seasons (Detroit in the 2008-09 season, with Nicklas Lidstrom 59, Brian Rafalski 59 and Niklas Kronwall 51, finished with a 3.52 goals per game average). If you look at the "typical" numbers for blue-liners who operate near the 0.65 point-per-game pace, they all have PP percentages well into the 60s with SOG averages close to the three per game mark. J-BO is 42.1 and 1.8 respectively in those stats. I would love for him to continue that pace, but I see him regressing more towards the 0.5 mark moving forward.
Brent Seabrook – D – Chicago Blackhawks
Ditto to the paragraph above except Seabrook's numbers are 36.5 and 1.8. If Hawks' regress in the second half, Seabrook's numbers could plummet.
Honorable mentions: Milan Lucic, Derek Roy, Jussi Jokinen, Mikkel Boedker, Alex Galchenyuk, Nick Foligno, Victor Hedman, Jonas Brodin, Marc Methot, Johnny Boychuk, David Savard, Ben Lovejoy and Brendan Dillon.
Fire Sale
Reilly Smith – C – Boston Bruins
Smith was largely considered a "throw in" for the Tyler Seguin/Loui Eriksson deal between the Stars and the Bruins, but he's certainly been productive, given his relatively "low profile" draft ranking and his play through the NCAA system. Even his nine points in 37 contests last campaign, was not an indication for his torrid first half pace, in which he displayed a 0.78 point-per-game ratio. The Bruins are as deep offensively as the Blues, Hawks, Ducks, Sharks and Kings, but there's also got to be a limit to a role player's point production when they garner fairly low power-play time (33.8), a low SOG average (1.7) and limited overall ice-time (14:14). Smith does have talent, but I just don't see him outscoring Jarome Iginla, Milan Lucic and Patrice Bergeron for an entire season.
Mikhail Grabovski – C – Washington Caps
I mentioned Grabovski a little bit last week. His numbers continue to perplex me. According to my first quarter numbers, he was "supposed" to be a huge regressor in the second quarter, but it never came into fruition. His numbers (1.4 SOG/G and 15:57) are very similar to what Mike Ribeiro posted last season (1.3 and 17:50), so I guess I could buy the "he did it last season, so why can't Grabo repeat?" argument. But the key difference was that Ribeiro also played a major role on the top power play unit with Alex Ovechkin and Nicklas Backstrom (63.4 percent of Caps PP chances), but that number is only 29.7 percent for Grabo, so something's got to give.
Jaden Schwartz – C – St. Louis
I've always been a fan of Schwartz since he was drafted back in 2010. His career reminds me a lot of Toews' career. I'm not talking about style of play, size or leadership ability, just from an NCAA transitioning to the NHL production perspective. The major difference between Toews and Schwartz is that the former was thrust and drafted into a leadership role. Schwartz, in my opinion, was drafted more for a support role, while David Backes, Alex Steen, Vladimir Tarasenko, Patrik Berglund and Oshie take care of the other aspects, which is why his numbers (24 percent on the PP, 2.2 SOG/G and 16:48 per contest) have been a bit handcuffed in the first half. He did see a recent boost in responsibility with Backes and Steen sustaining injuries and opening up some ice-time for the youngster, but if the Blues ice a fully "healthy" squad, Schwartz will see that responsibility dry up once again.
Andrew Cogliano – C – Anaheim Ducks
Cogs is in a bit of an interesting place, as all of his numbers indicate a regression in the second half. But with that said, he's only on pace for 48 points, so does it really matter if he regresses? One of the big factors is that the Ducks are ridiculous at home, averaging 3.89 goals per game at the Honda Center compared to 2.8 on the road. Cogliano's numbers are an indication of that as he's recorded 13 points in 19 home contests (0.68) compared to 13 in 25 on the road (0.52). Anaheim will play 15 of their next 21 contests at home, which makes now a great time to "use and abuse" him, before tossing him back on the waiver wire after March 10th.
Honorable mentions: Brandon Saad, Tomas Hertl (hurt), Michael Frolik, Pascal Dupuis (hurt), Jason Chimera, Brad Marchand, Danius Zubrus, Dwight King, Michal Handzus, Niklas Hjalmarsson, Derek Morris, Marc-Edouard Vlasic, Olli Maata, Nikita Nikitin, Jan Hejda, Ryan Stanton, Johnny Oduya, Marco Scandella, Steve Oleksy, Tom Hickey
As I mentioned last week, I will be the first to accept the fact that when looking at numbers, you are looking at it from a "summative" perspective (it's already happened) and that there's absolutely no certainty that the situation will necessarily change for the future. What I would argue is that, numbers tend to "normalize" to some degree, and the ones that I've identified are, in my opinion, due for some form of correction. I won't guarantee 100% correctness, but I'd be pretty happy with three out of every four.
How to use FrozenPool to your advantage.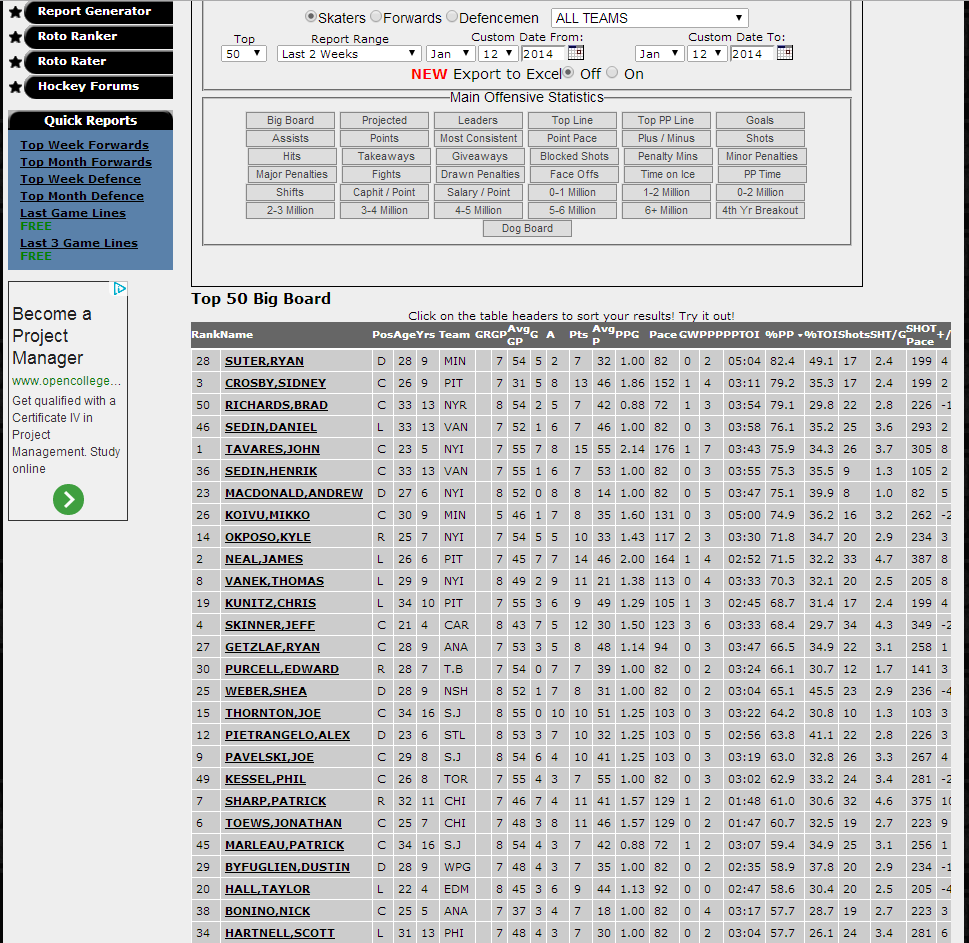
Hopefully with these articles I've turned you into a stronger believer into looking more deeply at the numbers, and perhaps you can use my findings, to better your position in your fantasy leagues.
Shout out to Lil_Rob and number54 from the forums who are better at analyzing and interpreting "stats" than me. They helped me tremendously with the data from this column to fine tune it and making it more accurate, so if you guys have a chance to "rep" them, definitely do so.
This is just some of the gold you will find to set yourself up for the second half – pickup the seventh annual Midseason Fantasy Guide here and seize victory!
Related Posts
UPCOMING GAMES
| Apr 23 - 19:04 |
| vs |
| |
| Apr 23 - 19:04 |
| vs |
| |
| Apr 23 - 21:04 |
| vs |
| |
| Apr 23 - 22:04 |
| vs |
| |
Starting Goalies
Top Skater Views
Top Goalie Profile Views
LINE COMBOS
| Frequency |
| |
|---|---|---|
| 21.3 | MARTIN POSPISIL ANDREI KUZMENKO NAZEM KADRI | |
| 20.9 | CONNOR ZARY YEGOR SHARANGOVICH JONATHAN HUBERDEAU | |
| 20.6 | ANDREW MANGIAPANE BLAKE COLEMAN MIKAEL BACKLUND | |
DobberHockey Podcasts

Fantasy Hockey Life: Salary Cap Basics Remix
If you missed last year’s series on salary leagues, this is a remix with some bonus material. Jesse and Victor discuss the different ways you can step up your dynasty league with a salary component. Our show is part of the Dobber Podcast Network and sponsored by Fantrax.com. Email [email protected] and ask to join our […]

Keeping Karlsson: No. 533 – Ultimate Champion Interview + Playoff Preview
On this week’s Keeping Karlsson Fantasy Hockey Podcast mega-show, Elan and Brian gather and analyze the latest fantasy hockey news, notes and data.
Fantasy Hockey Life: Tim-Eh’s Time in the TIDY Top Tier
When one of the managers in the TIDY league top tier left midseason, Patron Tim volunteered to give up his excellent team to take over a mid-season orphan fighting to escape relegation. And Tim did not go quietly. Ryan, Jesse and Victor welcome Tim to talk through his experience and the trades he made in […]
Keeping Karlsson: Better Off Nedeljkovic
On this week’s Keeping Karlsson Fantasy Hockey Podcast mega-show, Elan and Brian gather and analyze the latest fantasy hockey news, notes and data from the past season to work on projecting the 2023-24 NHL and fantasy hockey season. — Join the Keeping Karlsson patron community! Patrons get guaranteed KKUPL invitations, plus monthly bonus AMA episodes, and full access to […]
Fantasy Hockey Life: FHL Player Cards with Brandon
Our guy Brandon has been doing great work behind the scenes to great Fantasy Hockey Life prospect player cards, visualizations with the metrics we care about most – including BASH. These are a great tool to catch at a glance the stats for upcoming players. Jesse interviews Brandon and Victor on the decisions behind what […]