
Who would you rather have on your fantasy squad? Phil Kessel or Patrick Kane? Analysis here…
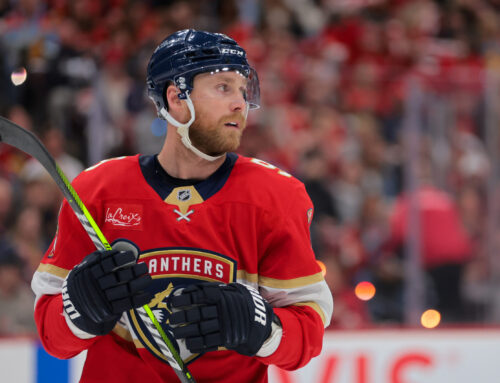
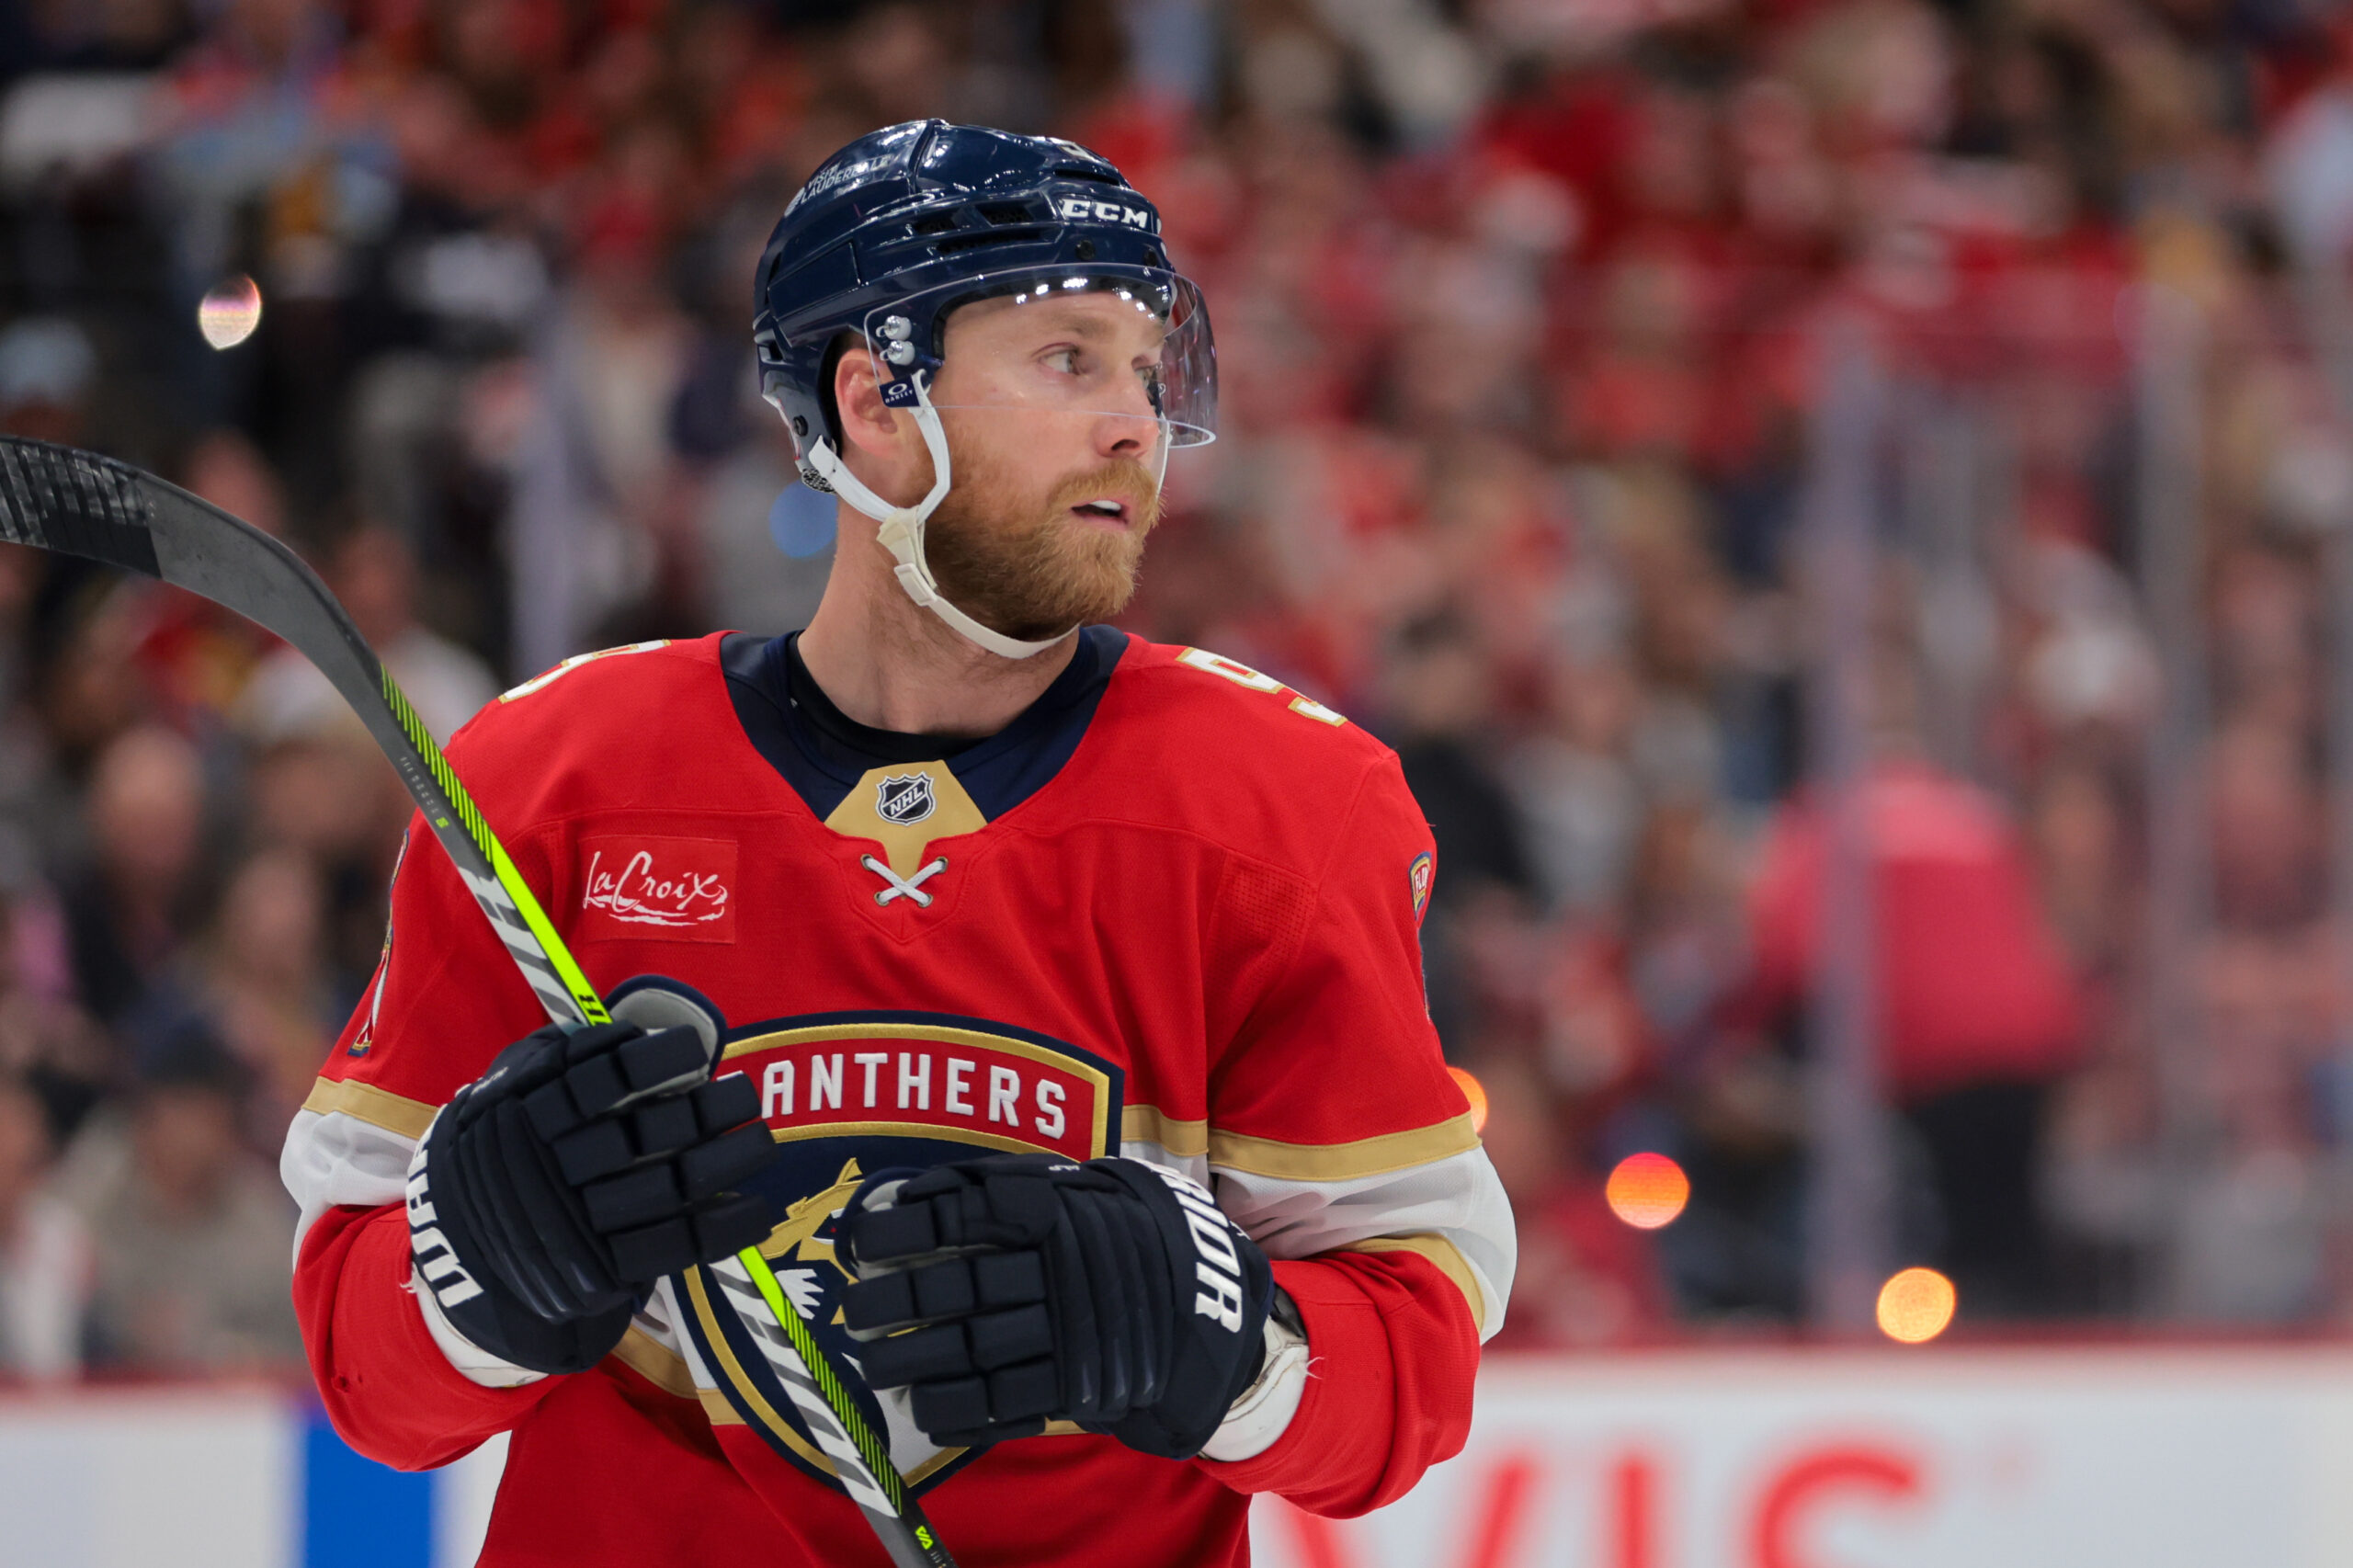
When I stepped in to do the May 21st Ramblings, one of the comments I received was from "tothemax", who thought I should try to incorporate elite players in Cage Match more often. Well – when it comes to Cage Match, ask and you shall generally receive – this week sees Patrick Kane pitted against Phil Kessel in a battle of arguably two of the NHL's top wingers.
Career Path and Contract Status/Cap Implications
In Kessel and Kane you have two former top five overall draft picks (Kane went first in 2007, Kessel fifth in 2006) who landed the NHL for good the same year they were drafted. Both are now 500+ game NHL veterans, and genuine fantasy cornerstones.
Kane has hit the point per game mark four times, and although his full season career high is only 88 points (achieved back in 2009-10), his 55 points in 47 games for 2012-13 projected to 96 points over an 82 game season. Also, three of his point per game seasons have come in the last four campaigns.
Kessel started his career slowly with Boston, but has now scored 30+ goals in each of the past five full seasons, making him one of only three NHLers to achieve that mark (Alex Ovechkin and Patrick Marleau are the others). Kessel hasn't actually finished a full season above 82 points so far; like Kane – his best season was the lockout-shortened 2012-13 campaign, although his 52 points in 48 games only projected to 88 points (versus Kane's projected 96).
It should surprise no one that these are two very well paid players, with Kessel's cap hit for 2014-15 being $8M (8th highest among NHL forwards according to Capgeek) and Kane's being $6.3M (tied with teammate Jonathan Toews for 24th highest, according to the same source). But the key is Kane's deal expires after 2014-15, while Kessel's more freshly inked contract runs through 2021-22, which means that a year from now Kane's cap hit should be on a par with – if not higher than – Kessel's.
Ice Time
Kane had already produced an 88 point campaign before 2010-11 so I'd expect his Ice Time to be pretty constant. On the other hand, Kessel only managed a single 60 point season prior to 2010-11 and it wasn't until 2011-12 that he really took off, so it'll be interesting to see if increased Ice Time led to increased production for Kessel, or vice versa. Since both players have the same initials, I denoted Kessel as "(Phil)" and Kane as "(Pat)". Also, I didn't include SH Ice Time since neither had more than seven seconds per game in a season.
|
Season |
Total Ice Time per game (amount ahead of second highest forward) |
PP Ice Time per game (amount ahead of second highest forward) |
|
2013-14 |
20:39 (Phil) – 3rd 19:36 (Pat) – 2nd |
3:08 (Phil) – 1st (tie) 3:18 (Pat) – 1st |
|
2012-13 |
19:48 (Phil) – 2nd 20:03 (Pat) – 1st |
3:18 (Phil) – 1st 2:57 (Pat) – 2nd |
|
2011-12 |
20:03 (Phil) – 1st 20:11 (Pat) – 2nd |
3:20 (Phil) – 1st 3:27 (Pat) – 2nd |
|
2010-11 |
19:38 (Phil) – 1st 19:17 (Pat) – 4th |
3:45 (Phil) – 1st 3:14 (Pat) – 2nd |
Sure enough there pretty much weren't any surprises with Kane. Although he was first among Chicago forwards only once in overall Ice Time and also just once in PP Ice Time, that's largely due to Jonathan Toews seeing shorthanded duty in addition to him getting close to Kane's level of even strength and PP Ice Time and because Patrick Sharp generally averages a few seconds more of PP Ice Time than Kane over the course of a season.
Kane owners should be happy to see that his most productive season of 2012-13 actually coincided with only his second highest overall Ice Time and his lowest PP Ice Time. That suggests he can get Ice Time necessary to duplicate – if not exceed – those numbers, although we'll factor in below whether luck played any part in his production that season.
Kessel's numbers surprised me somewhat in that the "reward" for his 52 points in 48 games during 2012-13 was actually his lowest PP Ice Time of these four seasons in 2013-14, although his overall Ice Time was his highest of all four seasons. But the diminished PP Ice Time was enough to perhaps explain why he fell just short of point per game numbers in 2013-14. Of course we'll have to verify that by looking at his PP points rate, and his luck as well.
But in general, seeing this kind of Ice Time for both players is a big positive, since although they don't get 21:00+ minutes per game like some other stars, they still receive a consistent 20:00 or so, and all in the form of productive Ice Time (i.e., virtually no SH Ice TIme). Thus, it's not surprising to see that both players finished among the top 25 in points per 60 minutes of Ice Time for 2013-14, and I'd expect them to be top 25 fixtures for years to come.
Secondary Categories
|
Season |
PIMs (per game) |
Hits (per game) |
Blocked Shots (per game) |
Shots (per game) |
PP Points (per game) |
|
2013-14 |
0.33 (Phil) 0.32 (Pat) |
0.30 (Phil) 0.23 (Pat) |
0.36 (Phil) 0.21 (Pat) |
3.72 (Phil) 3.29 (Pat) |
0.24 (Phil) 0.36 (Pat) |
|
2012-13 |
0.37 (Phil) 0.17 (Pat) |
0.33 (Phil) 0.23 (Pat) |
0.48 (Phil) 0.19 (Pat) |
3.35 (Phil) 2.93 (Pat) |
0.43 (Phil) 0.36 (Pat) |
|
2011-12 |
0.24 (Phil) 0.48 (Pat) |
0.14 (Phil) 0.23 (Pat) |
0.25 (Phil) 0.33 (Pat)
📢 advertisement:
|
3.59 (Phil) 3.08 (Pat) |
0.28 (Phil) 0.14 (Pat) |
|
2010-11 |
0.29 (Phil) 0.38 (Pat) |
0.13 (Phil) 0.23 (Pat) |
0.27 (Phil) 0.23 (Pat) |
3.96 (Phil) 2.96 (Pat) |
0.28 (Phil) 0.33 (Pat) |
Sure enough, Kessel's PP Points rate for 2013-14 was the lowest of all four of these seasons. What's more, had it been on a par with just the 0.28 he averaged in 2010-11 and 2011-12, then that would've translated to three additional points, which in turn would've meant 83 points in 82 games and yet another point per game season for Kessel.
By far Kessel's highest PP Point output came during his 2012-13 season, which raises further concerns that he was unsustainably lucky. We'll see for sure in looking at luck-based metrics below.
Kane's PP Points have jumped around despite fairly consistent PP Ice Time. But at least his output for 2012-13 was matched in 2013-14, making it less likely to have been significantly influenced by non-recurring good luck.
Both players are excellent for Shots, although Kane has dipped below the three Shots per game level twice and only peaked at 3.29, while Kessel's lowest output for a season was 3.35 and in all three others he was between 3.59 and 3.96. Unfortunately, that's where the good news ends; the rest of their stats in these categories range from pretty bad to downright terrible, although with respect to Hits anyone who read one of my early Holding Court pieces would have already known that each is a genuine "Category Killer" in that area.
Luck-Based Metrics (five on five only, except for Personal Shooting Percentage)
This will be key data to analyze, as we'll want to focus on Kane's far more productive 2012-13 campaign, and also see if Kessel's two point per game seasons (2011-12, 2012-13) were accompanied by more luck than his others.
|
Season |
Personal Shooting Percentage |
Team Shooting Percentage |
PDO |
IPP |
|
2013-14 |
12.1% (Phil) 12.8% (Pat) |
10.30% (Phil) 8.84% (Pat) |
1019 (Phil) 1006 (Pat) |
79.4% (Phil) 77.4% (Pat) |
|
2012-13 |
12.4% (Phil) 16.7% (Pat) |
10.39% (Phil) 11.67% (Pat) |
1018 (Phil) 1020 (Pat) |
79.5% (Phil) 75.0% (Pat) |
|
2011-12 |
12.5% (Phil) 9.1% (Pat) |
9.65% (Phil) 9.85% (Pat) |
992 (Phil) 1002 (Pat) |
78.1% (Phil) 76.6% (Pat) |
|
2010-11 |
9.8% (Phil) 12.5% (Pat) |
7.68% (Phil) 9.69% (Pat) |
983 (Phil) 999 (Pat) |
78.7% (Phil) 78.3% (Pat) |
Both players have remarkably consistent IPP numbers, with Kane's ranging a mere 3.3% (and Kessel's an even lower 1.4%) from the highest to lowest over these four years. But inasmuch as Chicago finished better in total goals as a team than Toronto in each of these seasons (1st vs. 14th for 2013-14 (261 goals vs. 231), 2nd vs. 6th for 2012-13 (155 goals vs. 145), 7th vs. 10th for 2011-12 (248 goal vs. 231), 4th vs. 23rd for 2010-11 (258 goals vs. 218)), it would seem there's less room for Chicago to improve offensively as a team than Toronto.
Given that, if both players maintain similar Ice Times and continue their remarkably consistent IPP, then Kane's point output might not improve by much, if at all, while Kessel's could if Toronto begins to score more as a team. In other words, Kane's production would appear to have more of a team-based ceiling on it than Kessel's. Of course either team could get worse offensively too, which would not be good for either player if their IPP remains the same.
Kane's Personal Shooting % is very telling, as each time he surpassed his career average (now standing at 11.6%) for a season he ended up with a point per game average or better. And sure enough his best season – 55 points in 47 games for 2012-13 – came when his Personal Shooting % was 16.7%, which was nearly 50% higher than his career average. Had he shot only 11.6% that season, his goal total would've slipped to 16; and with that his points total would've dropped to 49 in 45 games, which projects to only an 89 point full season pace and is more consistent with his 2009-10 full season career high of 88.
What's more, although Kane's Team Shooting % and PDO numbers are reasonable overall for each season, they're considerably higher in 2012-13 than in the other three campaigns. Specifically, his PDO in three of these seasons ranged from 999 to 1006, but in 2012-13 it was 1020, while his Team Shooting % otherwise ranged from 8.84% to 9.85%, but jumped to 11.67% in 2012-13.
When these metrics are considered collectively, it becomes difficult to expect Kane to hit 90 points again in a full season unless he get unusually lucky, and any skilled poolie knows that planning for luck – good or bad – is not a recipe for success.
Kessel also had his best PDO and Team Shooting % numbers in his most productive season (2012-13, where he tallied 52 points in 48 games); however, unlike Kane his Personal Shooting % for that season was 12.4%, which was barely above his 11.1% career mark. Also, Kessel's 82 points in 82 games for 2011-12 came with all very reasonable luck-based metrics.
Overall, I think Kessel is a very good bet to return to point per game numbers, and might even have more room to see his point totals increase than Kane given these metrics and the possibility that the Maple Leaf offense as a whole could improve, increasing Kessel's points as that occurs.
Who Wins?
The good news is there's really no "loser" here, since if you own one of these guys you're not likely to be disappointed by their performance any time soon. But Cage Match is about deciding a winner, and in this case it's Kessel.
The reality is Kane's 2012-13 was simply a 47-game stretch where he was red hot thanks to what we saw above was unsustainable good luck. Simply put – when Kane plays a full season he hasn't shown he can top 88 points. In fact, if you look at his last three full seasons his collective average is only 0.93 points per game and he missed nine or more games in two of those seasons.
And guess what – Kessel already gives you that level of production, plus stays healthy (he's missed no games in the past four sesons). Plus, if Toronto improves offensively (which might not happen but is more likely than Chicago improving beyond its already lofty team totals), then Kessel's numbers should as well, particularly since his 88 point pace from 2012-13 did not appear to be as significantly influenced by good luck as Kane's 96 point pace that season.
Beyond those factors, Kane also fares worse in most Secondary Categories and also doesn't give you as many goals, which are at a premium in many leagues. And even for points only leagues, Kane likely will have too much of an elevated cost since those leagues don't factor in his shortcomings.
Lastly, Kane's edge in a cap leagues will likely vanish after this season, since you have to think he'll make close to if not more than what Kessel is paid once he signs a new deal. In the end, Kessel emerges victorious from this Cage Match.
| Jiri Hudler vs. Frans Nielsen | |||
| Jeff Carter vs. Patric Hornqvist | |||
| Chris Kunitz vs. Thomas Vanek |
Related Posts


UPCOMING GAMES
Starting Goalies
Top Skater Views
| Players | Team | |
|---|---|---|
| HENRY THRUN |
| |
| JEFF SKINNER |
| |
| JACKSON LACOMBE |
| |
| ISAAC HOWARD |
| |
| SETH JARVIS |
| |
Top Goalie Profile Views
LINE COMBOS
| Frequency |
| |
|---|---|---|
| 20.3 | COREY PERRY CONNOR MCDAVID LEON DRAISAITL | |
| 16.9 | RYAN NUGENT-HOPKINS KASPERI KAPANEN EVANDER KANE | |
| 13.7 | JEFF SKINNER ADAM HENRIQUE TRENT FREDERIC | |
DobberHockey Podcasts

Fantasy Hockey Life: Draftastic 3 – Q&A on the NHL Draft
Jesse asks Victor the questions you wanted answers to from the NHL Draft!

Keeping Karlsson: UFA Szzzn
Elan and Brian work their hardest to make the most of the NHL’s 2025 UFA signings and player movement, searching for the guys who may be the most likely to exceed expectations in new homes and situations.
Fantasy Hockey Life: Draftastic 2 – Q&A on the NHL Draft
Victor and Jesse are back in studio as Victor reports on his time at the NHL Draft and his outlook on fantasy rookie drafts. We discuss Michael Misa, Matthew Schaefer, Cole McKinney, Mason West, Milton Gastrin and Jacob Ihs-Wozniak with player audio. Victor also answers patron questions on which players you’ll want to target for […]
Fantasy Hockey Life: Draftastic 1 – NHL Draft Talk with Prospect Writers
Victor reports from the NHL Draft in Los Angeles.
Keeping Karlsson: Dobson is Free
On this edition of the Keeping Karlsson Fantasy Hockey Podcast, Elan and Brian ride the highway of National Hockey League offseason news, draft notes and transactions before the Free Agent Frenzy begins. All night long.