
Some highly rated prospects pan out; however, far more end up falling short of expectations, leaving a trail of disappointed poolies in their wake. Many of you were hoping for more/better by now from Sam Reinhart and Teuvo Teravainen, so the question becomes whether they’re simply taking a little longer to see their production jump significantly, or, instead, if they might be showing signs of not panning out long term. Let’s try to get to the bottom of this – Cage Match starts now!
Career Path and Contract Status
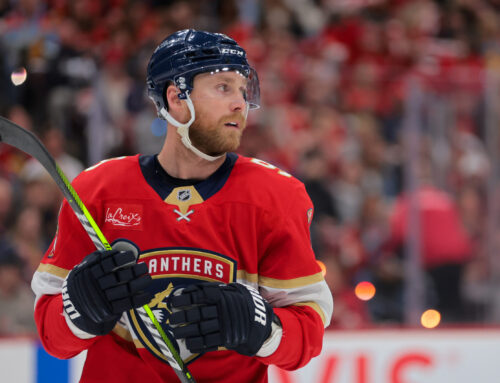
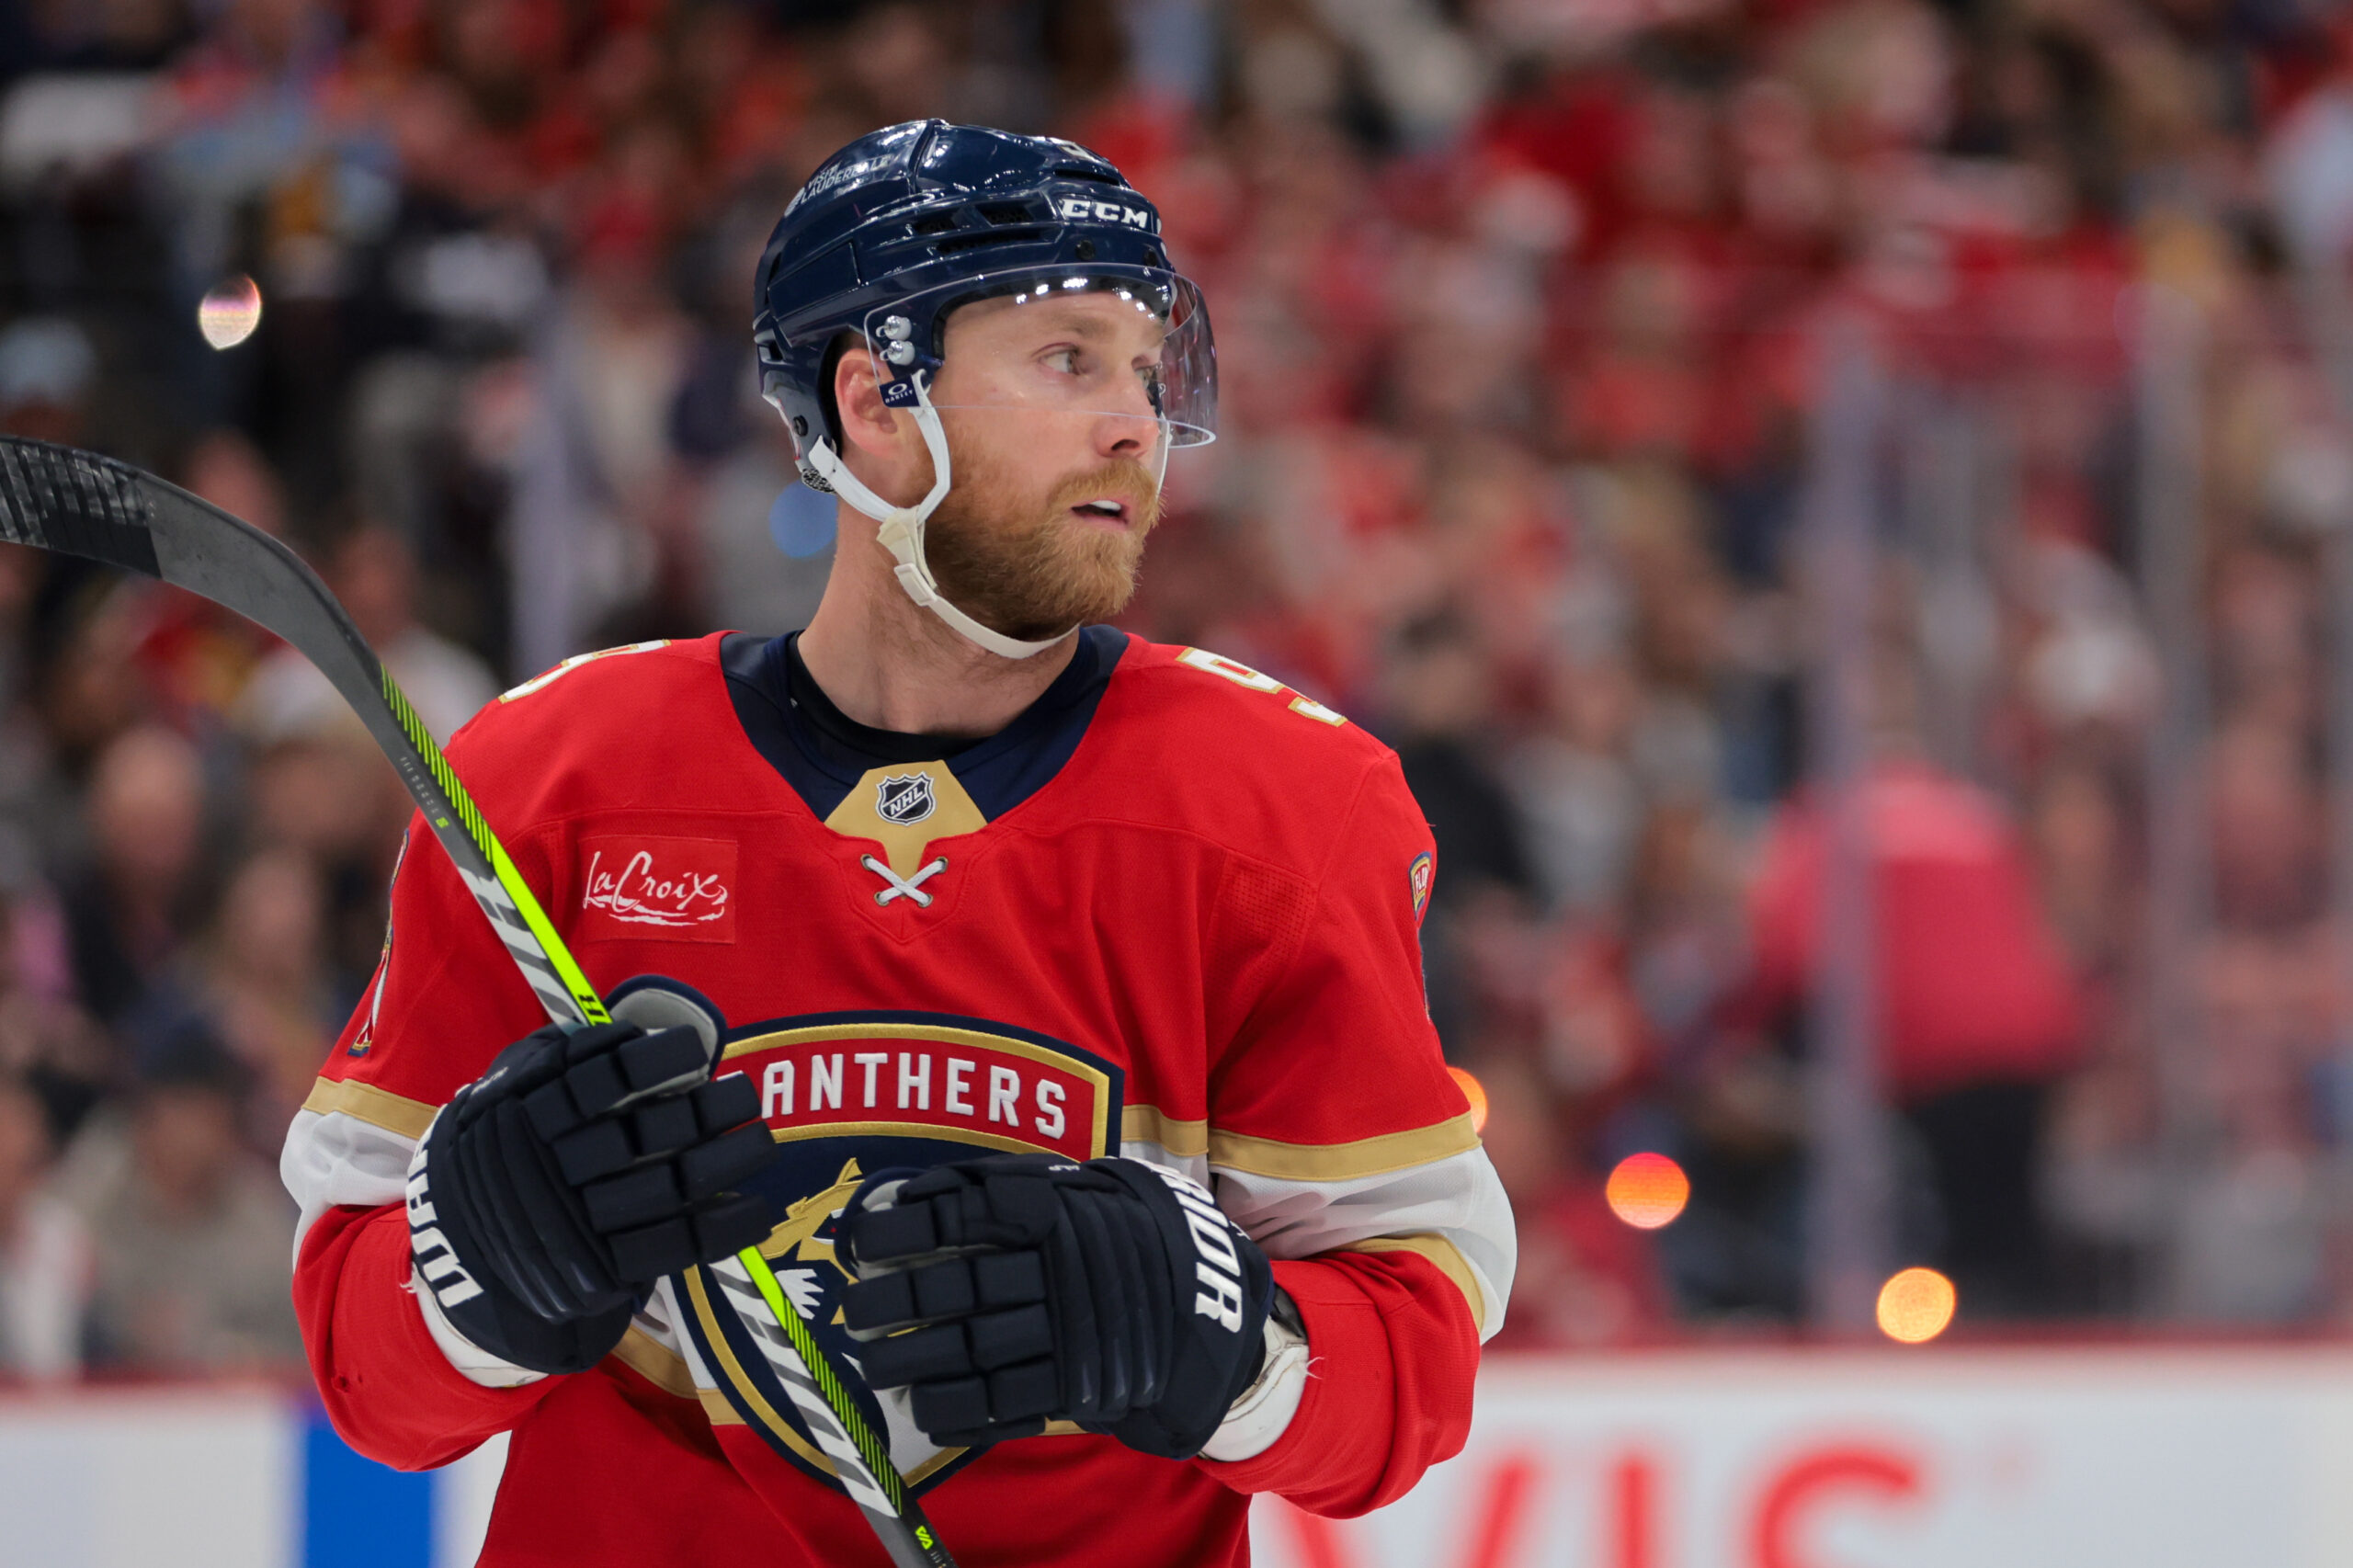
Reinhart, 21, was picked 2nd overall in 2014 after a stellar junior career that saw his points per game increase each season and culminated in him tying for 4th in WHL scoring in 2013-14. Whether due to trying to help the team tank or not wanting to burn a year of his ELC, Buffalo opted to give Reinhart only a nine-game NHL cameo in 2014-15; but he was with the team for the long haul in 2015-16, tallying 42 points. Expectations were high for Reinhart to improve significantly as a sophomore, yet when the dust settled he finished with only five more points (47) while seeing his goal total decrease by nearly 25%.
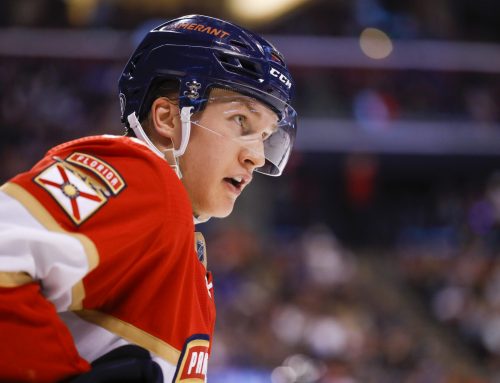
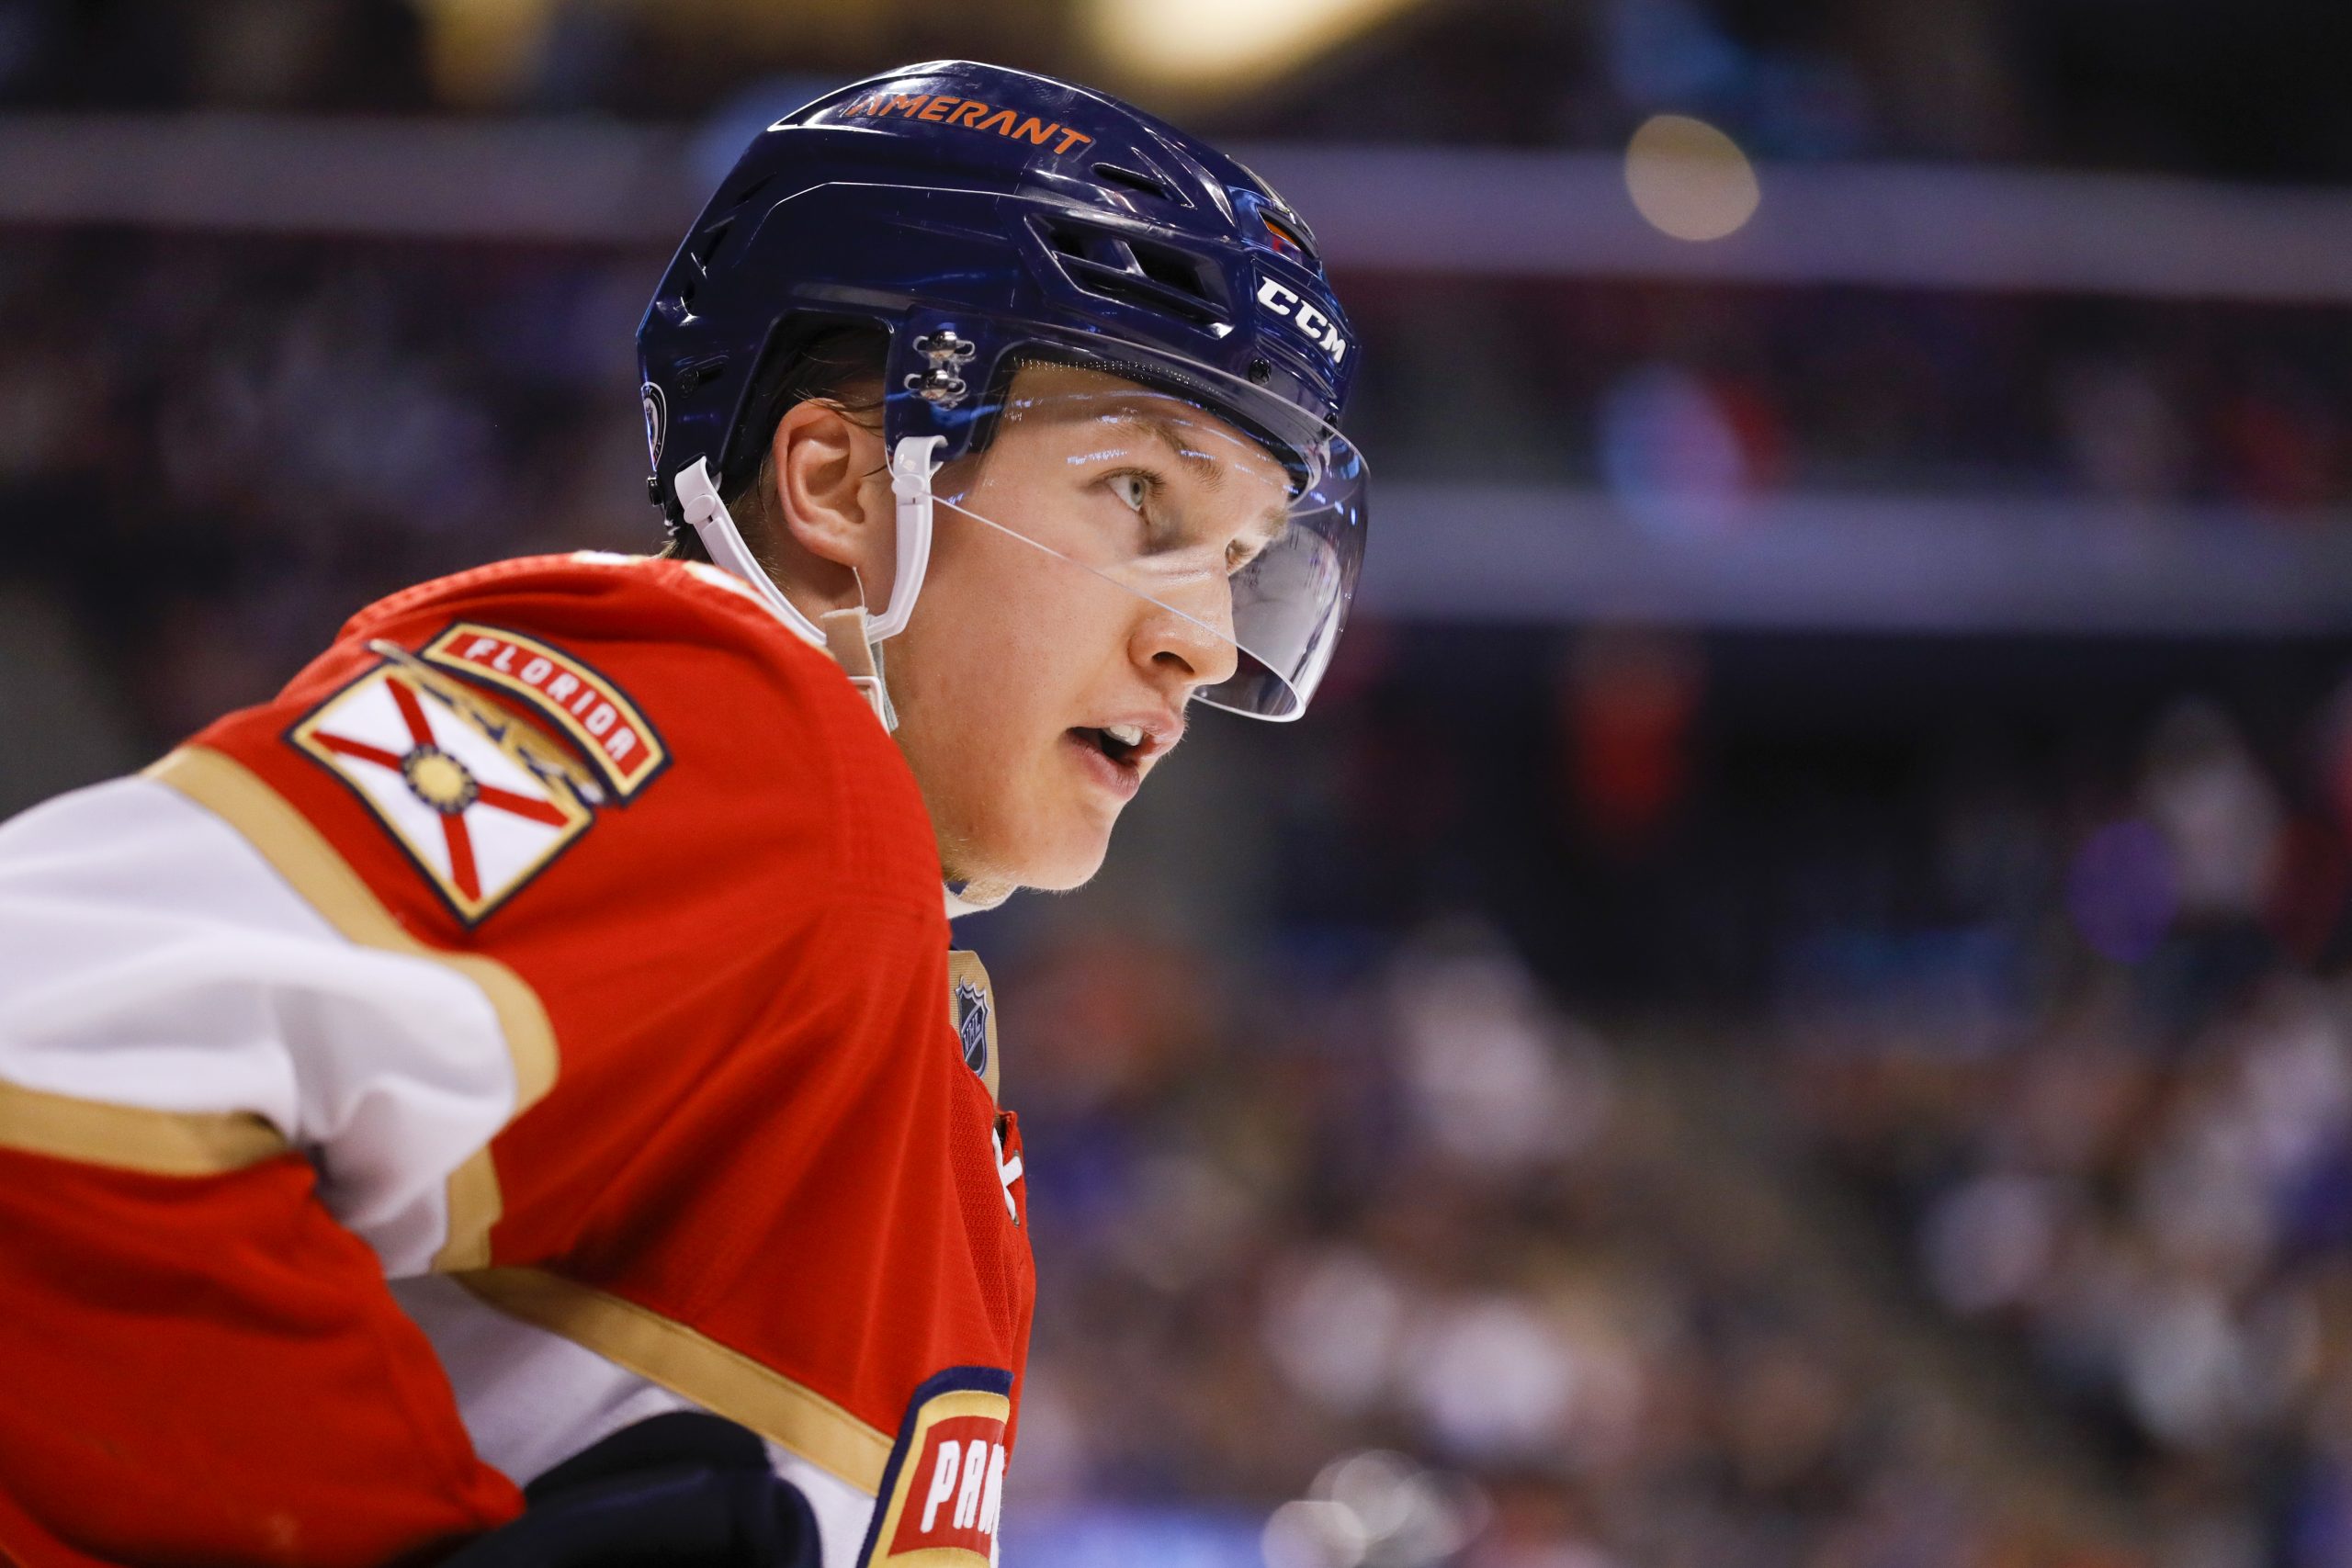
Teravainen, 22, was picked 18th overall by Chicago in 2012. He did well in Finland over the next two seasons (75 points in 93 games), but what grabbed the full attention of poolies was his performance at the WJCs in 2013 (11 points in six games) and 2014 (15 points in seven games). After that most figured he’d be on the fast track for NHL success, only that didn’t happen, as in 2014-15 he played five fewer NHL games than AHL contests (34 vs. 39) and managed only nine NHL points (versus 25 in the AHL). In 2015-16 he stuck with Chicago all season but only tallied 35 points in 78 contests, then was added to the summer 2016 deal to entice the Hurricanes to take Bryan Bickell in a salary dump. With Carolina, the hope was Teravainen would get a more pronounced role and see his production explode; but he only added seven points to finish at a modest 42.
Reinhart’s 2017-18 campaign will mark the last on his ELC, which counts a mere $0.894M against the cap. That cap hit was identical to Travainen’s ELC, which just ended, making him an RFA this summer.
Ice Time
|
Season |
Total Ice Time per game (rank among team’s forwards) |
PP Ice Time per game (rank among team’s forwards) |
SH Ice Time per game (rank among team’s forwards) |
|
2016-17 |
17:13 (S.R.) – 5th 16:14 (T.T.) – 6th |
2:55 (S.R.) – 3rd 2:14 (T.T.) – 3rd |
0:03 (S.R.) – 12th 0:00 (T.T.) |
|
2015-16 |
16:50 (S.R.) – 6th 15:20 (T.T.) – 7th |
2:56 (S.R.) – 3rd 1:45 (T.T.) – 8th |
0:01 (S.R.) – 12th 0:46 (T.T.) – 9th |
|
2014-15 |
12:47 (T.T.) – 12th |
0:45 (T.T.) – 9th |
0:01 (T.T.) – 12th (tied) |
Reinhart improved his points output by 12% despite his Ice Time data being virtually unchanged. There’s also room for his Total and PP Times increase further. On the other hand, he spent just under 50% of his 2016-17 shifts at 5×5 with Jack Eichel, compared to 30% in 2015-16, making his 12% year-to-year increase in points feel a bit low. Also, Reinhart managed just ten points in the 21 games Eichel missed, versus 37 in the 58 games both played, so at first glance it seems like he’s unable to score without being joined at the hip with Eichel.
But we must be careful not to dwell too much on those ten points in 21 games, since the team scored only 42 goals in those contests (i.e., two per game). In the other 61 games their average was 2.57 per game, for a more than 25% increase. Thus, it wasn’t a case of Reinhart doing poorly without Eichel – it was the whole team struggling.
One could argue this suggests Reinhart isn’t a player – at least not yet – who can carry a team. But who says he has to? Although he was drafted as a center, his game is not well suited for third line duty, so realistically that means he’ll either play wing with Eichel or with Ryan O’Reilly. And he makes both of them better, as Eichel’s goals per 60 minutes at 5×5 while he and Reinhart skated together at 5×5 was 2.41, compared to 2.22 when apart; and O’Reilly’s goals per 60 minutes at 5×5 was 3.20 when he and Reinhart shared the ice, versus 1.89 goals per 60 when apart.
Meanwhile, Teravainen’s failure to break out is easier to justify in seeing his minutes with Carolina weren’t much better than in his last campaign with Chicago; plus, those numbers leave even more room for further improvement than Reinhart’s. What’s also nice is Teravainen managed to shed all 46 seconds of SH Time he had in his final Blackhawks campaign, amounting to addition by subtraction. The problem is Teravainen finished 123rd in points per 60 minutes at 5×5 among 136 forwards who skated 1000+ minutes at 5×5 (for what it’s worth, Reinhart was slightly better at 99th). While that likely won’t cause Teravanen to be bumped out of the Carolina top six, it’s unclear whether he’ll be rewarded with more 5×5 Ice Time in 2017-18.
Also, where looks were somewhat deceiving – but in a good way – for Reinhart’s ten points in 21 games while Eichel was out, Teravainen’s PP Time ranking him third among team forwards is worse than it seems. Why is that? It turns out no fewer than eight Carolina forwards played 67+ games while averaging 1:57-2:16 in PP Time per game.
The fact that Carolina’s top forward in PP Time only received 2:16 per game is a significant departure from the norm, as every other NHL team but Minnesota and Toronto had at least one forward receiving 2:41+. And except for those teams (plus LA and Montreal), no other team’s forward who was third in PP Time received less than 2:30 per game. While Carolina’s PP philosophy means it’s unlikely Teravainen’s PP Time will drop, it also has a chance of acting as a ceiling which could effectively prevent Carolina forwards, including Teravainen, from racking up PPPts and in turn stifle their scoring.
Secondary Categories
|
Season |
PIMs (per game) |
Hits (per game) |
Blocked Shots (per game) |
Shots (per game) |
PP Points (per game) |
|
0.10 (S.R.) 0.19 (T.T.) |
0.26 (S.R.) 0.33 (T.T.) |
0.50 (S.R.) 0.40 (T.T.) |
2.24 (S.R.) 2.08 (T.T.) |
0.21 (S.R.) 0.17 (T.T.) |
|
|
2015-16 |
0.10 (S.R.)
📢 advertisement:
0.25 (T.T.) |
0.33 (S.R.) 0.31 (T.T.) |
0.33 (S.R.) 0.39 (T.T.) |
2.08 (S.R.) 1.74 (T.T.) |
0.14 (S.R.) 0.11 (T.T.) |
|
2014-15 |
0.06 (T.T.) |
0.32 (T.T.) |
0.41 (T.T.) |
1.94 (T.T.) |
0.00 (T.T.) |
These guys are dismal in leagues with a premium on physical categories like PIM, Hits, and Blocks, as neither has ever had outputs in those categories add up to even one per game. Beyond that, things are decent for two players who haven’t scored even 50 points in a season. In particular, their production in PPPts is high enough to keep their spots near the top of the PP hierarchy for their teams, yet not so high as to prevent further improvement. But as noted above, Teravainen’s spot might not be as important to retain as Reinhart’s, because Buffalo has more of a true PP1 (four players suited up for 60+ games and received 2:53 to 3:12 per game on the PP, but the next four received only 1:21 to 2:07 per game).
Both also saw gains in SOG consistent with their scoring increases and – along the lines of their Ice Time and PPPts – which leave room for still further improvement. After all, among 39 forwards who posted 50-55 points in 2016-17, 27 had more Ice Time than either player and 26 had 170+ SOG. The only area where either player did better than half the 50-55 point players was PPPts, as only 16 of the 39 posted more than Reinhart’s 17, while 26 had more than Teravainen’s 14.
Luck-Based Metrics
|
Season |
Personal Shooting Percentage |
Team Shooting % (5×5) |
IPP (5×5) |
IPP (5×4) |
Offensive Zone Starting % (5×5) |
|
2016-17 |
9.6% (S.R.) 8.9% (T.T.) |
6.98% (S.R.) 6.88% (T.T.) |
69.2% (S.R.) 59.5% (T.T.) |
41.0% (S.R.) 72.2% (T.T.) |
51.3% (S.R.) 58.8% (T.T.) |
|
2015-16 |
13.9% (S.R.) 9.6% (T.T.) |
7.01% (S.R.) 5.51% (T.T.) |
77.8% (S.R.) 76.9% (T.T.) |
35.5% (S.R.) 42.9% (T.T.) |
51.7% (S.R.) 43.6% (T.T.) |
|
2014-15 |
6.1% (T.T.) |
4.93% (T.T.) |
63.6% (T.T.) |
0.00% (T.T.) |
61.1% (T.T.) |
Not only is Reinhart’s drop in goals explained (by his Personal Shooting % falling), but we see him right at or above the all-important 70% mark for 5×5 IPP in both his seasons. Also, his 5×5 team shooting % and OZ% are both well lower than they could be, and should organically improve as Buffalo gets better as a team. In short, this suggests Reinhart not only could’ve already been a 50+ player in 2016-17 had it not been for some bad luck, but also if he continues to improve (along with the Sabres) and his luck evens out, 60+ points as soon as 2017-18 is viable.
Teravainen’s 2015-16 data shows he was hit hard with bad luck (5.51% team shooting % at 5×5) and unfavorable deployment (43.6% OZ%) yet made the best of it (76.9% IPP at 5×5). Unfortunately, there’s not as much to get excited about from 2016-17, with his 5×5 IPP being well lower than the 70%+ we’d want to see, his 5×4 IPP being higher than is likely sustainable, and his OZ% being more likely to go down than stay where it is or increase. Like Reinhart, there’s no question his team shooting % at 5×5 is very low; the difference is Reinhart’s consistently solid 5×5 IPPs. As a result, we can’t rule out that Teravainen is bringing down his linemates, rather than vice versa. It was one thing for him to have a high 5×5 IPP for Chicago when his linemates were Philip Danault and Andrew Desjardins, but troubling to see it drop considerably when skating with with better players (i.e., Sebastian Aho, Jordan Staal, Lee Stempniak) on Carolina. Overall, this data makes it more difficult to picture a big jump in scoring for Teravainen next season, and forms a cloudier long term picture for him than Reinhart.
Who Wins?
In view of the data and the teams both play for, I think it’s likely that Reinhart again scores 5+ more points than Teravainen in 2017-18, and, going even further, that Reinhart has a more prolific near and long term career. So Reinhart wins.
But the gap between them isn’t so wide as to negate the need to take cost vs value into account. In other words, the cost to obtain Reinhart – whether in a draft or via trade – could be so much higher than what it would be for Teravainen, that the result could tilt the scales toward Reinhart not being the right choice from a cost vs. value perspective. After all, let’s not forget how far Teravainen has fallen in the eyes of some poolies from his pre-NHL hype following his WJC splashes. It’s quite possible his owners might’ve soured on him to an extent that he’d be enough of a bargain – compared to Reinhart – to make him the choice over Reinhart.
In keepers, best to hold on both, whereas in deep one-year leagues Reinhart is worth a gamble once a lot of the 50-point players have been drafted. To my point above though, there’s a chance someone will reach for Reinhart too early, so just make sure that someone isn’t you, since although things could line up for him to post 55-60+ points as soon as next year, there’s as good a chance he lands closer to 50 points. Meanwhile, Teravainen is worth a late round flyer in deeper one year points only leagues in hopes he can put things together, and it’s likely there won’t be much interest in him so don’t be afraid to wait until the very end of drafts to pounce.
Related Posts


UPCOMING GAMES
Starting Goalies
Top Skater Views
Top Goalie Profile Views
LINE COMBOS
| Frequency |
| |
|---|---|---|
| 27.0 | JAMES VAN RIEMSDYK KENT JOHNSON ADAM FANTILLI | |
| 21.6 | SEAN MONAHAN KIRILL MARCHENKO BOONE JENNER | |
| 20.5 | DMITRI VORONKOV COLE SILLINGER MATHIEU OLIVIER | |
DobberHockey Podcasts

Fantasy Hockey Life: Draftastic 3 – Q&A on the NHL Draft
Jesse asks Victor the questions you wanted answers to from the NHL Draft!

Keeping Karlsson: UFA Szzzn
Elan and Brian work their hardest to make the most of the NHL’s 2025 UFA signings and player movement, searching for the guys who may be the most likely to exceed expectations in new homes and situations.
Fantasy Hockey Life: Draftastic 2 – Q&A on the NHL Draft
Victor and Jesse are back in studio as Victor reports on his time at the NHL Draft and his outlook on fantasy rookie drafts. We discuss Michael Misa, Matthew Schaefer, Cole McKinney, Mason West, Milton Gastrin and Jacob Ihs-Wozniak with player audio. Victor also answers patron questions on which players you’ll want to target for […]
Fantasy Hockey Life: Draftastic 1 – NHL Draft Talk with Prospect Writers
Victor reports from the NHL Draft in Los Angeles.
Keeping Karlsson: Dobson is Free
On this edition of the Keeping Karlsson Fantasy Hockey Podcast, Elan and Brian ride the highway of National Hockey League offseason news, draft notes and transactions before the Free Agent Frenzy begins. All night long.