Cage Match: Blake Wheeler vs. Artemi Panarin
Rick Roos
2018-06-27

Although right now poolies are laser focused on impending 2018 free agency, today’s battle is between two players who’ll be among the hottest commodities if they don’t re-sign before hitting the UFA market in 2019 – Blake Wheeler and Artemi Panarin. Last season Wheeler posted a career best in scoring at age 31, while Panarin emerged from the shadow of Patrick Kane to show in Columbus that he’s a fantasy force in his own right. Who should you own this season, and which of these two is poised to do better after they sign new deals? Cage Match is on the case!
Career Path and Contract Status
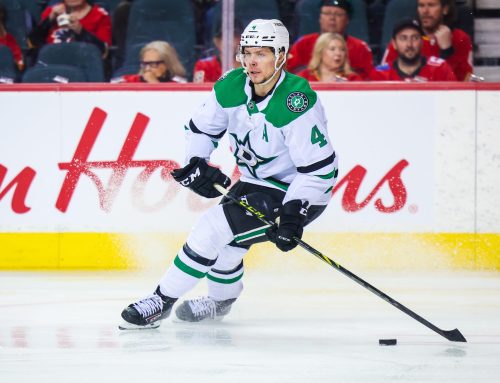
Wheeler, who’ll be 32 in August, was drafted fifth overall by Phoenix in 2004 but didn’t come to terms, leaving him a UFA. He signed with Boston in July 2008 but never hit his stride, tallying 110 points in 221 total games for not even a point per every other contest. The Bruins dealt him in February 2011, and he showed early signs of his success to come, with 17 points in 23 post-trade games. And he hasn’t looked back since then, first with three seasons of 61-69 points, then with 78 and 74 points, before exploding with 91 points last season.
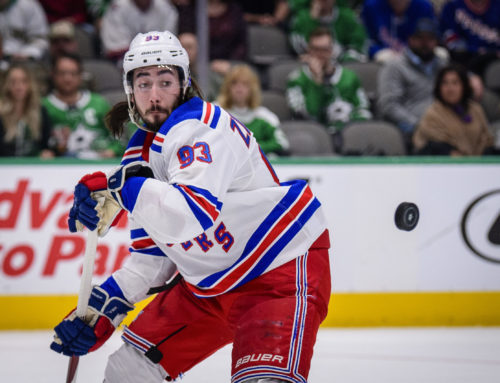
Panarin, 26, was undrafted and signed with Chicago after 62 points in 54 KHL games in 2014-15. To say he adapted right away to the NHL game would be a vast understatement, as upon being paired with Kane he put up 77 points as a rookie in 2015-16, then dipped only slightly to 74 in 2016-17. But the always cap-conscious Hawks dealt Panarin to Columbus to bring back Brandon Saad, who was both less expensive and two years further removed from UFA status. Saad’s return to Chicago was largely a flop, but Panarin proved he wasn’t being propped up by Kane, posting his first point-per-game season (82 points in 81 games).
As already noted, unless re-signed both players are set to be UFAs this time next season, with Wheeler counting $5.6M against the cap for 2018-19 versus Panarin’s barely higher $6M.
Ice Time
|
Season |
Total Ice Time per game (rank among team’s forwards) |
PP Ice Time per game (rank among team’s forwards) |
SH Ice Time per game (rank among team’s forwards) |
|
2017-18 |
20:15 (B.W.) – 2nd 20:08 (A.P.) – 1st |
3:09 (B.W.) – 1st 2:57 (A.P.) – 1st |
1:16 (B.W.) – 6th 0:01 (A.P.) – 15th (tied) |
|
2016-17 |
20:09 (B.W.) – 2nd 19:28 (A.P.) – 3rd |
2:57 (B.W.) – 2nd 3:09 (A.P.) – 2nd |
1:24 (B.W.) – 6th 0:02 (A.P.) – 11th |
|
2015-16 |
19:47 (B.W.) – 1st 18:31 (A.P.) – 3rd |
3:09 (B.W.) – 1st 2:50 (A.P.) – 2nd |
1:17 (B.W.) – 5th 0:01 (A.P.) – 16th (tied) |
|
2015-16 |
19:40 (B.W.) – 3rd |
3:15 (B.W.) – 1st |
1:44 (B.W.) – 6th |
There’s not much to say about Panarin’s data. His ice times as a rookie were low for someone who scored as much as he did, yet we can likely link that to his extraordinary chemistry with Kane. Plus, he had more ice time as a sophomore, with comparable scoring; and when he received over 20:00 this season he responded – in kind – with even better production. In all, seemingly very straightforward.
As for Wheeler, you’d be hard pressed to peg 2017-18 as a campaign not only where he tallied 91 points but also ended up with 15%+ added production as compared to his prior two seasons. There’s also the fact that among the 88 other instances of 90+ point scorers since 2000-01, Wheeler’s 1641 minutes ranked 59th overall, or a bit below average but not terribly low. Then again, most of those on the list weren’t also saddled with 1:16 per game of shorthanded duty like Wheeler; and his 1439 non-SH minutes would’ve put him third to last among the 89. Couple that with only nine players having been older than Wheeler’s 31 when they posted their 90+ points, and we’re left with serious doubts as to the sustainability of Wheeler as a 90+ point forward before we even look at other factors like SOG, PPPts, and luck.
Secondary Categories
|
Season |
PIMs (per game) |
Hits (per game) |
Blocked Shots (per game) |
Shots (per game) |
PP Points (per game) |
|
0.64 (B.W.) 0.32 (A.P.) |
1.16 (B.W.) 0.18 (A.P.) |
0.81 (B.W.) 0.23 (A.P.) |
3.03 (B.W.) 2.81 (A.P.) |
0.49 (B.W.) 0.26 (A.P.) |
|
|
2016-17 |
0.57 (B.W.) 0.25 (A.P.) |
1.22 (B.W.) 0.28 (A.P.) |
0.62 (B.W.) 0.17 (A.P.) |
3.16 (B.W.) 2.57 (A.P.) |
0.25 (B.W.) 0.20 (A.P.) |
|
2015-16 |
0.59 (B.W.) 0.40 (A.P.) |
1.12 (B.W.) 0.57 (A.P.) |
0.68 (B.W.)
📢 advertisement:
0.17 (A.P.) |
3.12 (B.W.) 2.33 (A.P.) |
0.20 (B.W.) 0.30 (A.P.) |
|
2014-15 |
0.92 (B.W.) |
1.62 (B.W.) |
0.68 (B.W.) |
3.09 (B.W.) |
0.15 (B.W.) |
For those who regularly read my column, you might be getting a sense of déjà vu to a recent battle between Johnny Gaudreau and Taylor Hall where, in the case of Hall and like Wheeler here, we had a player whose production spike was accompanied by a huge jump in PP scoring. In Wheeler’s case, he posted more PPPts last season alone than his two previous seasons combined and – like Hall – ended up with nearly a PPPt per every other game.
Just how high is the 40 PPPts that Wheeler posted? Only twice since 2011-12 has any forward tallied that many (Phil Kessel’s 42 this past season; Nicklas Backstrom’s 44 in 2013-14). Although Wheeler received a point on 61% of Winnipeg’s total PPGs (note – that’s the entire total, not just while he was on the ice), that percentage is in line with Kessel’s as well as Backstrom’s, plus some of the other forwards who tallied 40+ over the past 10+ seasons.
Yet in the case of Kessel, he went from 30 PPPts in 2016-17 to 42, versus the jump from 21 to 40 from Wheeler. Backstrom’s 44 is even less glaring since he’d posted 42 and 37 in earlier seasons. Wheeler has no such track record; however, as we saw above he did seemingly reinvent himself this season as a pass-first, set-up player; and sure enough 34 of his 40 PPPts came in the form of assists. Thus, while no one should expect Wheeler to equal – let alone top – his PP scoring from this past season, the fact that he’s locked into a top PP role and was able to score this well on the PP via his newfound pass-first approach signifies that he should be good for 30+ PPPts in 2018-19 and perhaps also future seasons.
Notwithstanding his growing assists total, Wheeler continued to shoot the puck at a similar rate as past seasons. Five other players since 2010-11 averaged 3+ SOG per game and had 65+ assists, yet only one, like Wheeler, was a winger, namely Martin St. Louis. And although they couldn’t be more different in stature, Wheeler might just be starting a later career trajectory similar to that of St. Louis, who hit 90+ points for the first time at age 28 and then did so three more times by age 36 as his goals dropped and assists spiked. And this was occurring, as is set to happen to Wheeler, while St. Louis was surrounded by younger and talented players and still firing roughly three shots on goal per game.
Lastly, I’d be remiss if I didn’t mention Wheeler’s multi-cat prowess, as he is the only NHLer in each of the past four seasons to post 20+ goals per season while averaging 1.1 Hits, 0.6 Blocks, and 3.0 SOG per game. In fact, only two others player met all the criteria two or more times (Patric Hornqvist – three; Jamie Benn – two). And considering Wheeler did this while seeing his scoring improve, it makes him among the most coveted multi-cat players in fantasy.
Meanwhile, Panarin has gone from being decent in hits to terrible; and this despite playing for John Tortorella. Clearly Torts has given Panarin a pass on that type of role; and although poolies would prefer a more well-rounded version of the Bread Man ala his rookie year, the fact that his points and SOG for 2017-18 marked career bests should be enough to look past his woeful hits and blocks, which grow on trees more than point-per-game scorers. Also, his PPPt total for 2017-18, although solid, wasn’t a career high and has realistic room to improve, especially given that during his astounding 35 points in his last 22 games he amassed eight of his 21 PPPts all while his SOG rate was actually lower than his season-long average. Thus, in all, and without factoring in luck, it appears Panarin should be valued even higher than his point per game numbers, which reflect his slow initial adjustment to playing in Columbus.
Luck-Based Metrics
|
Season |
Personal Shooting % |
Team Shooting % (5×5) |
Individual Points % (IPP) |
Offensive Zone Starting % (5×5) |
Average Shot Distance |
Secondary Assists % |
|
2017-18 |
9.3% (B.W.) 11.8% (A.P.) |
8.75% (B.W.) 7.55% (A.P.) |
78.4% (B.W.) 79.6% (A.P.) |
56.8% (B.W.) 75.3% (A.P.) |
35.2 (B.W.) 32.5 (A.P.) |
29% (B.W.) 36% (A.P.) |
|
2016-17 |
10.0% (B.W.) 14.7% (A.P.) |
8.15% (B.W.) 10.13% (A.P.) |
71.8% (B.W.) 69.2% (A.P.) |
52.5% (B.W.) 80.5% (A.P.) |
31.9 (B.W.) 30.3 (A.P.) |
31% (B.W.) 37% (A.P.) |
|
2015-16 |
10.2% (B.W.) 16.0% (A.P.) |
9.26% (B.W.) 9.22% (A.P.) |
75.7% (B.W.) 72.0% (A.P.) |
53.3% (B.W.) 63.8% (A.P.) |
28.8 (B.W.) 28.1 (A.P.) |
29% (B.W.) 38% (A.P.) |
|
2014-15 |
10.7% (B.W.) |
8.62% (B.W.) |
64.2% (B.W.) |
51.5% (B.W.) |
28.8 (B.W.) |
31% (B.W.) |
Wheeler not only had the most primary assists in the NHL over the past three seasons, but his 118 were almost 10% more than second place and translated to nearly one per every other game, which is an amazing marker of skill and playmaking ability. I’d also argue it means although he’s set to turn 32 this summer he’s in no danger of losing his scoring touch any time soon. Of course, between that and his increasing ASD and dropping personal shooting percentage, it’s looking more and more that he won’t ever be a 30-goal scorer and could even end up below 25 for most if not all of his remaining seasons.
Panarin’s data puts big smiles on the faces of his owners. Before 2017-18 all poolies had to go on was two seasons of elevated personal shooting percentage, sky high 5×5 team shooting percentage and OZ%, all to go along with not particularly elite IPP numbers. His 2017-18 answered skeptics, in a big way. Although his OZ% was still high, it no longer was stratospheric; and his team shooting percentage fell below the 9.0% normally associated with scoring forwards in general while his IPP rose to an elite 80%. All this goes a long way to proving not only that Panarin’s 2017-18 output was legit, but it might not be the best we end up seeing from him, since given his deployment as a top offensive option his 5×5 team shooting percentage has more room to grow than his OZ% and IPP have to shrink, if they drop at all. Plus, as noted above he finished with 35 points in his final 22 2017-18 contests, which represents positive momentum that could very well carry into 2018-19.
Who Wins?
This is another match where this is no loser – not among the players nor the poolies fortunate to own either or, even better, both. Determining the winner depends mainly on the value one places on Panarin’s 35 points in his final 22 games. If one sees that as balancing out his early struggles but not representative of sustainable scoring, then for 2018-19 he should once again be a roughly point-per-game player. But if instead you see that stretch as him coming into his own as a star, rather than playing in a star’s shadow as he did while in Chicago, then a 90+ point season for 2018-19 and beyond is possible to even likely.
Where do I fall on the spectrum of opinion? Count me as one who thinks the Panarin we witnessed in the fourth quarter was a more so sign of things to come. As such, I see him being a good bet for 85-90+ points in 2018-19 and beyond. That means he wins the match, since as great as Wheeler is and as apt as the comparisons to St. Louis – and his three 90+ point seasons after age 31 – are, the truth is Wheeler’s PPPts were too high to be sustainable and therefore leave him as merely an 80-85 point player, which for this match puts him at the slightly shorter end of the stick.
I foresee Wheeler re-upping with Winnipeg but Panarin being a candidate to land elsewhere as a UFA, especially amid recent trade rumors. Either way, I think both should still shine on any team, although Wheeler could take a bit of a hit if somehow he was to change teams since most other squads on which he could land are not as potent as the Jets, whereas if Panarin could score that well in Columbus chances are he could do the same – if not better – elsewhere.
Related Posts
UPCOMING GAMES
Starting Goalies
Top Skater Views
| Players | Team | |
|---|---|---|
| TRAVIS KONECNY |
| |
| MARCO ROSSI |
| |
| NILS HOGLANDER |
| |
| JJ PETERKA |
| |
| AARON EKBLAD |
| |
Top Goalie Profile Views
LINE COMBOS
| Frequency |
| |
|---|---|---|
| 19.3 | JACK QUINN DYLAN COZENS ZACH BENSON | |
| 12.4 | VICTOR OLOFSSON TYSON JOST ZEMGUS GIRGENSONS | |
| 11.3 | ALEX TUCH JJ PETERKA JORDAN GREENWAY | |
DobberHockey Podcasts

Fantasy Hockey Life: Florida Panthers with Colby Guy
Colby Guy joins the show to talk about the Cup champs. We discuss Sam Reinhart, Matthew Tkachuk, Aleksander Barkov, Sam Bennett, Evan Rodrigues, Anton Lundell, Mackie Samoskevich, Aaron Ekblad, Gustav Forsling, Nate Schmidt, Adam Boqvist, Sergei Bobrovsky and Spencer Knight. In-Goal Magazine’s Cat Silverman joins in our Cat’s Instincts segment to discuss Spencer Knight and […]
Fantasy Hockey Life: Boston Bruins with Fluto Shinzawa
Fluto Shinzawa of The Athletic joins Victor and Jesse to talk Boston Bruins. They discuss David Pastrnak, Elias Lindholm, Brad Marchand, Charlie Coyle, Pavel Zacha, Morgan Geekie, Matthew Poitras, Charlie McAvoy, Hampus Lindholm, Jeremy Swayman, and Joonas Korpisalo. In-Goal Magazine’s Cat Silverman joins in our Cat’s Instincts segment to discuss Brandon Bussi and Michael DiPietro. […]
Fantasy Hockey Life: Brian Hedger on the Columbus Blue Jackets
Brian Hedger of the Columbus Dispatch joins the show to look forward to next year’s Blue Jackets.
Fantasy Hockey Life: Nashville Predators with Bryan Bastin
Bryan Bastin of On the Forecheck joins Victor and Jesse to talk Nashville Predators. They discuss pros Filip Forsberg, Gustav Nyquist, Ryan O’Reilly, Tommy Novak, Luke Evangelista, Philip Tomasino, Cody Glass, Roman Josi, Alexandre Carrier, Juuse Saros, Kevin Lankinen, Yaroslav Askarov, Steven Stamkos, Jonathan Marchessault and Brady Skjei. In-Goal Magazine’s Cat Silverman joins in our […]
Fantasy Hockey Life: Toronto Maple Leafs with Cindy Caron
The Toronto Maple Leafs made it to a Game 7 overtime but were frustrated again in the playoffs. Recorded pre-free agency, Cindy Caron of I-Express.ca joins Victor and Jesse to go over the pro roster: Auston Matthews, Mitch Marner, William Nylander, John Tavares, Max Domi, Tyler Bertuzzi, Matthew Knies, Bobby McMann, Morgan Rielly, Timothy Liljegren, […]