Is the Sophomore Slump for Defensemen for Real?
Rick Roos
2018-09-26

Although there are no hard and fast rules when it comes to fantasy hockey, some recurring outcomes or tendencies can – and should – form at least part of the basis for evaluating players you might draft or those already on your teams.
Dobberites are familiar with the “fourth year rule,” where past data has suggested that a player is more likely to break out in his fourth full season at the NHL level versus his second, third, fifth etc. There’s also the so-called “rookie wall,” where a first-year player not used to the rigors of an 82-game campaign will often see his stats drop in the second half of his debut season.
Another observation which has received considerable fantasy attention/speculation of late is the defenseman sophomore slump, which supposedly suggests that rearguards who are productive as rookies tend to do worse in their second (i.e., sophomore) season. But is the defenseman sophomore slump for real? If so, are there common traits shared by those most negatively or non-negatively affected which would allow us to better predict who might be most vulnerable to sophomore slumping? These are questions I’m tackling this week in a special Cage Match.
Definitions and Line Drawing
Before we gather and dissect data, we first must decide (1) how we define a rookie defenseman, (2) how many points a rookie defenseman must score in order to be a candidate for a sophomore slump, and (3) how far back to go in examining data.
I think we should look at only d-men who were true rookies in their first season, meaning they could not have previously played in any regular season games. My reasoning is any regular season action provides invaluable experience which makes someone perform differently both as a rookie and sophomore than someone who’d never taken the regular season ice before his rookie campaign.
Additionally, I excluded anyone over age 26 in his first season, since they don’t qualify as NHL rookies. Beyond that, I omitted those who were rookies in 2003-04 because that meant they would’ve been two years older for their second season due to cancellation of the 2004-05 campaign. Similarly, I excluded anyone who was a rookie or sophomore in 2012-13 due to that season only having a total of 48 games.
I debated what to do about d-men who, for whatever reason, didn’t play 60+ games as a sophomore, since I didn’t want that to possibly throw off the data. Ultimately I decided to keep in those players since injuries or scratches are part of the game. But I did eliminate one player (Erik Johnson) who would’ve otherwise qualified but missed his entire second season due to injury.
In terms of a points threshold and range of years, I went about things backwards by first deciding how many defensemen I wanted to analyze. I figured a number less than 20 would provide too few data points, but anything more than 30 would make it too difficult for me to crunch numbers. With that in mind, I settled upon rookie defensemen who played from 1997-98 onward and posted 29+ points in their first year, since that yielded a total of 24 qualifiers.
Why go back to 1997-98, rather than more or fewer years? Two reasons – the early to mid-90s was a much higher scoring era that is not as ripe for comparison to today, plus 1997-98 was the first season that nhl.com tracked ice time data, which I think that is a useful component for analysis. And although drawing the line at 29+ points might be a bit low for shallow fantasy leagues, that’s still enough of an output to place a rookie d-man on most everyone’s fantasy radar.
Summary of Rookie Season Data
Five of the 24 were rookies from 1997-98 through 2001-02, while 11 played their first season between 2005-06 and 2011-12 and the remaining eight had their first season between 2010-11 and 2016-17. The age breakdown of the 24 during their rookie campaign was as follows: 18 years old (one), age 19 (six), 20 (six), 21 (two), 22 (four), 23 (two) 24 (one), 25 (one), and 26 (one).
Among the 24, the highest rookie point total was 49 (Dion Phaneuf in 2005-06). Only five others posted 40+ as a rookie, while among the remaining 18 there were nine who landed at 36-39 (none had exactly 35) and nine with 29-34. Eleven had a double-digit goal total as a rookie, yet only five averaged 2+ SOG per game in their first campaign. Power-play scoring was widely varied, from a low of three to a high of 33; but only six accumulated below ten power-play points, with an equal number tallying 20+ and the overall average number of rookie power-play points being 14.7.
In terms of rookie ice time, 14 averaged at least 20:00 per game, and only three averaged less than 2:00 per contest with the man advantage. Shorthanded duty was widely varied, with slightly more first-year d-men logging 2:00+ per game (a total of ten) versus those who saw less than 0:30 of penalty-killing duty per game (a total of eight). But as rookies, only four of the 24 saw less ice time per game with the man advantage than while shorthanded.
As far as their teams, the most goals scored by one of the squads in a player’s rookie season was 314 (2005-06 Senators), with the next highest being way down at 266 (2013-14 Ducks). The lowest total was 211 (2005-06 Blackhawks), with only four other teams being under 220.
Year-to-Year Comparisons
What follows are the relevant individual and team statistics for each of the 24 players as a rookie, and then in his second season. These will be in reverse chronological order, with the most recent qualifying rookies and sophomores listed first. Note that when I refer to a gain or drop in production (in bold after each table) it is based on an 82-game scoring pace for each season.
Zach Werenski (rookie in 2016-17 for Columbus)
|
|
Age |
Games |
Goals |
Assists |
PPPts |
SOG per game |
Team Goals |
TOI per game |
PPTOI per game |
SH TOI per game |
|
Rookie |
19 |
78 |
11 |
36 |
21 |
2.41 |
251 |
20:54 |
2:47 |
0:45 |
|
Second Season |
20 |
77 |
16 |
21 |
10 |
2.68 |
242 |
22:34 |
2:25 |
0:45 |
Result = drop in production of 10 points
Ivan Provorov (rookie in 2016-17 for Philadelphia)
|
|
Age |
Games |
Goals |
Assists |
PPPts |
SOG per game |
Team Goals |
TOI per game |
PPTOI per game |
SH TOI per game |
|
Rookie |
20 |
82 |
6 |
24 |
5 |
1.96 |
219 |
21:58 |
1:41 |
2:49 |
|
Second Season |
21 |
82 |
17 |
21 |
5 |
2.47 |
251 |
24:09 |
1:46 |
2:34 |
Result = gain in production of 8 points
Nikita Zaitsev (rookie in 2016-17 for Toronto)
|
|
Age |
Games |
Goals |
Assists |
PPPts |
SOG per game |
Team Goals |
TOI per game |
PPTOI per game |
SH TOI per game |
|
Rookie |
25 |
82 |
4 |
32 |
12 |
1.29 |
251 |
22:01 |
2:00 |
1:43 |
|
Second Season |
26 |
60 |
5 |
8 |
0 |
0.90 |
277 |
22:13 |
0:14 |
2:56 |
Result = drop in production of 19 points
Colton Parayko (rookie in 2015-16 for St. Louis)
|
|
Age |
Games |
Goals |
Assists |
PPPts |
SOG per game |
Team Goals |
TOI per game |
PPTOI per game |
SH TOI per game |
|
Rookie |
22 |
79 |
9 |
24 |
7 |
2.08 |
224 |
19:23 |
1:37 |
0:58 |
|
Second Season |
23 |
81 |
4 |
31 |
10 |
2.32 |
236 |
21:11 |
1:45 |
2:06 |
Result = gain in production of 3 points
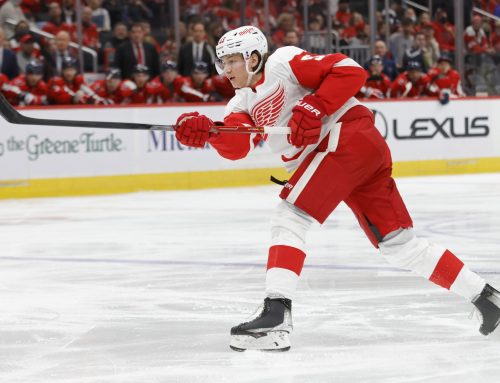
Aaron Ekblad (rookie in 2014-15 for Florida)
|
|
Age |
Games |
Goals |
Assists |
PPPts |
SOG per game |
Team Goals |
TOI per game |
PPTOI per game |
SH TOI per game |
|
Rookie |
18 |
81 |
12 |
27 |
13 |
2.10 |
239 |
21:48 |
2:48 |
0:25 |
|
Second Season |
19 |
78 |
15 |
21 |
9 |
2.33 |
210 |
21:40 |
2:50 |
0:44 |
Result = drop in production by 1 points
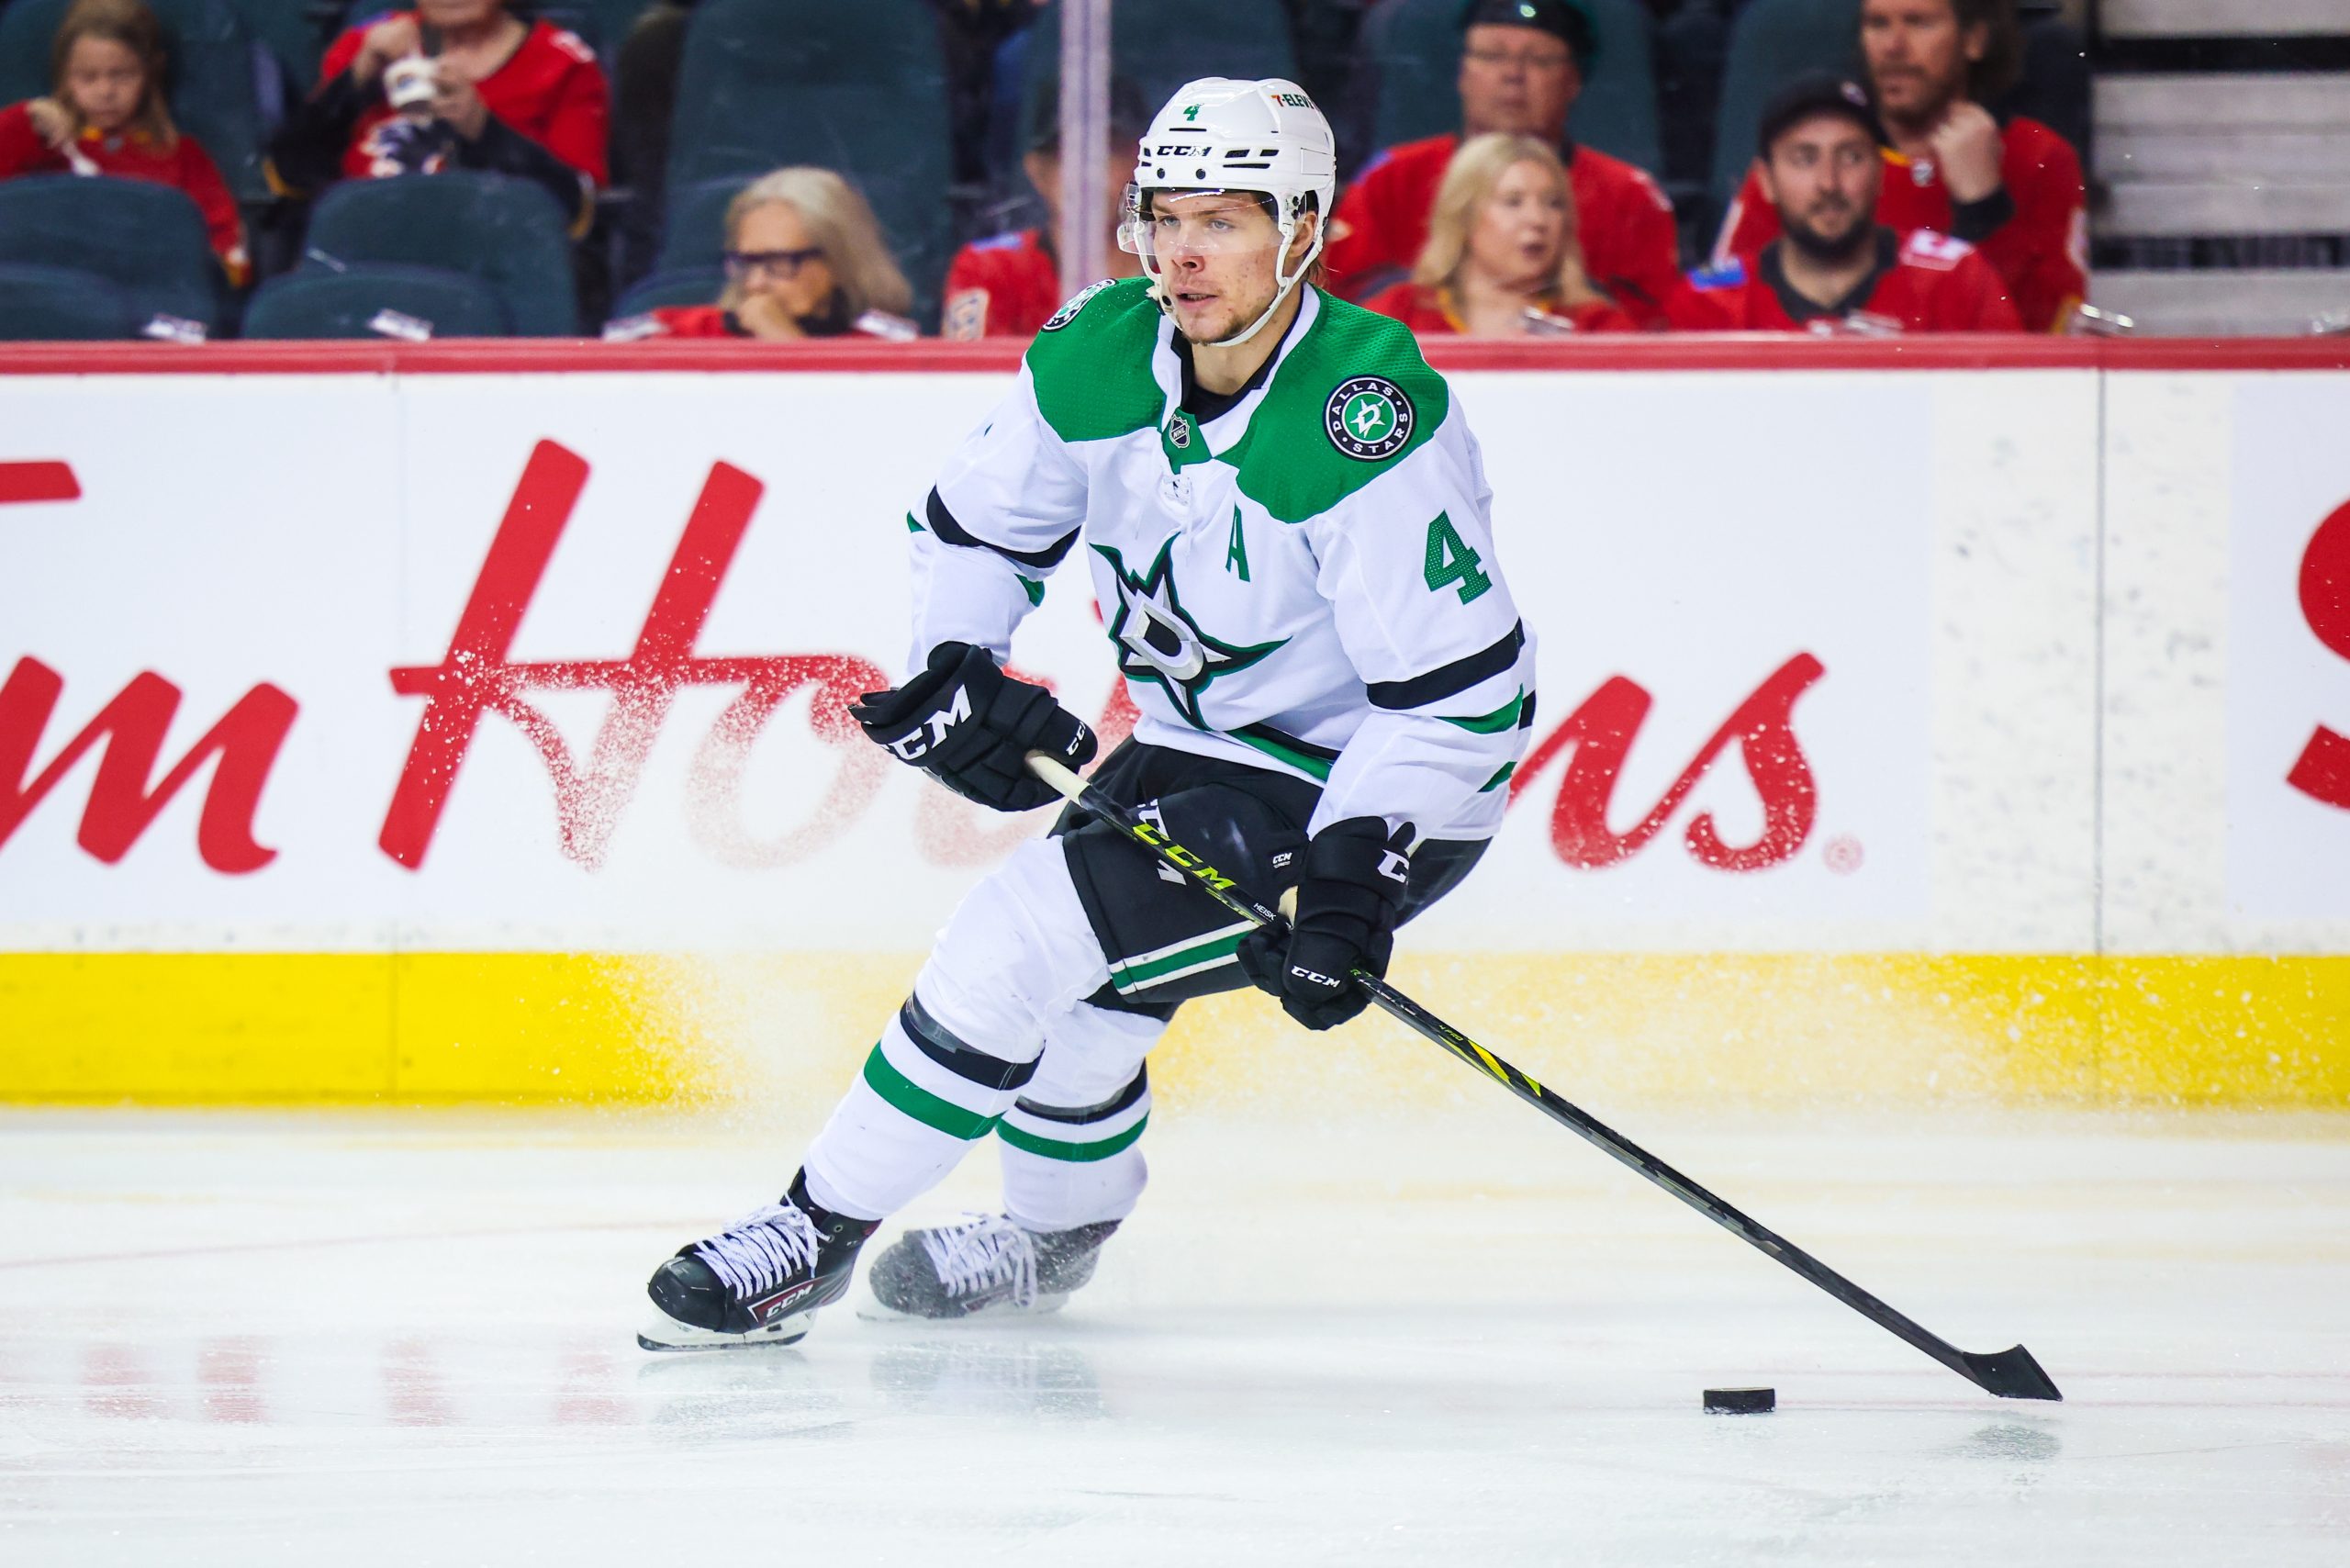
John Klingberg (rookie in 2014-15 for Dallas)
|
|
Age |
Games |
Goals |
Assists |
PPPts |
SOG per game |
Team Goals |
TOI per game |
PPTOI per game |
SH TOI per game |
|
Rookie |
22 |
65 |
11 |
29 |
12 |
1.50 |
261 |
21:50 |
2:56 |
0:09 |
|
Second Season |
23 |
76 |
10 |
48 |
22 |
2.25 |
267 |
22:41 |
3:11 |
0:05 |
Result = gain in production by 12 points
Jacob Trouba (rookie in 2013-14 for Winnipeg)
|
|
Age |
Games |
Goals |
Assists |
PPPts |
SOG per game |
Team Goals |
TOI per game |
PPTOI per game |
SH TOI per game |
|
Rookie |
19 |
65 |
10 |
19 |
3 |
1.86 |
227 |
22:26 |
1:58 |
2:55 |
|
Second Season |
20 |
65 |
7 |
15 |
6 |
2.04 |
230 |
23:18 |
1:56 |
3:21 |
Result = drop in production by 9 points
Hampus Lindholm (rookie in 2013-14 for Anaheim)
|
|
Age |
Games |
Goals |
Assists |
PPPts |
SOG per game |
Team Goals |
TOI per game |
PPTOI per game |
SH TOI per game |
|
Rookie |
20 |
78 |
6 |
24 |
4 |
1.48 |
266 |
19:25 |
2:05 |
0:24 |
|
Second Season |
21 |
78 |
7 |
27 |
6 |
1.37 |
236 |
21:45 |
1:37 |
1:57 |
Result = gain in production of 4 points
Cam Fowler (rookie in 2010-11 for Anaheim)
|
|
Age |
Games |
Goals |
Assists |
PPPts |
SOG |
Team Goals |
TOI per game |
PPTOI per game |
SH TOI per game |
|
Rookie |
19 |
76 |
10 |
30 |
23 |
1.62 |
239 |
22:07 |
3:37 |
0:22 |
|
Second Season |
20 |
82 |
5 |
24 |
11 |
1.50 |
204 |
23:15 |
3:40 |
0:42 |
Result = drop in production by 14 points
Kevin Shattenkirk (rookie in 2010-11 for Colorado and St. Louis)
|
|
Age |
Games |
Goals |
Assists |
PPPts |
SOG per game |
Team Goals |
TOI per game |
PPTOI per game |
SH TOI per game |
|
Rookie Season (with Avs) |
22 |
46 |
7 |
19 |
10 |
1.45 |
227 |
19:50 |
3:05 |
0:17 |
|
Rookie Season (with Blues) |
22 |
26 |
2 |
15 |
5 |
1.57 |
240 |
19:50 |
2:42 |
0:36 |
|
Second Season |
23 |
81 |
9 |
34 |
18 |
2.19 |
210 |
21:36 |
2:51 |
1:55 |
Result = drop in production by 6 points
Tyler Myers (rookie in 2009-10 with Buffalo)
|
|
Age |
Games |
Goals |
Assists |
PPPts |
SOG per game |
Team Goals |
TOI per game |
PPTOI per game |
SH TOI per game |
|
Rookie |
19 |
80 |
11 |
37 |
16 |
1.30 |
235 |
23:44 |
2:58 |
3:04 |
|
Second Season |
20 |
80 |
10 |
27 |
14 |
1.52 |
245 |
22:27 |
2:47 |
2:41 |
Result = drop in production by 11 points
Michael Del Zotto (rookie in 2009-10 with Rangers)
|
|
Age |
Games |
Goals |
Assists |
PPPts |
SOG per game |
Team Goals |
TOI per game |
PPTOI per game |
SH TOI per game |
|
Rookie |
19 |
80 |
9 |
28 |
22 |
1.01 |
222 |
18:58 |
3:49 |
0:28 |
|
Second Season |
20 |
47 |
2 |
9 |
7 |
1.18 |
233 |
19:29 |
3:45 |
0:31
📢 advertisement:
|
Result = drop in production by 19 points
Toby Enstrom (rookie in 2007-08 with Atlanta, i.e., Winnipeg)
|
|
Age |
Games |
Goals |
Assists |
PPPts |
SOG per game |
Team Goals |
TOI per game |
PPTOI per game |
SH TOI per game |
|
Rookie |
23 |
82 |
5 |
33 |
26 |
1.28 |
216 |
24:28 |
5:44 |
3:07 |
|
Second Season |
24 |
82 |
5 |
27 |
14 |
1.04 |
257 |
23:31 |
3:18 |
3:23 |
Result = drop in production by 6 points
Dion Phaneuf (rookie in 2005-06 with Calgary)
|
|
Age |
Games |
Goals |
Assists |
PPPts |
SOG per game |
Team Goals |
TOI per game |
PPTOI per game |
SH TOI per game |
|
Rookie |
20 |
82 |
20 |
29 |
33 |
2.95 |
218 |
21:43 |
5:19 |
2:12 |
|
Second Season |
21 |
79 |
17 |
33 |
31 |
2.91 |
258 |
25:39 |
5:34 |
1:58 |
Result = gain in production of 3 points
Andrej Meszaros (rookie in 2005-06 with Ottawa)
|
|
Age |
Games |
Goals |
Assists |
PPPts |
SOG per game |
Team Goals |
TOI per game |
PPTOI per game |
SH TOI per game |
|
Rookie |
20 |
82 |
10 |
29 |
24 |
1.67 |
314 |
18:10 |
2:40 |
2:20 |
|
Second Season |
21 |
82 |
7 |
28 |
10 |
1.79 |
288 |
21:40 |
3:42 |
2:32 |
Result = drop in production by 4 points
Chris Campoli (rookie in 2005-06 with New York Islanders)
|
|
Age |
Games |
Goals |
Assists |
PPPts |
SOG per game |
Team Goals |
TOI per game |
PPTOI per game |
SH TOI per game |
|
Rookie |
21 |
80 |
9 |
25 |
13 |
1.53 |
230 |
18:32 |
3:20 |
1:46 |
|
Second Season |
22 |
51 |
1 |
13 |
4 |
0.80 |
248 |
14:49 |
1:58 |
0:36 |
Result = drop in production by 13 points
Keith Ballard (rookie in 2005-06 with Phoenix, i.e., Arizona)
|
|
Age |
Games |
Goals |
Assists |
PPPts |
SOG per game |
Team Goals |
TOI per game |
PPTOI per game |
SH TOI per game |
|
Rookie |
23 |
82 |
8 |
31 |
16 |
1.24 |
246 |
19:58 |
2:37 |
3:23 |
|
Second Season |
24 |
69 |
5 |
22 |
11 |
1.14 |
216 |
21:59 |
2:01 |
3:44 |
Result = drop in production by 7 points
Ryan Whitney (rookie in 2005-06 with Pittsburgh)
|
|
Age |
Games |
Goals |
Assists |
PPPts |
SOG per game |
Team Goals |
TOI per game |
PPTOI per game |
SH TOI per game |
|
Rookie |
22 |
68 |
6 |
32 |
16 |
1.66 |
244 |
23:49 |
4:32 |
4:20 |
|
Second Season |
23 |
81 |
14 |
45 |
33 |
1.59 |
277 |
23:56 |
5:59 |
2:16 |
Result = gain in production of 13 points
Brent Seabrook (rookie in 2005-06 with Chicago)
|
|
Age |
Games |
Goals |
Assists |
PPPts |
SOG per game |
Team Goals |
TOI per game |
PPTOI per game |
SH TOI per game |
|
Rookie |
20 |
69 |
5 |
27 |
16 |
1.65 |
211 |
20:01 |
3:50 |
2:31 |
|
Second Season |
21 |
81 |
4 |
20 |
4 |
1.77 |
201 |
20:46 |
2:06 |
3:32 |
Result = drop in production by 14 points
Lubomir Visnovsky (rookie in 2000-01 with Los Angeles)
|
|
Age |
Games |
Goals |
Assists |
PPPts |
SOG per game |
Team Goals |
TOI per game |
PPTOI per game |
SH TOI per game |
|
Rookie |
24 |
81 |
7 |
32 |
14 |
1.29 |
252 |
16:58 |
2:38 |
0:12 |
|
Second Season |
25 |
72 |
4 |
17 |
6 |
1.32 |
214 |
16:14 |
3:26 |
0:06 |
Result = drop in production by 15 points
Brad Stuart (rookie in 1999-00 with San Jose)
|
|
Age |
Games |
Goals |
Assists |
PPPts |
SOG per game |
Team Goals |
TOI per game |
PPTOI per game |
SH TOI per game |
|
Rookie |
20 |
82 |
10 |
26 |
14 |
1.62 |
225 |
20:24 |
4:32 |
1:33 |
|
Second Season |
21 |
77 |
5 |
18 |
7 |
1.54 |
217 |
20:05 |
4:54 |
2:03 |
Result = drop in production by 12 points
Brian Rafalski (rookie in 1999-00 with New Jersey)
|
|
Age |
Games |
Goals |
Assists |
PPPts |
SOG per game |
Team Goals |
TOI per game |
PPTOI per game |
SH TOI per game |
|
Rookie |
26 |
75 |
5 |
27 |
7 |
1.70 |
251 |
18:50 |
2:10 |
0:16 |
|
Second Season |
27 |
78 |
9 |
43 |
22 |
1.82 |
295 |
21:40 |
3:05 |
1:03 |
Result = gain in production of 19 points
Derek Morris (rookie in 1997-98 with Calgary)
|
|
Age |
Games |
Goals |
Assists |
PPPts |
SOG per game |
Team Goals |
TOI per game |
PPTOI per game |
SH TOI per game |
|
Rookie |
19 |
82 |
9 |
20 |
12 |
1.46 |
217 |
19:22 |
2:54 |
1:39 |
|
Second Season |
20 |
71 |
7 |
27 |
10 |
2.11 |
211 |
20:44 |
3:04 |
1:17 |
Result = gain in production of 10 points
Mattias Ohlund (rookie in 1997-98 with Vancouver)
|
|
Age |
Games |
Goals |
Assists |
PPPts |
SOG per game |
Team Goals |
TOI per game |
PPTOI per game |
SH TOI per game |
|
Rookie |
21 |
77 |
7 |
23 |
9 |
2.23 |
224 |
22:42 |
3:23 |
2:44 |
|
Second Season |
22 |
74 |
9 |
26 |
17 |
1.74 |
192 |
26:03 |
4:35 |
4:17 |
Result = gain in production of 7 points
*
Looking at the Data and the Apparent Effects of Different Factors
Overall Data
Among the 24 rookie rearguards, and based on per-game scoring, 15 fared worse as sophomores, while only nine fared better. Moreover, the reduction in scoring rate ranged from 19 points to just one point, with an average drop among the 15 of 10.66 points. Meanwhile, the highest scoring rate gain was 19 points, and the lowest three points, with the average gain being 8.77 points. Therefore, according to this data it is indeed more likely than not a defenseman will fare worse as a sophomore than as a freshman, and the drop is usually more than the increase in those who see scoring gains.
Rookie Age
Looking just at ages, among those who were either 18 or 19 as a rookie five of the six fared worse as a sophomore, and the one who fared better did so twenty seasons ago. Both the age 20 and 21 groups were a mixed bag, with half seeing their stats improve as a sophomore and half seeing a decline. Age 22 was the only group where more members (three) saw their scoring output increase than decrease (one). Among those 23 or older as rookies, a mere one of five produced better sophomore stats than his rookie output, and that too was quite a while ago (Brian Rafalski in 1999-00 and 2000-01).
If we’re to draw a conclusion, it’s that – on paper – the younger or older a rookie d-man is the more at risk he becomes for enduring a sophomore slump. But beyond that, even those in the age 20-22 group are roughly 50/50 bets to play better as sophomores versus doing worse. Of course there are other factors at play, so let’s look at those as well.
Team Scoring
There was an exact 50-50 split among players in terms of improved versus worse team scoring output from their rookie season to their sophomore campaign. Of the 12 players whose teams tallied more goals in their sophomore campaign than when they were rookies, only five had improved production. Moreover, nearly as many (four) players saw their scoring improve in their second season compared to when they were rookies despite playing for teams who tallied fewer goals as did (five) whose team saw its goal total improve. As such, whether a player is or is not vulnerable to a sophomore slump does not seem to be significantly based on the scoring of his team as a whole.
Shots on Goal per Game
In all, 13 of the 24 rearguards fired more pucks on net per game in their second season than they did as rookies, yet eight of the 13 saw their scoring drop notwithstanding the per game SOG increase. Among the five who topped two SOG per game as rookies, three fired fewer SOG per game as sophomores yet two of the three ended up scoring more as sophomores whereas only one of the two who topped two SOG per game as a rookie but saw his SOG per game increase season-to-season saw his production likewise increase.
If we look at just those rookies who fired 1.75 or fewer SOG per game then saw their SOG per game rate drop, we come up with a total of seven, of which five saw their scoring rate drop as a sophomore. So if there is a takeaway it’s not too surprisingly to be concerned about lower shooting defensemen whose shooting rate as a sophomore drops even further.
Ice Time
Of the 24, 11 saw their average PP Time per game drop as a sophomore, and ten of those 11 saw their scoring (or scoring rate) drop as a sophomore. In terms of overall ice time, fewer saw losses there, as only six took the ice for less average time per game, yet all six saw drops in scoring. Not surprisingly, therefore, ice time does appear to play a large part in determining whether a sophomore slump will or will not occur.
PP Scoring
As noted above, the average PPPt output of these players in their first season was 14.7, and among the 11 who bested that average, nine tallied fewer PPPts as a sophomore, with all but one also seeing his point total fall as well. Among d-men who saw scoring gains from their first to second year were those who had higher PP outputs, yet four of the nine who saw an increase didn’t tally more than ten PPPts as a sophomore, so a large PPPt output is not a prerequisite for scoring gains as a sophomore.
Conclusions
I’m sure there’s even more data that can be crunched, but at nearly 3000 words already I need to start to wrap up this column. I certainly welcome readers to share their own calculations and observations in the comments sections below.
In terms of what we learned, if you have to bet one way or the other on whether a first year d-man will see his scoring go down as a sophomore, the pure numbers suggest the safer wager is on a drop. But what about factors that will allow us to decide who will or won’t slump as a sophomore based on more specific – and measurable – information?
Unfortunately there apparently aren’t many data points which, going into a sophomore season, will allow poolies to make reliable predictions as to whether a specific d-man will fare better or worse in his second season. That’s because the major factors that seem to matter are ice time and PP scoring, which, although influenced to some degree by one’s rookie season and/or offseason transactions, will depend far more so on what unfolds during that second season itself. This all having been said, if you had to make some generalizations based on the data we saw here, you’d want to watch out for teen rookies or rookies who were older than 23, as they seem more vulnerable to slumping as sophomores. So too do those didn’t have many SOG to begin with.
What about 2018-19 Sophomore Defensemen?
What does all this mean for the two 29+ point true first year d-men from 2017-18, namely Charlie McAvoy and Will Butcher? McAvoy was a bit young and had low SOG totals despite a better than point per every other game average, while Butcher, although three years older, wasn’t a SOG machine despite likewise averaging more than a point per every other game.
Who were the past rookies with outputs most similar to these two? Not really anyone exactly, although for what it’s worth John Klingberg only fired 1.50 SOG despite better than point per every other game scoring and then broke out as a sophomore. But also there was Tyler Myers, who put up major points a rookie despite only firing 1.30 SOG per game and then never hit the 40-point mark again.
No one else both fired few SOG but scored 0.5 points per game or better; however, the ones who didn’t have more than 1.5+ SOG per game as a rookie and came closest to 0.5 points per game included one slumper (Nikita Zaitsev) and one gainer (Hampus Lindholm). Long story short, there’s no consensus on whether McAvoy or Butcher will endure a sophomore slump or not; however, with more d-men doing so than not, best to tread lightly when drafting either one for this season.
Related Posts
UPCOMING GAMES
Starting Goalies
Top Skater Views
| Players | Team | |
|---|---|---|
| TRAVIS KONECNY |
| |
| MARCO ROSSI |
| |
| AARON EKBLAD |
| |
| COLE PERFETTI |
| |
| NILS HOGLANDER |
| |
Top Goalie Profile Views
LINE COMBOS
| Frequency |
| |
|---|---|---|
| 25.9 | NATHAN MACKINNON ARTTURI LEHKONEN JONATHAN DROUIN | |
| 22.2 | MIKKO RANTANEN ZACH PARISE CASEY MITTELSTADT | |
| 14.3 | MILES WOOD JOEL KIVIRANTA ROSS COLTON | |
DobberHockey Podcasts

Fantasy Hockey Life: Florida Panthers with Colby Guy
Colby Guy joins the show to talk about the Cup champs. We discuss Sam Reinhart, Matthew Tkachuk, Aleksander Barkov, Sam Bennett, Evan Rodrigues, Anton Lundell, Mackie Samoskevich, Aaron Ekblad, Gustav Forsling, Nate Schmidt, Adam Boqvist, Sergei Bobrovsky and Spencer Knight. In-Goal Magazine’s Cat Silverman joins in our Cat’s Instincts segment to discuss Spencer Knight and […]
Fantasy Hockey Life: Boston Bruins with Fluto Shinzawa
Fluto Shinzawa of The Athletic joins Victor and Jesse to talk Boston Bruins. They discuss David Pastrnak, Elias Lindholm, Brad Marchand, Charlie Coyle, Pavel Zacha, Morgan Geekie, Matthew Poitras, Charlie McAvoy, Hampus Lindholm, Jeremy Swayman, and Joonas Korpisalo. In-Goal Magazine’s Cat Silverman joins in our Cat’s Instincts segment to discuss Brandon Bussi and Michael DiPietro. […]
Fantasy Hockey Life: Brian Hedger on the Columbus Blue Jackets
Brian Hedger of the Columbus Dispatch joins the show to look forward to next year’s Blue Jackets.
Fantasy Hockey Life: Nashville Predators with Bryan Bastin
Bryan Bastin of On the Forecheck joins Victor and Jesse to talk Nashville Predators. They discuss pros Filip Forsberg, Gustav Nyquist, Ryan O’Reilly, Tommy Novak, Luke Evangelista, Philip Tomasino, Cody Glass, Roman Josi, Alexandre Carrier, Juuse Saros, Kevin Lankinen, Yaroslav Askarov, Steven Stamkos, Jonathan Marchessault and Brady Skjei. In-Goal Magazine’s Cat Silverman joins in our […]
Fantasy Hockey Life: Toronto Maple Leafs with Cindy Caron
The Toronto Maple Leafs made it to a Game 7 overtime but were frustrated again in the playoffs. Recorded pre-free agency, Cindy Caron of I-Express.ca joins Victor and Jesse to go over the pro roster: Auston Matthews, Mitch Marner, William Nylander, John Tavares, Max Domi, Tyler Bertuzzi, Matthew Knies, Bobby McMann, Morgan Rielly, Timothy Liljegren, […]