Ramblings: New jerseys; Hoffman still un-signed; league-wide trends – November 17
Michael Clifford
2020-11-17
If you haven't picked up your copy of the 2020-21 Dobber Hockey Fantasy Guide, now is the best time to do it. We have depth charts, lineups, power-play configurations, projections, prospect impact, and a whole lot more. Not only that, but it will be updated until the 2020-21 season kicks off, whenever that is.
*
It strikes me weird that Mike Hoffman is still a free agent. Few players have had the goal-scoring consistency he's had for the last half-dozen years. Sure, he turns 31 next week, but we've seen a lot of good players signed at deep discounts this off-season because of, well, *gestures broadly*. Evgenii Dadonov, his former teammate, is a better player and could only get 3x$5M from a non-playoff team that has oodles of cap space.
It may be a case where he will wait out the market and one of two things happen: he takes a discounted one-year, which may be all that is available now, or a team caves and gives him a multi-year deal. He is also more of a finisher/PP guy rather than a play-driver, so maybe teams are getting wise to that.
(I had this written before I looked at Dobber's Monday Ramblings. He talks about a lot of the remaining free agents, Hoffman included, here.)
*
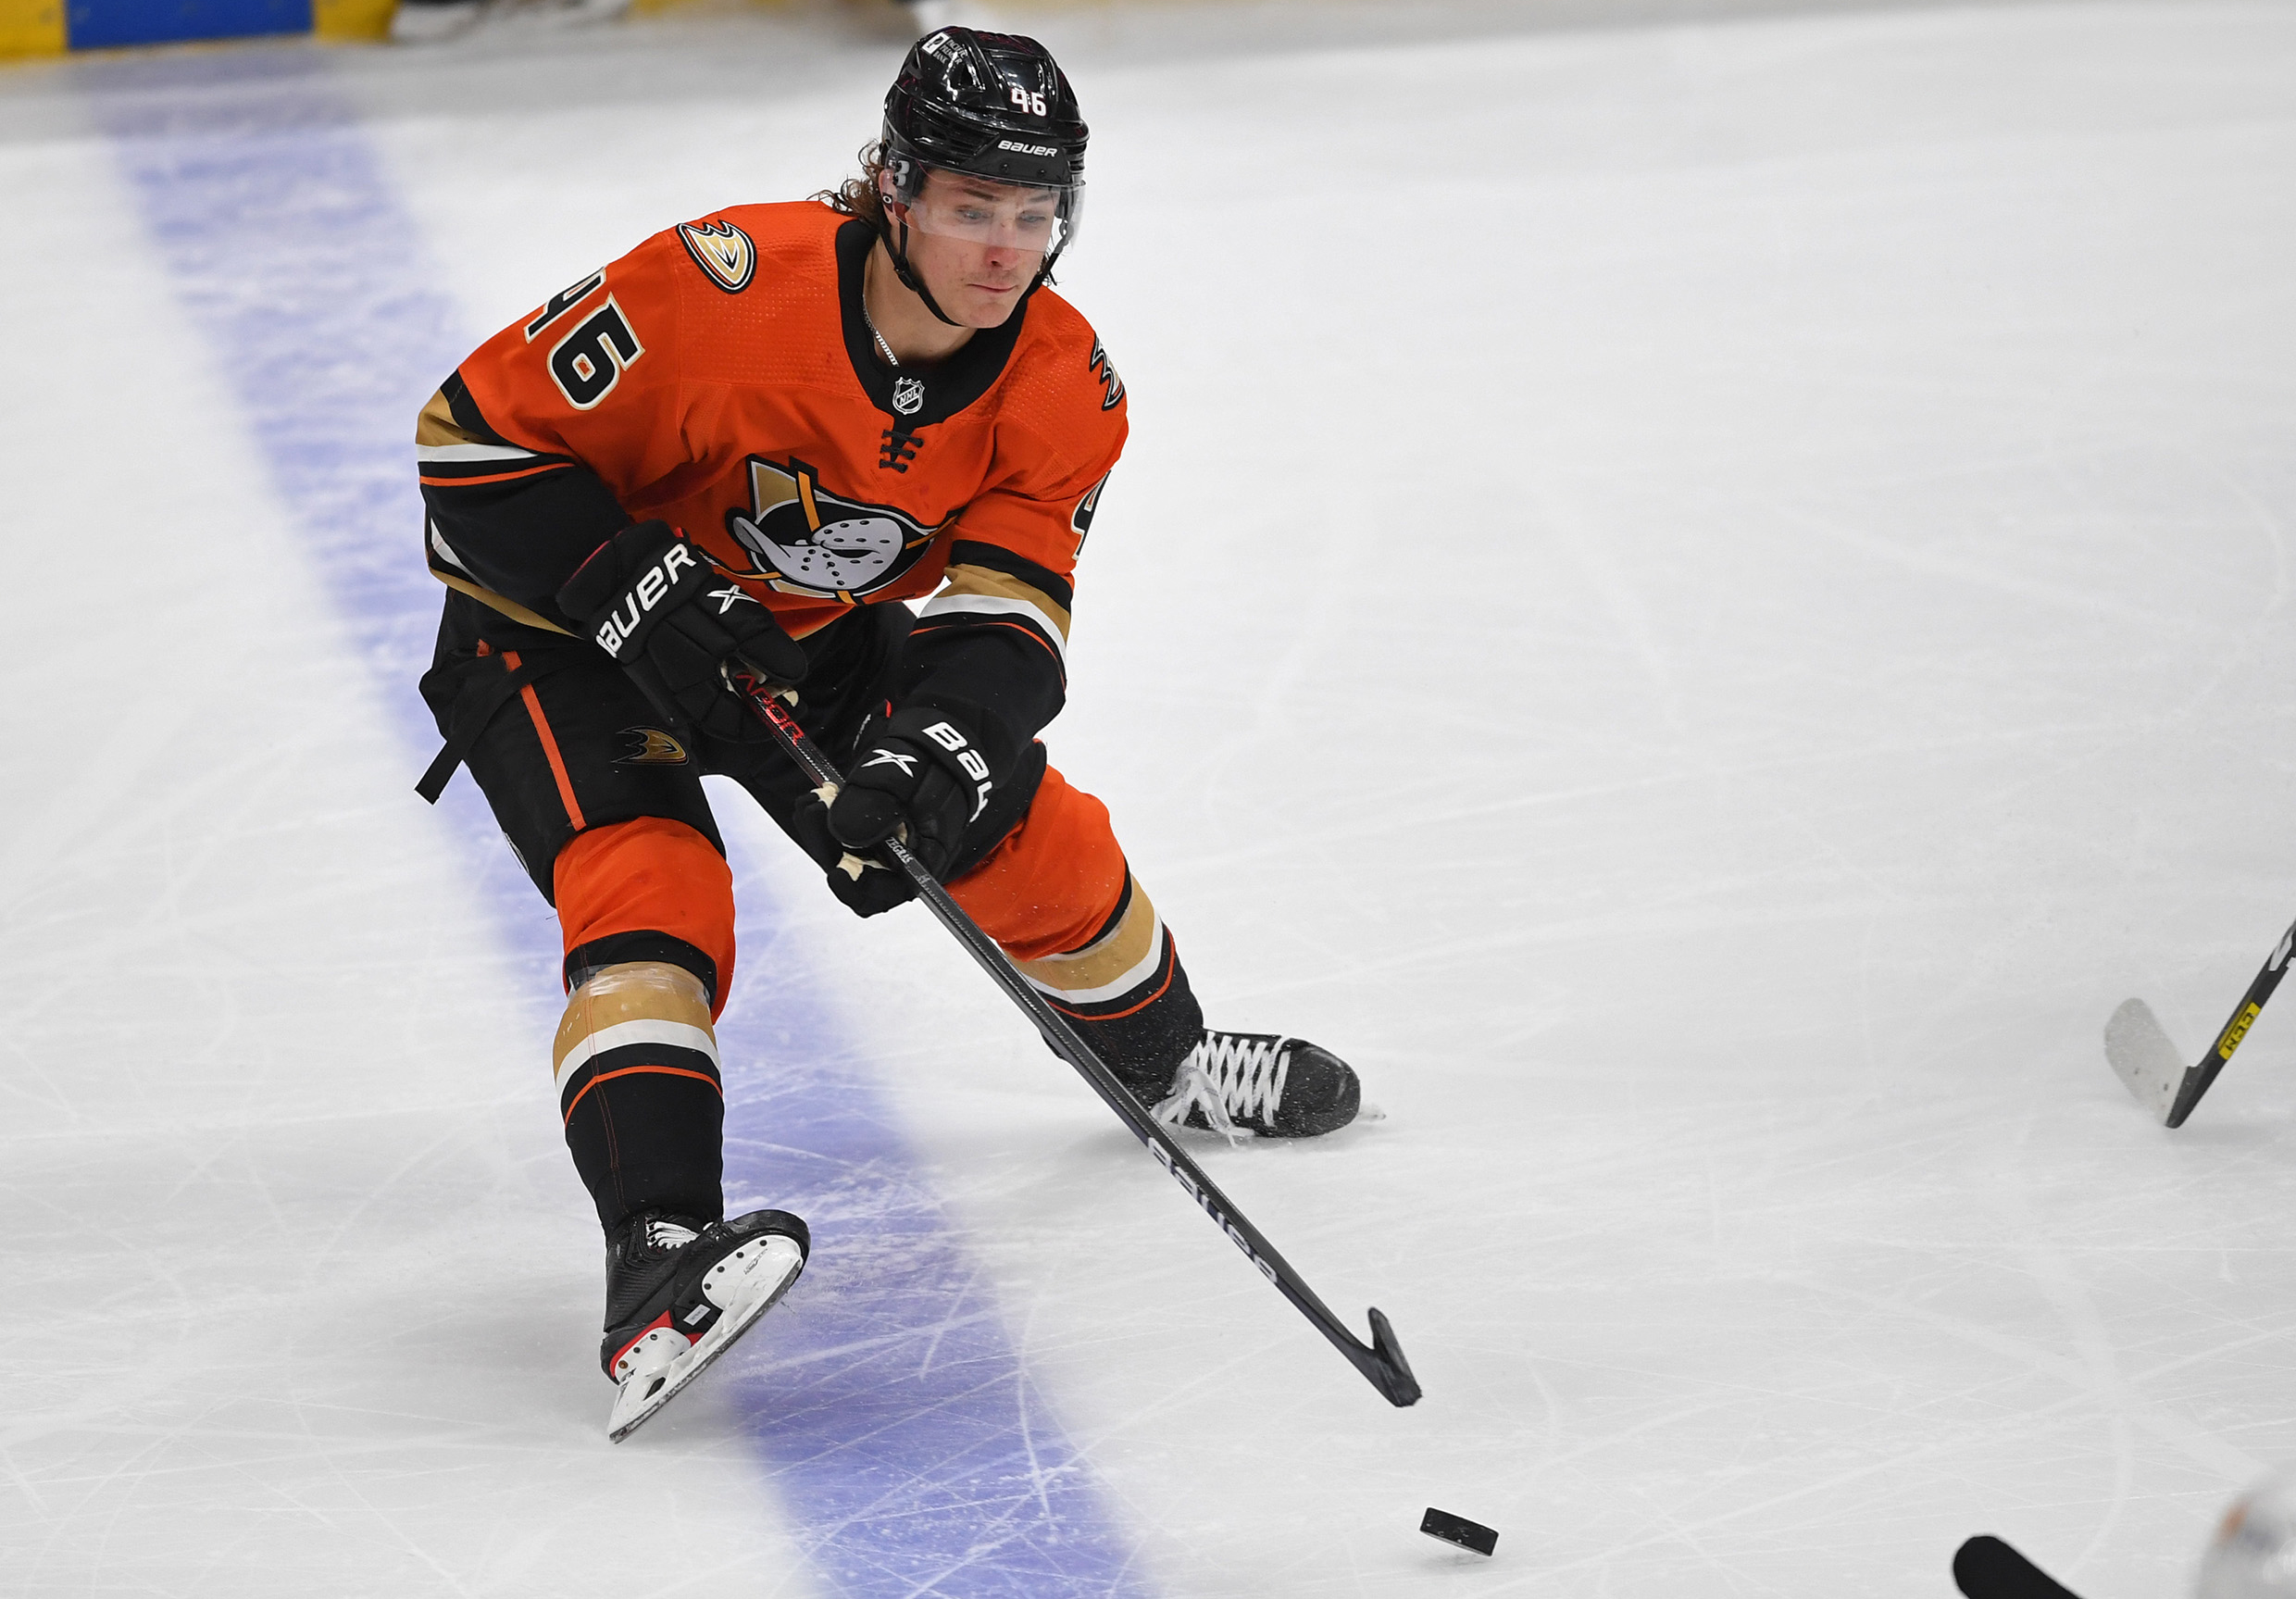
The NHL released their reverse retro jerseys (we're hard up for news here). Some of them are funny as there's really not much difference between these Bruins and Islanders jerseys and the ones they normally wear. Some of them are throwbacks to older jerseys – the Ducks have the goalie leaping out of the ice while Arizona's took their peyote Kachina jersey and gave it a triple-dose of LSD. The Kings jersey, mixing their early-90s jersey with their 80s jersey, is pretty rad, though:
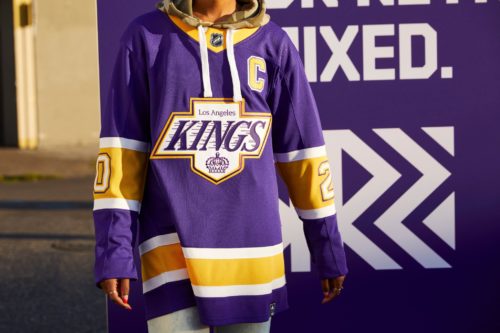
I could see myself in a Byfield Kings jersey.
*
One thing I do in fantasy leagues – and yes, I know a lot of people do this – is stack teams in my fantasy drafts. A couple years ago, I focused on Calgary Flames skaters and that worked out very well. This past season, it was the New York Rangers, and that worked out great – I had a 12-team league with 30 roster spots, Ryan Strome was like my 27th pick, and he became a staple of my lineup for large portions of the season.
The reason for doing this is two-fold. Goals/assists/shots/PPPs are multiplied, so one goal from, say, Artemi Panarin can bring a goal and two assists to a fantasy roster. The second is that there are not only under-valued players every year, there are under-valued teams. Rosters who just couldn't find the back of the net, dealt with injuries, or had other reasons for being under-valued in drafts.
One team that is a possibility for this method in 2020-21 is Buffalo but I assume a lot of people will be going in that direction. The addition of Taylor Hall to Jack Eichel will get a lot of people excited.
There are a few other teams that are worthy of consideration, like the Flames (again) or Sharks. Just something to think about.
*
This specific moment in the NHL's history is unique for a lot of reasons, not the least is this: it now gives us three full(ish) seasons with an increased scoring rate. The 2010s saw scoring generally hover between 2.7-2.85 goals per game until 2017-18, when it jumped to 2.97, and that has gone up incrementally over the last couple years. Everyone has their theories as to why scoring has risen in recent seasons, as do I, but this isn't the time for that.
Rather, this is the time to look back on those three years to look for changes within. Does the uptick in goals lead to fewer or more hits? Fewer or more blocks? Shots? Are assist rates changing at all? How about within and between positions? Well, let's take a look.
We will be looking at all strengths here, rather than even strength or 5-on-5. Good? Good.
The first thing we need to do is compare the three years prior to these recent three seasons, so we'll be contrasting 2014-17 and 2017-20, and we're going to start with league-wide trends today before breaking down between/within positions. Data from Natural Stat Trick:
|
|
2014-17 |
2017-20 |
|
Shot attempts/60 |
55.15 |
57.12 |
|
Shots/60
📢 advertisement:
|
29.55 |
31.24 |
|
Goals/60 |
2.65 |
2.93 |
| Shooting percentage | 8.96 |
9.37 |
(The reason for the discrepancy in goals here and goals in the first paragraph is doing per 60 minutes rather than doing per game.)
Shot attempts, shots, and shooting percentage are all up along with the rising goal rate. That means different things for us and we'll get into the specifics once we start breaking down by positions, but it's just important to know there is more shooting going on in general, and more goals are going in off those shots than at any time in the last decade.
Again, position-specific stuff matters, but generally speaking, it means we're looking for more shots from our players and have to be more lenient with our goalies. Five years ago, a goalie with a .910 save percentage may have been waiver fodder in most fantasy leagues. Now, it's pretty close to average. Five years ago, a goalie with a 2.80 GAA would have been waiver fodder. Now, it's better than average.
One reason for bringing this up is that people take shortcuts. It is just a thing people do. We save five minutes off cooking whenever possible, we will cut through a parking lot to get to a side street rather than drive around, and we have pre-determined benchmarks for what we'd like to see our fantasy players reach. Phrases like, "he's a 20-goal scorer" or "he's a 30-win goalie" aren't just predictions, they're judgments. Saying someone is a 20-goal scorer is shorthand for fantasy relevance. But what if 20-goal scorers are no longer automatically fantasy relevant because of the rise in goal scoring? What if our benchmark should be 25 goals now? It could change how we view a lot of players.
It is also worth noting how the ratio of shot attempts/shots has changed. In the three-year span from 2014-17, 53.58 percent of shot attempts turned into shots on goal. The last three years have seen that climb to 54.69 percent. That means more shot attempts are turning into shots on goal than earlier in the decade.
Now, we're going to look at individuals rather than teams. For today, we're going to look at all players rather than break it down by position, but that will come later this week. We will look at hits, blocks, and assists, breaking down the latter part by primary and secondary contributions. Again, all stats from NST:
|
|
2014-17 | 2017-20 |
|
Hits/60 |
4.71 | 4.42 |
|
Blocks/60 |
2.88 |
2.88 |
| Primary assists/60 | 0.52 |
0.56 |
| Secondary assists/60 | 0.41 |
0.45 |
There isn't a lot here that is surprising. Hits have declined, but hits, penalty minutes, and fighting have all been trending down for years now, so this isn't news. Primary and secondary assist rates have climbed in lockstep with each other and have climbed with goal rates. Again, not a big surprise.
The surprise here comes from shot blocks. The rate of shot blocking has remain relatively* unchanged through our two three-year sets.
*Numbers are rounded so there are small decimal differences three and four spots after the decimal.
We have more shot attempts turning into shots on goal, so that alone would tell us we should see fewer shot blocks, but that has been counter-balanced by there being more shots to block in general. How this all works it takes more mathematical skills than I possess but it's just worth keeping in mind that even with the rise in shot rates across the league, we don't need to adjust our expectations about shot blocking. I surmise that this will change once we break things down by position, but for now, it's status quo.
We will stop the exposition here but this is where we stand compared to a few years ago:
- Goals, shots, shooting percentage, and assists are all up.
- Hits are down.
- More shot attempts are turning into shots on goal but the rise in shot volume means no change for shot blocking
- We probably should change our shortcut benchmarks.
My next Ramblings will go into more detail about the positions, but these are things to keep in mind as we look forward to 2020-21.
Related Posts
UPCOMING GAMES
| Apr 26 - 19:04 |
| vs |
| |
| Apr 26 - 19:04 |
| vs |
| |
| Apr 26 - 22:04 |
| vs |
| |
| Apr 26 - 22:04 |
| vs |
| |
Starting Goalies
Top Skater Views
Top Goalie Profile Views
LINE COMBOS
| Frequency |
| |
|---|---|---|
| 16.9 | PIUS SUTER J.T. MILLER BROCK BOESER | |
| 14.9 | SAM LAFFERTY PHILLIP DI GIUSEPPE TEDDY BLUEGER | |
| 12.8 | ELIAS PETTERSSON ILYA MIKHEYEV NILS HOGLANDER | |
DobberHockey Podcasts

Fantasy Hockey Life: Salary Cap Basics Remix
If you missed last year’s series on salary leagues, this is a remix with some bonus material. Jesse and Victor discuss the different ways you can step up your dynasty league with a salary component. Our show is part of the Dobber Podcast Network and sponsored by Fantrax.com. Email [email protected] and ask to join our […]

Keeping Karlsson: No. 533 – Ultimate Champion Interview + Playoff Preview
On this week’s Keeping Karlsson Fantasy Hockey Podcast mega-show, Elan and Brian gather and analyze the latest fantasy hockey news, notes and data.
Fantasy Hockey Life: Tim-Eh’s Time in the TIDY Top Tier
When one of the managers in the TIDY league top tier left midseason, Patron Tim volunteered to give up his excellent team to take over a mid-season orphan fighting to escape relegation. And Tim did not go quietly. Ryan, Jesse and Victor welcome Tim to talk through his experience and the trades he made in […]
Keeping Karlsson: Better Off Nedeljkovic
On this week’s Keeping Karlsson Fantasy Hockey Podcast mega-show, Elan and Brian gather and analyze the latest fantasy hockey news, notes and data from the past season to work on projecting the 2023-24 NHL and fantasy hockey season. — Join the Keeping Karlsson patron community! Patrons get guaranteed KKUPL invitations, plus monthly bonus AMA episodes, and full access to […]
Fantasy Hockey Life: FHL Player Cards with Brandon
Our guy Brandon has been doing great work behind the scenes to great Fantasy Hockey Life prospect player cards, visualizations with the metrics we care about most – including BASH. These are a great tool to catch at a glance the stats for upcoming players. Jesse interviews Brandon and Victor on the decisions behind what […]