

Ramblings: Carolina Dominates in Game 4; Changes in Shot, Hit, Block, and PIM Totals Among Defencemen – May 28
Michael Clifford
2026-05-28
The Carolina Hurricanes took stranglehold on their Eastern Conference Final matchup with the Montreal Canadiens thanks to a 4-0 win on Wednesday night. It gives them a 3-1 series lead with a chance to close things out on Friday night back in Raleigh.
As the Hurricanes did for Game 2 and Game 3, they were dominant pretty much from start to finish in Game 4. They scored three times in less than three minutes late in the first period to cruise to victory, doing so by out-shooting the Habs 42-18. They have now outshot Montreal 107-43 in their three wins. Whatever quality chances the Canadiens can muster, it is not nearly enough when they're getting outshot by a margin of 2.5:1 for three games.
Sebastian Aho, Jordan Staal, Logan Stankoven, and Andrei Svechnikov had the goals for the Hurricanes. That was Stankoven's first goal of the series after scoring seven goals in the first eight games of Carolina's playoff run, but he does have 42 shots in his 12 games as he's been a consistently generating offence pretty much from the postseason get-go.
Shayne Gostisbehere had a pair of assists, three blocks, and a hit in the win. K'Andre Miller led all skaters on either team in ice time, totaling 24:41, to go with his assist, two shots, four blocks, and one hit. He now has eight assists in 12 postseason games with the Hurricanes as he's been largely tremendous all postseason.
Frederik Andersen stopped all 18 shots he faced in the win for his third shutout of the postseason. That is as many shutouts as every other goalie who has appeared in these playoffs combined.
Jakub Dobes did what he could for Montreal, but took another loss, allowing three goals on 42 shots.
*
In Tuesday's Ramblings, we went over the changing rates of peripherals produced by defencemen, focusing on hits, blocks, shots, and penalty minutes. We covered the evolving 60-minute rates as well as the changing percentage shares of a player's individual peripheral profile. For example, what percentage of hits/blocks/shots/PIMs are only shots, or only hits, and so on.
Today, we're staying with peripheral changes among defencemen but shifting the focus to the actual totals. The final numbers produced in each category are what determine a player's fantasy value, so while 60-minute rates and percentages can tell us the value of the peripherals, the overall total numbers give us the targets we should aim for.
The data is from Evolving Hockey and this is at all strengths. To begin, let's start with the big change we saw in Tuesday's write-up, and that's the drop in hits:
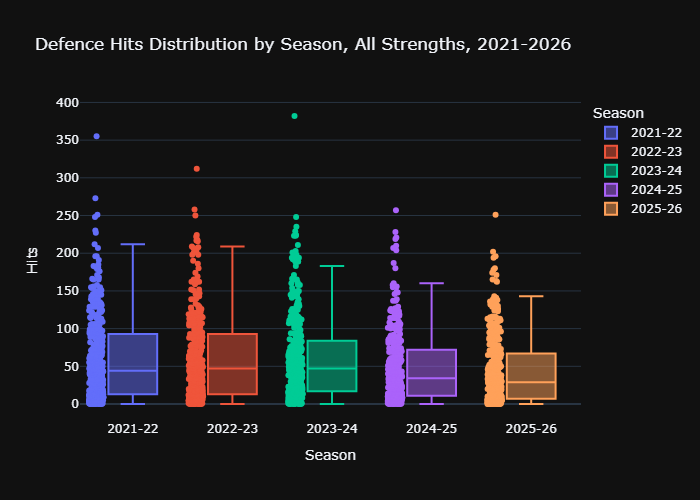
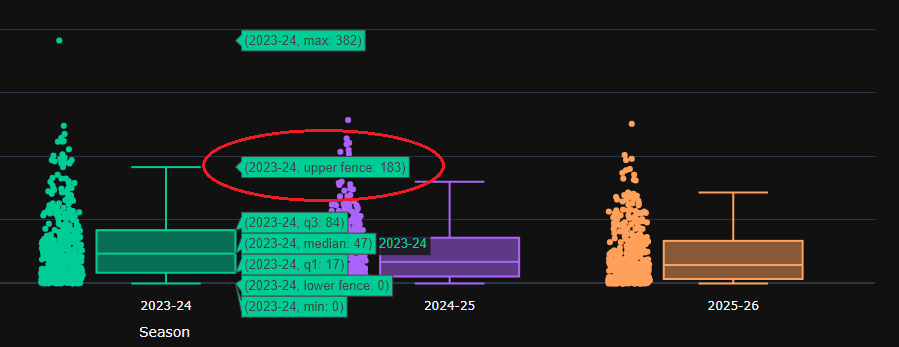
For anyone who forgot what these kinds of graphs show us, they give us the totals of a specific stat within certain limits. For example, it shows us what a 75th percentile total is, what the median total is (the middle of the individual totals), and so on. The line we'll start with is the highest horizontal line in each plot, which is the 'whisker' outside of the box. This whisker line (called the 'upper fence') shows the limit for outliers. In other words, any dots above the whisker line are considered outliers. In 2023-24, that line was at 183 hits:
And in 2025-26, that line was 143 hits:
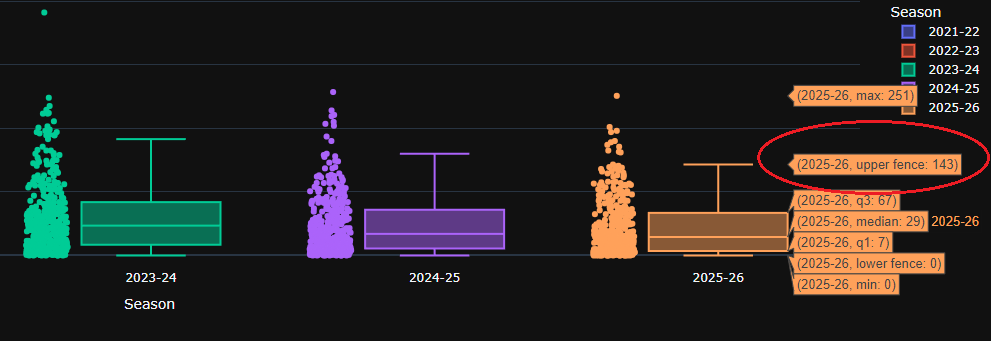
In two years, we went from anything above 183 hits being an outlier to anything above 143 hits being an outlier. That is a massive change in our target. It is very apparent when we see that in 2023-24, we had 10 defencemen crack the 200-hit plateau, whereas we had just two such defencemen in 2025-26 (Jeremy Lauzon and Brenden Dillon). As we mentioned on Tuesday, the skills possessed by an average defenceman have drastically changed over the last five years, and that shows up in the hit totals. There are other reasons why this is the case – how the league is counting peripheral stats matters – but whatever the causes (and the importance of each cause), there are just far fewer hits from defencemen available now for us fantasy managers.
To put a final point on this: the 24 highest hit totals in the 2023-24 season averaged 2.79 hits per game. In 2025-26, that number was 2.16, which is a drop of nearly 23%. Among the defencemen that fantasy managers rely on the most for propping up their hit columns, we have seen a massive drop in hit totals, and that means we need to greatly adjust what we expect from top hit producers.
Let's move on from hits to shot blocking:
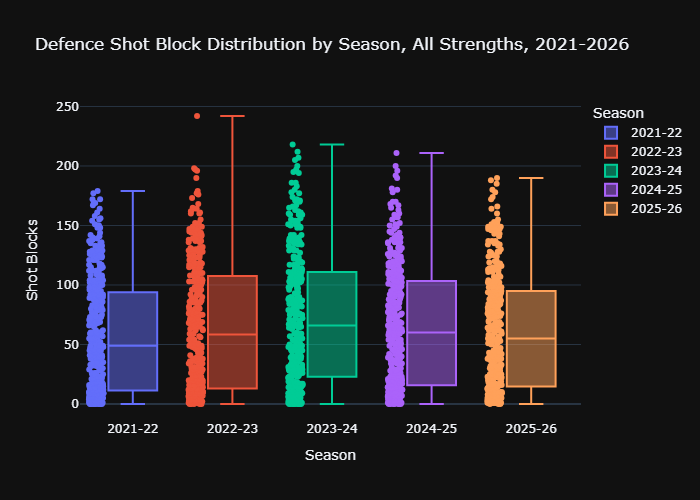
This is also a substantial drop. The 75th percentile mark is the top of the box itself (not the whisker line that protrudes out from each box). The 75th percentile mark back in 2023-24 was 111 blocks, which means 75% of all NHL defencemen produced 111-or-fewer blocks. This past season, that number was 95. In two years, the 75th percentile mark for shot blocking among rearguards has dropped 14%. It isn't as severe as we saw in the hit totals, but it is sizeable, and stands in stark contrast to the forward totals – the 75th percentile mark for shot block totals among forwards was the same two years ago as it was in 2025-26.
Again, fantasy managers need to adjust their expectations for block totals from their defencemen. In two years, the number of defencemen to post at least 150 blocks has been cut by more than half. It makes the totals provided by elite shot blockers like Colton Parayko and Moritz Seider that much more valuable, but it also means that we need to lower our expectations for what we need for shot blocking from defencemen further down our fantasy rosters.
Now, we'll move on to shots on goal:
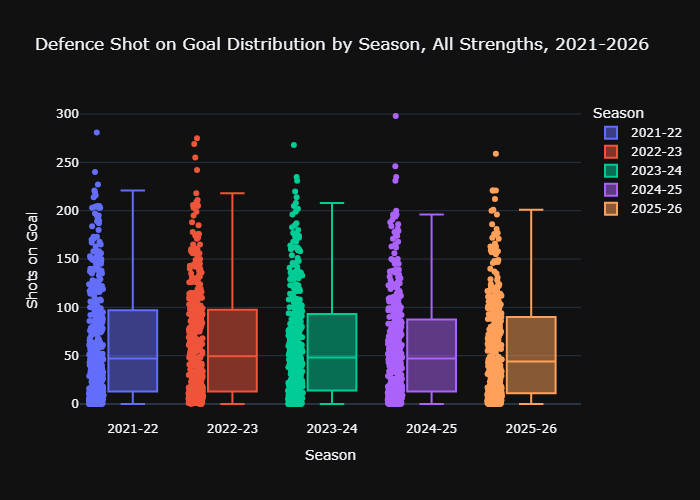
In 2025-26, the leader for shots on goal by a blue liner was Zach Werenski with 259, and the next-closest rearguards were Evan Bouchard, Jakob Chychrun, and Matthew Schaefer with 221 each. To put that into context, in 2023-24, Roman Josi led the league with 268 shots while second and third place were occupied by Rasmus Dahlin (235) and Cale Makar (231). The true upper-crust producers of shots on goal hasn't changed much, but as there has been a decline in shots on goal across the league, there has been a slight decline of the elite range for the blue liners.
There hasn't been much of a change in the tier below the elite options, either. In 2023-24, there were 29 defencemen who posted somewhere between 150-225 shots on goal. In the 2025-26 season, there were 27 such defencemen. If we add in the elite tier of shot producers, there were 32 blue liners with 150+ shots two seasons ago and 28 this past campaign. It is a decline, but it is not anywhere close to what we saw with forwards; the number of 200-shot forwards has dropped 32% in two years. A fantasy manager in a 12-team league will need to set their sights a bit lower on what they're looking for from their top-2 or top-3 defencemen, but the change isn't nearly as drastic as among forwards.
To wrap things up, we'll take a gander at penalty minutes:
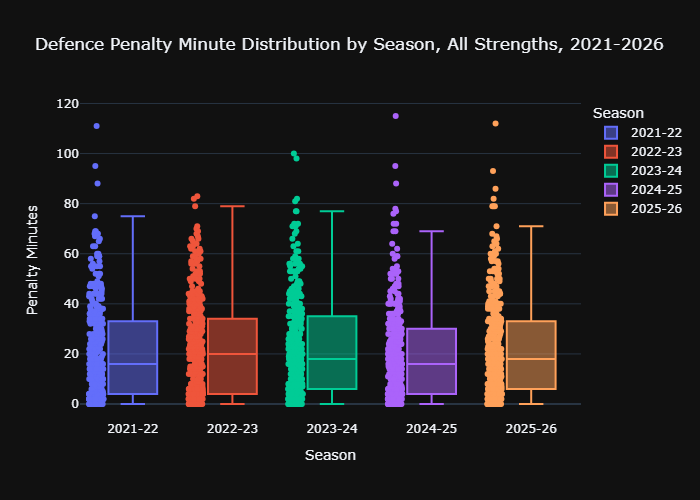
Remember that in Tuesday's article, we included just 2-minute and 5-minute penalties among penalty totals. We did the same here, and it shows what the Tuesday Ramblings showed: the increase in PIMs taken per 60 minutes and percentage of peripherals coming from PIMs led to a rise in the final PIM totals for defencemen. Compared to the 204-25 season, the 75th percentile mark in penalty minutes jumped 10% and the whisker line (upper fence) increased by 3%. Not huge increases, but increases nonetheless, and important in the context of all the declines we've seen elsewhere in these Ramblings.
Let's quickly summarize what we've reviewed today:
- The hit decline for defencemen is substantial, with high-end totals dropping anywhere from 20-25% over the last two years, depending on the exact limits we use for deciding what is a 'high-end total'.
- The drop in shot blocking is also noticeable, but nowhere near as large as the downswing in hits. Either way, where 150 blocks was an expectation of a multi-cat defenceman in very recent seasons, it is now relatively uncommon.
- There is a small drop in the top-end shot rates, but nowhere close to the decline in hits, and not even that close to the decline in blocks. We do have to aim a bit lower for our top-end shot totals, but it's not all that different from either the 2023-24 or 2024-25 seasons.
- Penalty minutes bucked the trend of the drops we've seen elsewhere, as their prevalence among defencemen increased slightly in 2025-26.
As I wrote yesterday, I understand that evaluating peripheral totals isn't the most exciting fantasy hockey topic, especially as we approach the Entry Draft and Free Agent Frenzy. However, if we want to improve our understanding of what we need to win fantasy leagues, this type of analysis is necessary every offseason.
Related Posts
Starting Goalies















Top Skater Views
| Players | Team | |
|---|---|---|
| DECLAN CARLILE |
 PIT PIT | |
| ADAM JIRICEK |
 STL STL | |
| OWEN POWER |
 BUF BUF | |
| BEN KINDEL |
PIT | |
| COLE PERFETTI |
 WPG WPG
| |
Top Goalie Profile Views
| Players | Team | |
|---|---|---|
| DEVON LEVI |
 EDM EDM | |
| SCOTT WEDGEWOOD |
 COL COL | |
| JACOB FOWLER |
 MTL MTL | |
| STUART SKINNER |
WPG | |
| LINUS ULLMARK |
 OTT OTT
| |
LINE COMBOS
| Frequency |
 CBJ Players CBJ Players
| |
|---|---|---|
| 24.3 | MATTHEW KNIES KENT JOHNSON ADAM FANTILLI | |
| 19.5 | COLE SILLINGER MATHIEU OLIVIER CHARLIE COYLE | |
| 13.3 | VALERI NICHUSHKIN SEAN MONAHAN CONOR GARLAND | |
DobberHockey Podcasts

Keeping Karlsson: Cole, There’s No Time!
Elan and Brian cover all the action from the first week of the NHL season, and identify our earliest must-adds, can-drops, sell highs and buy lows in your fantasy hockey leagues.
Keeping Karlsson: Matchup Maximizer 2026/27 Week 2
Elan takes a look at the schedule for the upcoming weeks of NHL action and recommends players with good schedules that you should consider streaming in to win your head to head matchups.

Fantasy Hockey Life: Tidy Takes Part 1
TiDy Admiral Ryan Downey and Victor Nuno break down recent trades in the FHL Tiered Dynasty’s top division, the Lord Stanley division. Tune in to consider trades between some of the best dynasty sharks we know, including patron polls on the trades and Victor’s analysis. Have a listen! Our show is part of the Dobber […]
Keeping Karlsson: Short Shifts – I Tried to be Like Parker Kelly
Elan is joined by Ryan Downey for the premiere of season 8 of Short Shifts! — KKUPFL late registration is ongoing! We’re still filling new divisions in the world’s greatest fantasy hockey league. Details at https://www.kkupfl.com/. Join the Keeping Karlsson patron community! Patrons get access to all our perks all year round, including KKUPFL […]
Keeping Karlsson: Shabanov Ranks
Elan and Brian fly through the final preseason lines for every NHL team ahead of opening night, and share their guys to watch– or look away from– in your fantasy hockey leagues.