

Analytics Advantage: Comparing Player Values Across Eras and Positions
Stas Pupkov
2026-07-03
Phil Esposito scored 76 goals in 1970-71. Auston Matthews scored 69 in 2023-24. Chris Pronger never cracked 63 points in a season, and Erik Karlsson has beaten that number seven times. George Hainsworth once finished a full season with a goals-against average under 1.00.
So, which of those was the best? You can’t actually answer that with raw numbers, and this isn’t a bar trivia problem. It’s the same problem you face every time you value a keeper, weigh a 30-year-old defenseman against a 26-year-old winger, wonder whether your goalie’s .905 is bad, or just what 2026 looks like. The scoring environment never sits still. The league of 1981-82 scored 30% more goals per team-game (4.01) than the league Matthews plays in (3.08). Esposito’s 1970-71, weirdly enough, came in a scoring environment almost identical to today’s. “Good” keeps moving on you unless you pin it down first.
That’s what this column is for. Everything here comes from one dataset: every NHL regular-season skater and goalie line from 1917-18 through 2025-26. That’s 47,612 skater seasons and 4,985 goalie seasons across all 108 years, with every player tagged by position and birthdate. Today I’ll lay out the measuring sticks and show you three things they reveal about which positions actually carry the league. The follow-up column uses the same tools on aging, which is where the real keeper-league money is.
Standing on shoulders
None of this starts from scratch, and it shouldn’t. The delta method I’ll lean on for aging curves comes out of baseball, from Tom Tango and Mitchel Lichtman’s long-running work on aging. The Evolving-Hockey twins brought it to hockey in their 2017 aging study, and CJ Turtoro later stress-tested it with simulations and found that, warts and all, it remains the best tool we have for population-level aging curves. The framing of this whole series, where you define your philosophy before showing a single result, is borrowed with admiration from EvolvingWild’s WAR trilogy: Part 1, Part 2, and Part 3. Where my numbers agree with the published work, I’ll say so. Where they disagree, I’ll say that louder.
The four measuring sticks
Everything in these two columns uses one of four definitions. There are no hand-picked eras and no vibes. Every constant gets computed from that season’s own data.
Production Index. A player’s points per game divided by the league average points per game for his position in that season. A 1.00 forward is exactly a league-average forward of his own year, and a 2.00 forward is doubling that. When Gretzky’s 1983-84 comes out at 4.1 and McDavid’s 2022-23 comes out at 3.5, the 80s inflation has already been paid for. This is the workhorse unit.
Share of Peak. The aging unit, built with the delta method. You take how the same player changes from one age to the next, average those changes across everyone, and chain them into a curve. The point of doing it this way is that it measures how players age rather than which players survive long enough to get measured at 38. The survivors are a very different group from the departed. Keep that in mind whenever anyone shows you an aging curve, including me.
Delta save percentage (ΔSV‰). A goalie’s save percentage minus the league’s, expressed in saves per thousand shots. A +5 goalie steals five extra saves per 1,000 shots against. Shot counts only enter the historical record in 1955, so this stick reaches back exactly that far, and every chart marks where its data begins.
aWAR. All-era wins above replacement, one currency for all three positions. It takes offense above a replacement-level full-timer (the 20th-percentile regular at your position that season), team defense allocated to the skaters who carried it, and goaltending above a replacement-level netminder, converts everything to standings points and then wins, and finally calibrates the whole thing so a win means the same in 1930 as in 2025. It’s built from box scores and team results, so it can’t see a shutdown defenseman’s stick lifts, and I won’t pretend otherwise – Doug Harvey fans, your grievance is registered and correct. What it can do is put a forward, a defenseman, and a goalie on one scale across a century. Before trusting it, I checked two things. Its all-time career list opens with Gretzky, Gordie Howe, Alex Ovechkin, Jaromir Jagr, and Sidney Crosby without ever being shown those names. And when I tested it against hockey-reference’s Point Shares across three different eras, the two agreed at r = 0.91 to 0.93.
So which season was best?
The opening question now has an answer. Put all four on the aWAR scale and Esposito’s 1970-71 wins at 15.7 wins above replacement, the fourth-best skater season ever recorded on this scale. Matthews’ 69-goal year comes in at 11.9, Hainsworth’s sub-1.00 masterpiece at 9.6, and peak Karlsson at 7.7. The reason Esposito wins is the whole point of the exercise: he did it in a scoring environment nearly identical to today’s, against a replacement level that hadn’t caught up to him yet. The raw “76 goals” actually undersold him. The context-free comparison to Matthews was unanswerable, and the normalized one takes a sentence. That’s what a measuring stick is for.
The blue line has never been worth more
Divide defensemen’s scoring rate by forwards’ scoring rate and every era effect cancels out, leaving pure positional geometry. That ratio bottomed out at 40% in 1938, back when the rushing defenseman was functionally extinct. It then climbed for eight straight decades and sits at 67.4% today, the highest of the modern era. (Fig. 1.)
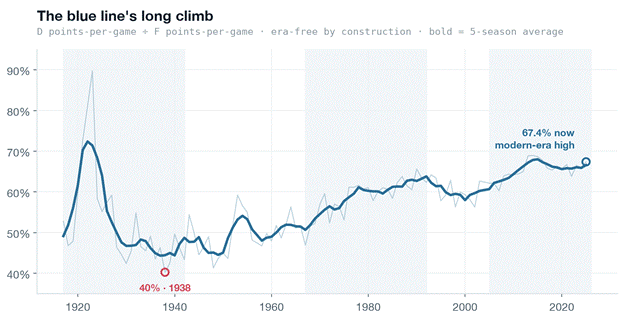
Figure 1
Think about what that means for your league. A modern defenseman produces two-thirds of a forward’s offense while occupying a quarter of the roster, and most fantasy leagues still price defensemen off memories of a 50% world. If your league settings or your league mates’ instincts haven’t caught up to this chart, there’s your edge, and it isn’t subtle.
The incredible shrinking goalie
Now put all three positions on the aWAR scale and ask who owns the league’s value. (Fig. 2.) Goalies peaked near 20% of all value in the wartime 1940s. Today they hold about 9%. The share has been cut in half, and the slide has been nearly continuous for eighty years.
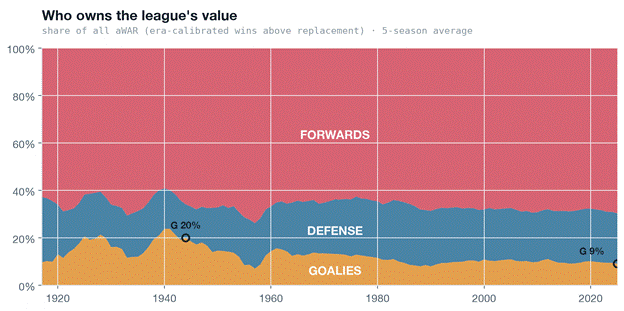
Figure 2
Goaltending didn’t get worse. It got uniformly good, which for fantasy purposes creates almost the same problem. League save percentage might be the most misread stat of the century. People assume it climbed steadily as the craft improved, but it actually traces a U: .919 in 1955, down to a trough of .873 in 1981, back up to .915 by 2015, and now sliding again to .896, the loosest netminding in three decades. (Fig. 3.) Through every arm of that U, the spread between starters kept compressing. Once every team’s goalie stops pucks at more similar rates, the position stops separating NHL teams, and it stops separating fantasy rosters too. Goalie scarcity is roster-slot scarcity rather than talent scarcity. This is the statistical spine behind the old “don’t pay up for goalies” instinct, and it’s half the reason the aging column treats goalies as their own strange species.
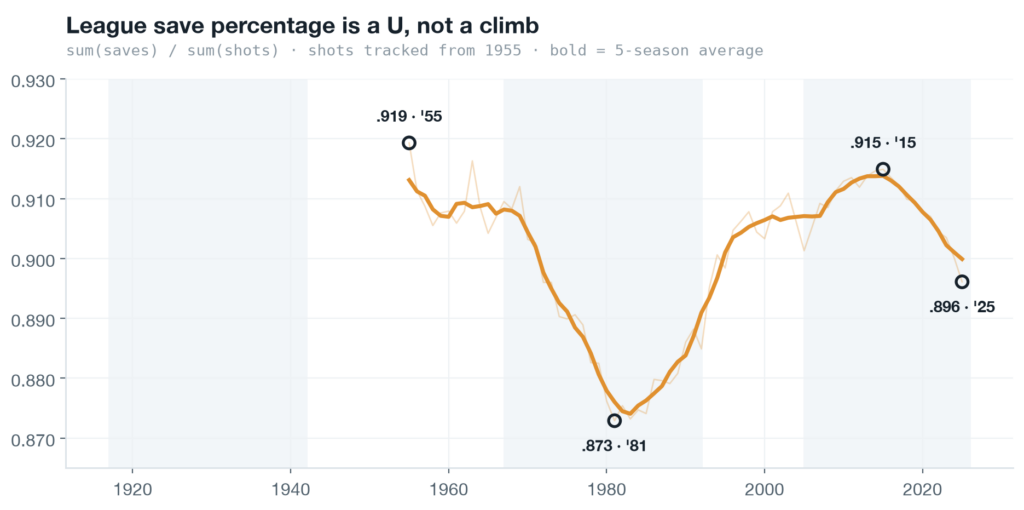
Figure 3
The body in the crease tells the same story from another angle. In 1917 the average goalie stood 69.2 inches tall, the same as the forwards around him. He now stands 75.0 inches, the tallest player type on the ice and a full two inches over the average forward. A position that was once a brave man in a sweater is now a selected-for phenotype executing a converged technique, which is exactly what a collapsing spread between starters looks like from the outside.
Scoring and value disagree about age
One more finding, as a bridge to the next column. In raw points, forwards and defensemen peak at the same age, 26. In wins above replacement, forwards peak at 24, and by age 35 a defenseman still holds about 52% of his peak value while a forward holds about 39%. Same players, same seasons, different question. Points ask how much a player produced. Value asks how much of that production a replacement couldn’t have provided. The gap between those two questions is where keeper-league mistakes live, and it gets the full treatment next week, with peaks, survivorship, tiers, goalies, and honest confidence intervals.
The fine print
Every chart in this series marks its own coverage: Points run complete from 1917, manpower splits exist from 1933, and shot counts (which means save percentage) from 1955. There is no 2004-05 season because there was no 2004-05 season. Position is tagged on 99.98% of skater rows.
Every number here is era-normalized by construction, validated against an external standard, and traceable to a chart you can see. That’s the bar. The next time someone quotes you a raw cross-era comparison, or prices a defenseman like it’s 1995, or pays up for a safe veteran goalie, you’ll know exactly what to ask them.
Data: NHL official league totals, 1917-18 through 2025-26, regular season. aWAR validated against Hockey-Reference Point Shares (r = 0.91 to 0.93 across three eras). Methods documented in the series methodology notes.
Related Posts

Starting Goalies



Top Skater Views
| Players | Team | |
|---|---|---|
| ROOPE HINTZ |
 DAL DAL | |
| ALEX LAFERRIERE |
 L.A L.A | |
| LUKE HUGHES |
 N.J N.J | |
| OWEN TIPPETT |
 PHI PHI | |
| KEVIN FIALA |
L.A
| |
Top Goalie Profile Views
 CBJ
CBJ MIN
MIN UTA
UTA



LINE COMBOS
| Frequency |
 WSH Players WSH Players
| |
|---|---|---|
| 18.4 | CONNOR MCMICHAEL RYAN LEONARD HENDRIX LAPIERRE | |
| 18.1 | DYLAN STROME ALEX OVECHKIN ANTHONY BEAUVILLIER | |
| 16.0 | TOM WILSON ILYA PROTAS ALIAKSEI PROTAS | |
DobberHockey Podcasts

Keeping Karlsson: The 2026-27 Keeping Karlsson Breakfast Club
Don’t you forget about them! Elan and Brian remind you of at least one player on each NHL team whose name you might forget to consider at the draft table.

Fantasy Hockey Life: Tampa Bay Lightning with Erik Erlendsson
Erik Erlendsson joins the program to discuss the Tampa Bay Lightning. Jesse and Victor ask about pros Nikita Kucherov, Jake Guentzel, Brandon Hagel, Brayden Point, Anthony Cirelli, Ilya Mikheyev, Gage Goncalves, Conor Geekie, Benjamin Rautiainen, John Carlson, Victor Hedman, Charle-Edouard D’Astous, Andrei Vasilevskiy, Jonas Johansson, and Dennis Hildeby. In Cat’s instincts, Cat Silverman of InGoal […]
Fantasy Hockey Life: New York Rangers with Colin Stephenson
Colin Stephenson joins the program to discuss the New York Rangers.
Keeping Karlsson: Matchup Maximizer Schedule Deep Dive
Elan is joined by the Keeping Karlsson Accountability Czar Trev to take a deep dive into the NHL schedule for next season and how it should affect our drafting decisions.
Fantasy Hockey Life: Carolina Hurricanes with Ryan Henkel
Ryan Henkel joins the program to discuss the Carolina Hurricanes. Jesse and Victor ask about pros Sebastian Aho, Seth Jarvis, Andrei Svechnikov, Nikolaj Ehlers, Jackson Blake, Logan Stankoven, Jordan Staal, Bradly Nadeau, Felix Unger Sorum, Shayne Gostisbehere, K’Andre Miller, Alexander Nikishin, Sean Walker, Brandon Bussi, and Pyotr Kochetkov. In Cat’s instincts, Cat Silverman of InGoal […]