

Analytics Advantage: The Disappearance of the 60-Start Goalie and New Goaltending Trends
Stas Pupkov
2026-07-31
There is a number on your goalie board this fall that you should stop believing in: 60 starts. Nobody in the NHL projects to get there. Karel Vejmelka led the entire league last season with 63, a figure that wouldn’t have cracked the top ten in 2007-08: the year Evgeni Nabokov and Martin Brodeur both started 77 games, Miikka Kiprusoff started 76, Ryan Miller started 75, and 13 goalies cleared 60 without anyone finding it remarkable.
Last season, exactly one did. The workhorse goalie, the guy you drafted in the third round precisely because he’d bank you 65 starts and 35 wins while you slept, is functionally extinct.
The obvious explanation is the one you’ve heard on every broadcast: modern goaltending is too demanding, workloads break goalies down, and smart teams learned to protect their investment. It’s a tidy story, and as far as the numbers can see, it’s mostly wrong. The workhorse didn’t die of fatigue. He was retired on principle, and the reason he was retired changes how you should draft goalies this fall.
Four Terms, Quickly
A start means being in net at puck drop, and start share is a No. 1’s starts divided by his team’s games. GSAx is goals saved above expectation: save results adjusted for the quality of the shots a goalie faced, from my expected-goals model. Pro-rated starts scale the lockout and COVID seasons to 82 team games so every era compares fairly.
What Died, and What Didn’t
Start with the shape of the thing, because the shape is the story.
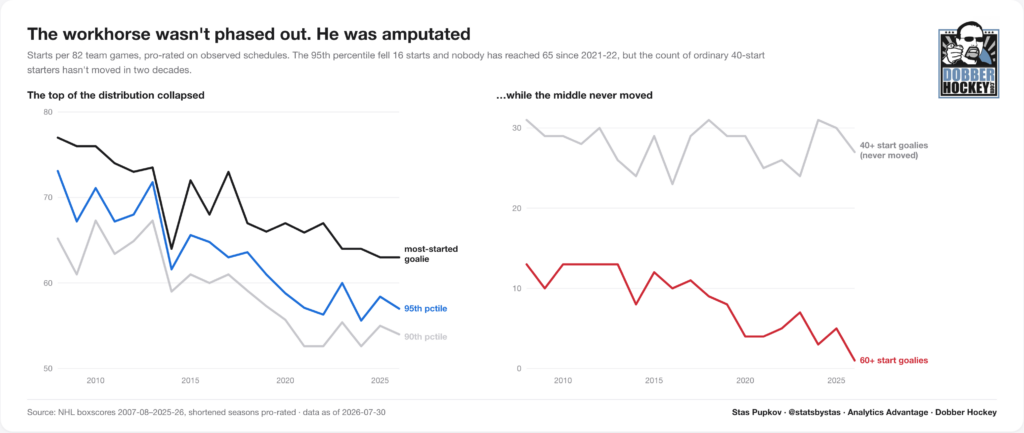
The decline is real, and it isn’t a schedule artifact: pro-rate the 48-game 2012-13 season and it lands exactly in line with its neighbors. But the decline is not where you think it is. The 95th percentile of goalie workload fell from 73 starts to 57. The 90th fell from 65 to 54. The most-started goalie in the league fell from 77 to 63, and 2021-22 was the last season anyone reached 65.
Meanwhile, the ordinary starter is doing fine. The number of goalies making 40 or more starts was 31 in 2007-08 and 27 last season, and it has wobbled between 23 and 31 for two straight decades without ever trending (no detectable drift, p = 0.61, and that’s from the same test that flags the tail’s collapse at p = 3×10⁻⁵, so it isn’t for lack of power). The starter’s job is perfectly intact. What the league amputated is the extreme version of it.
The 100-Year Version
Zoom all the way out (the league’s records run back to 1917-18, and they track starts the whole way) and the modern decline turns out to be the third act of a much older play. The second act is not the one I expected to find.
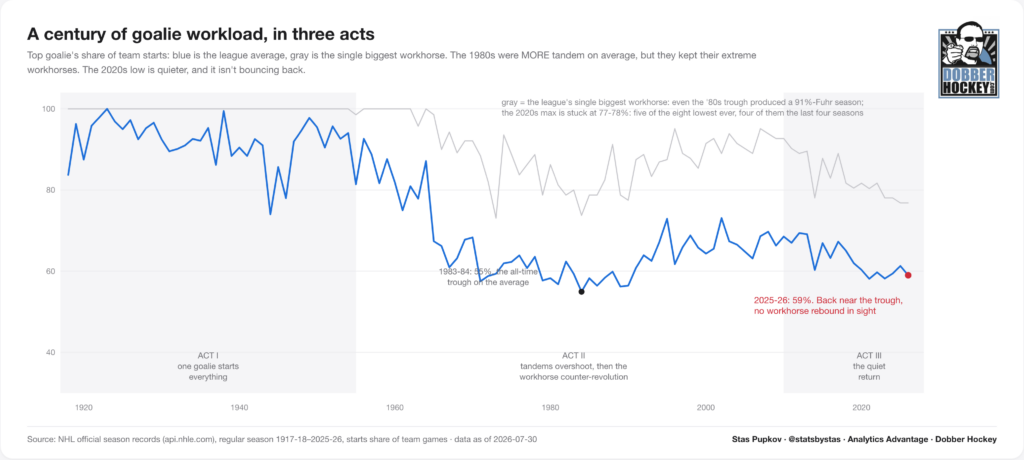
From 1917 to the mid-1950s, the most-used goalie started nearly everything: about 9/10 team games in a typical season, and frequently all of them. Then the tandem revolution arrived, and it overshot. By the early 1980s the average top-goalie share had fallen to 55 percent, the all-time low, in the age of the Grant Fuhr/Andy Moog-style platoon. What followed was a workhorse counter-revolution: Roy, Brodeur and the dead-puck-era horses dragged the league average back past 73 percent by 2001-02.
The 2020s are the third act: back down to 59 percent, within shouting distance of the all-time trough. But this act differs from the first trough in one crucial way. Even at peak platoon, the 1980s kept producing extreme workhorses: Grant Fuhr started 91 percent of Edmonton’s games in 1987-88 while the rest of the league rotated. Today there is no Fuhr. The single biggest workload in the league has been stuck at 77-78 percent of team starts for four straight seasons, five of the eight lowest league-leading figures ever recorded. The ’80s trough was a fashion the workhorse survived. This one is a policy he didn’t.
The Autopsy: Fatigue Has an Alibi
Here’s where the folk theory falls apart. If coaches cut workloads because workloads were hurting results, the damage should be visible in the games. I went looking for it, comparing every goalie against his own season baseline so that talent, team and era wash out. Two findings.
First, the back-to-back penalty, the most repeated piece of goalie folklore in fantasy, is nowhere to be found in 19 seasons of games. A goalie starting on consecutive nights stops at his usual rate: two hundredths of a save-percentage point above his norm, in fact. To build the noise floor I re-dealt each goalie’s schedule a thousand times, and the real back-to-back effect never once outgrew the random shuffles, in any era (permutation p = 0.80). (Team back-to-backs with travel are a separate question; the goalie-level rule has no empirical basis.)
Second, heavy sustained workload does carry a cost: a real one, and a tiny one. A goalie making his fourth or fifth start in 14 days stops about two-tenths of a save-percentage point worse than his rested self, a gap that survives controlling for hot and cold streaks and shows up in every era I can split (95% CI −0.31 to −0.09, p < 0.001). That is a genuine effect. Now price it: two-tenths of a point on 28 shots is a twentieth of a goal, and even a workhorse makes only a minority of his starts on that kind of load. Add it up over a season and the entire fatigue tax lands at one or two goals. Two goals is not a reason to end a role.
One warning: riding the hot hand manufactures a fake freshness effect. Goalies coming off hot stretches give back a third of a point to plain regression, so until you control for recent form, rest looks magical. It isn’t.
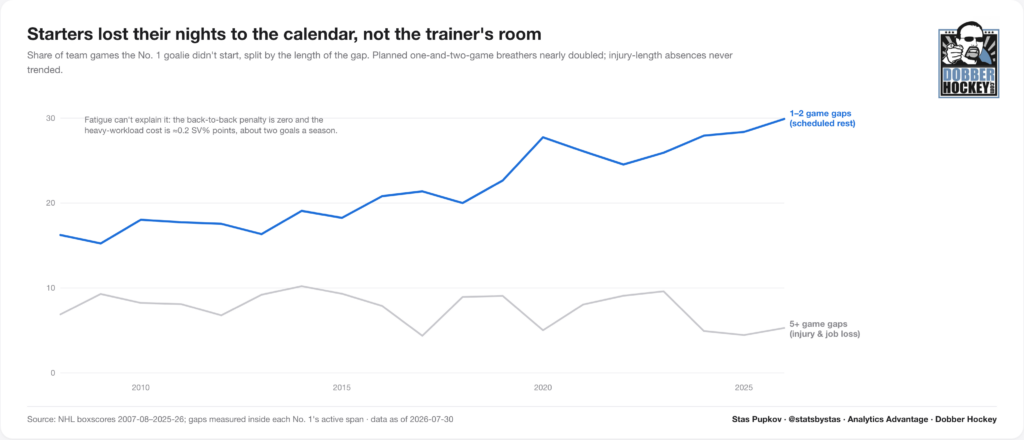
So why did the workload collapse? Everything measurable points at choice rather than circumstance. Nights the No. 1 didn’t start now come overwhelmingly from one-and-two-game gaps, the signature of scheduled rest rather than injury, and those have nearly doubled: from 16 percent of team games in 2007-08 to 30 percent last season (trend p = 1e-08), while injury-length absences show no trend at all (p = 0.51). And teams removed the heaviest usage pre-emptively, whatever the evidence said: starts made on six-plus games of trailing 14-day work (a heavier load than the four-to-five-start window I measured above) fell from roughly one-fifth of all starts to roughly 1 in 20.
The rotation is a decision, not a diagnosis. Three fair objections up front. Coaches pick which second nights their starter takes, so part of the back-to-back null may be good scheduling rather than no effect, though if you’re deciding whether to bench your goalie on a night his coach already chose to start him, that cuts your way. The heavy workload estimate leans on the older seasons, because the exposure barely exists anymore. And injury risk and playoff freshness are real possibilities that regular-season save percentage cannot price; I won’t pretend to rule them out. What I can say is that the measurable cost of the workhorse was about two goals a season, and the league walked away from him anyway.
No Team Has a Goalie Philosophy
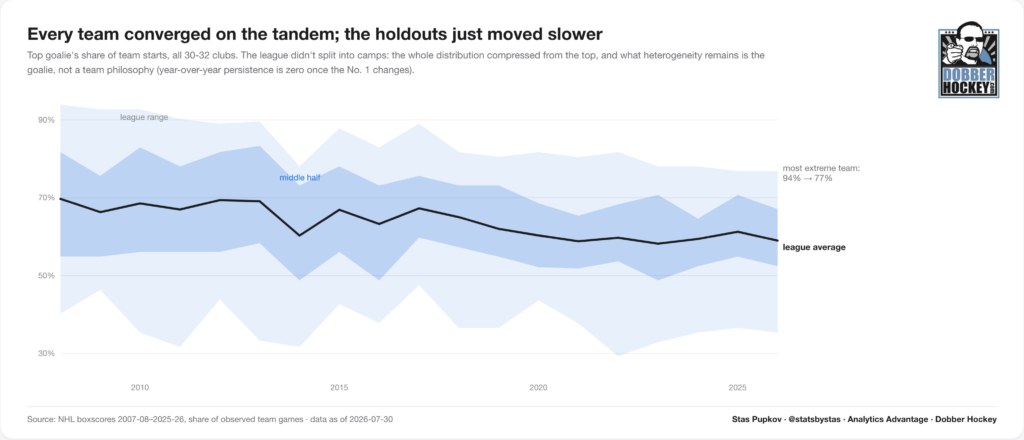
The best-studied goalie decision in hockey, pull timing, shows teams keeping their habits for years: the recent LINHAC paper on goalie pulls by Saif Al-Din Ali and Hanan Mohamed found aggressive and conservative franchises holding their distance season after season. Goalie usage did the opposite: the whole league converged. The spread between teams compressed from the top (the most extreme team fell from 94 percent of games to 77) and the average slid with it. Running a tandem isn’t a strategy some teams chose. It’s the water.
What heterogeneity remains has a simple explanation, and it isn’t culture. The teams still riding one goalie are simply the teams with elite goalies: the Nashville Predators with Juuse Saros, the Winnipeg Jets with Connor Hellebuyck, the Tampa Bay Lightning with Andrei Vasilevskiy, the New York Islanders with Ilya Sorokin, the New York Rangers with Igor Shesterkin, and the Utah Mammoth with Vejmelka. And those clubs pay their No. 1 in fantasy’s favorite currency: 69 to 75 percent of all team wins.
Here is the statistic that should change your draft prep: year over year, a team’s start share correlates at 0.32 when the same No. 1 returns, and is statistically indistinguishable from zero when he changes (the estimate is 0.00, and with 219 team-seasons the error bars run about ±0.13; the same-versus-new contrast itself is p < 0.001). Teams don’t have goalie philosophies; they have goalies. When the man changes, the team’s usage history tells you nothing about what comes next. And usage is earned live: a starter’s share tracks his current-season GSAx (a per-hour rate, so raw volume can’t fake it) more strongly in every era, with r climbing from 0.19 to 0.29, while last season’s quality barely predicts it at all. Reputation buys fewer starts than drafters assume.
Next week, we’ll take what we’ve found here and apply it to the coming 2026-27 fantasy hockey season.
One Comment
Leave A Comment
You must be logged in to post a comment.
Related Posts
Starting Goalies



Top Skater Views
 S.J
S.J ANA
ANA VAN
VAN

Top Goalie Profile Views
| Players | Team | |
|---|---|---|
| JOEL HOFER |
 STL STL | |
| CARTER HART |
 VGK VGK | |
| SCOTT WEDGEWOOD |
 COL COL | |
| JAKUB DOBES |
 MTL MTL | |
| DEVON LEVI |
 EDM EDM
| |
LINE COMBOS
| Frequency |
EDM Players
| |
|---|---|---|
| 24.7 | VASILY PODKOLZIN CONNOR MCDAVID LEON DRAISAITL | |
| 19.8 | MATHIEU JOSEPH ALEX FORMENTON COLTON DACH | |
| 16.3 | WILLIAM NICHOLL OWEN MICHAELS SETH GRIFFITH | |
DobberHockey Podcasts

Fantasy Hockey Life: New Jersey Devils with James Nichols
James Nichols joins the program to discuss the New Jersey Devils. Jesse and Victor ask about pros Jack Hughes, Jesper Bratt, Nico Hischier, Timo Meier, Connor Brown, Arseni Gritsyuk, Anthony Mantha, Dougie Hamilton, Luke Hughes, Jake Allen, David Rittich, and Nico Daws. In Cat’s instincts, Cat Silverman of InGoal magazine joins to discuss prospect goalies […]
Fantasy Hockey Life: Nashville Predators with Emma Lingan
Emma Lingan joins the program to discuss the Nashville Predators

Keeping Karlsson: The 2026-27 Keeping Karlsson Breakfast Club
Don’t you forget about them! Elan and Brian remind you of at least one player on each NHL team whose name you might forget to consider at the draft table.
Fantasy Hockey Life: Tampa Bay Lightning with Erik Erlendsson
Erik Erlendsson joins the program to discuss the Tampa Bay Lightning. Jesse and Victor ask about pros Nikita Kucherov, Jake Guentzel, Brandon Hagel, Brayden Point, Anthony Cirelli, Ilya Mikheyev, Gage Goncalves, Conor Geekie, Benjamin Rautiainen, John Carlson, Victor Hedman, Charle-Edouard D’Astous, Andrei Vasilevskiy, Jonas Johansson, and Dennis Hildeby. In Cat’s instincts, Cat Silverman of InGoal […]
Fantasy Hockey Life: New York Rangers with Colin Stephenson
Colin Stephenson joins the program to discuss the New York Rangers.
Dude, why do all of your articles read like AI slop? There’s obviously good data underlying it, but I read another sentence like “This isn’t x….it’s y”, I’m out.