

Analytics Advantage: The Draft Cost of Power Play Roles for Stone, Zibanejad, Nugent-Hopkins, Dobson, and More
Stas Pupkov
2026-09-11
Noah Dobson and Shea Theodore are going three picks apart in Fantrax drafts this month. Dobson is the 24th defenseman off the board at an ADP of 94; Theodore is the 25th at 97. Both spent last season on their team’s second power-play unit, Dobson behind Lane Hutson in Montreal, Theodore behind the five-forward top unit Vegas frequently used. Both offer the possibility of a larger power-play role, but their prices require different things.
Dobson is the 14th-ranked defenseman in my projections at second-unit minutes and the 8th at top-unit minutes, so his price is covered before the top unit enters the conversation. Theodore is the 35th defenseman at second-unit minutes and the 15th at top-unit minutes. His price only clears if he wins the job the summer chart says he holds today, and Vegas has an open spot after Pavel Dorofeyev‘s departure that either Theodore or Rasmus Andersson could take. Nothing there is settled until camp.
A draft price is a bet on a role. The question this week is not whether a player keeps his power-play job, but what is left if he does not.
What a Power-Play Job is Worth
A definition first, because the rest depends on it. “PP1” here means the five skaters with the most 5-on-4 minutes per game on their team across a season, and “PP2” the next five. It is a usage classification built from ice time, not a coach’s chart, and it blurs injuries, trades and midseason changes. When I say a player kept or lost PP1, I mean he did or did not retain that classification the following season.
The scoring here is the Yahoo points preset: 6 for a goal, 4 for an assist, 2 for a power-play point, 0.9 per shot on goal, 1 per block. In that league a first-unit forward draws a median 33% of his fantasy points from the power play, with the middle half of players between 28% and 38%. First-unit defensemen draw 30%. Second-unit forwards draw 21%, second-unit defensemen 17%. Outside both units the share is close to zero.
A first-unit job is more minutes at a higher rate, 2.28 a game against 1.55 and 0.121 power-play points per minute against 0.067, with an additional bonus for power-play goals and assists.
Those jobs move. Roughly one-quarter of first-unit players do not retain that classification the following season (76.5% of PP1 forwards do, 71.9% of defensemen), a figure that includes players who left the sample. That is retention of a usage classification, not job security, but it is the base rate a drafter is betting against.
The observed cost is large: forwards who went from PP1 to PP2 (183 cases since 2016-17, 41+ games both seasons) lost a median 87 fantasy points per 82 games. But that includes everything else that happened to them; the same group lost 26 non-power-play points too. Demotions are not random: slumping players get demoted. The 87 is what happens to demoted players, not the price of the role by itself.
So, the model does something narrower. It takes the player’s non-power-play production from the season projection and builds the power-play part separately, from his own rate of power-play points per minute over the past three seasons (adjusted for which unit he was on), at the minutes a first-unit or second-unit slot carried on his upcoming team last season, blended with league averages; his own minutes for the role he actually held. Second-unit minutes produce 0.80 of top-unit minutes per minute. Every power-play number in this piece, a player’s current role included, comes from that one method. The non-power-play part carries one more adjustment: a check of the projection against eight seasons of results found it underrated players under 27 and overrated players over 30, by 40 to 45 points per 82 games at the extremes, so that part is scaled by an age curve estimated on earlier seasons only. Moving the 0.80 across the historical range, 0.76 to 0.85, changes none of the eight calls below.
The Role Ladder
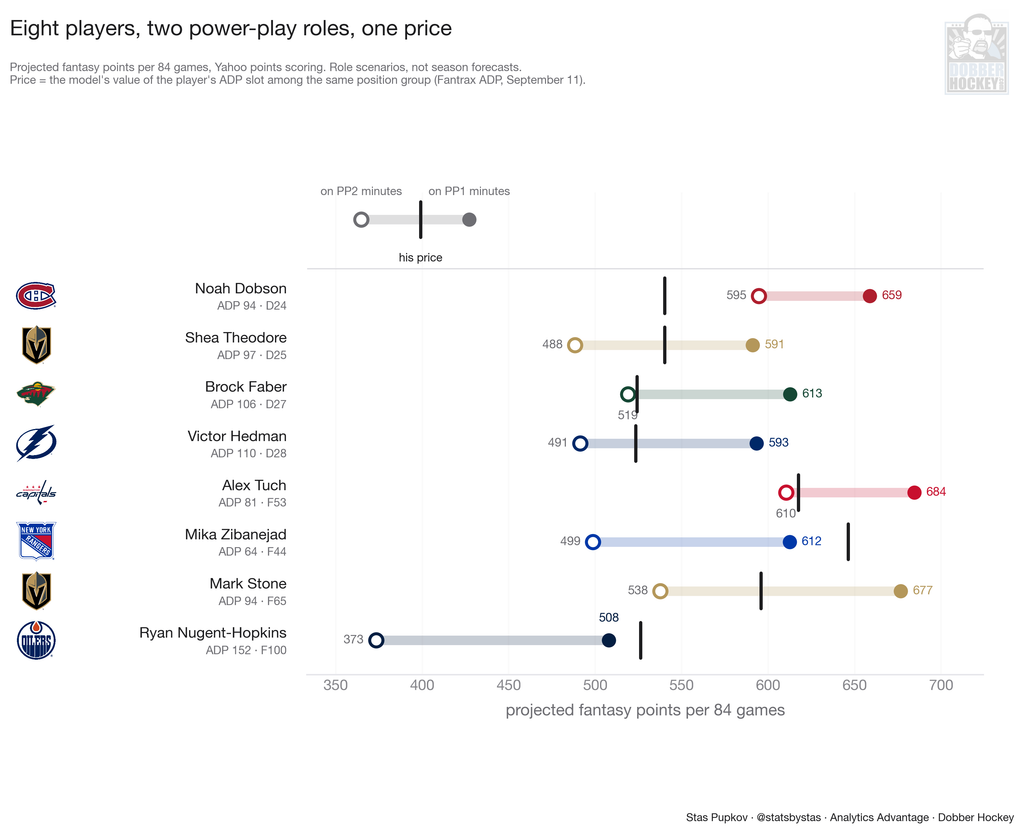
Figure 1. Each player’s projected fantasy points per 84 games on second-unit minutes (hollow dot) and first-unit minutes (solid dot), with the black tick at what a player drafted at his slot is usually worth. Role scenarios, not season forecasts. ADP: Fantrax, September 11; scoring: Yahoo points.
Each row is one player. The hollow dot is his projected points on second-unit minutes, the solid dot on first-unit minutes, and the black tick is what a player drafted at his slot is usually worth in this scoring, compared among forwards or among defensemen. (Fantrax ADP pools every league format; comparing within position limits that problem without removing it.)
The rule is simple. If the hollow dot reaches the tick, he is worth his price on the second unit and the top unit is a bonus. If only the solid dot reaches it, his price needs the top unit. All eight calls survive the tested multiplier range and an availability adjustment that fills expected missed games at replacement level. One caution: the dots are production per 84 games under a role, not a forecast of what anyone will bank.
The power-play component was tested on historical seasons using only information available beforehand. Among 148 forward seasons involving a move from PP1 to PP2, its average absolute error was 4.3 power-play points per 82 games, compared with 4.8 for a simple group-rate benchmark. Results for defensemen were comparable to that benchmark. These tests support using the estimates as conditional role scenarios; they do not establish what demoting any particular player would cause.
Six Players in Three Comparisons
Faber and Hedman. Brock Faber goes at 106 (27th defenseman), Victor Hedman at 110 (28th). Both were second-unit defensemen last season after years on the top unit, and both look like Dobson at a glance. Neither is. Faber lands 29th at second-unit minutes against a 27th-defenseman price and 14th at top-unit minutes, so he needs the job. Hedman lands 34th on the second unit against a 28th price and 15th on the top unit, and his top-unit case is the weaker of the two: John Carlson was signed to replace Darren Raddysh on Tampa’s first unit, the Fantasy Guide has Hedman at 41 points and calls him boom or bust, and he is 35 years old. Faber at least has the second unit to himself in Minnesota. Both are top-unit bets priced as if the second unit were enough.
Tuch and Zibanejad. Alex Tuch goes at 81 (53rd forward) on a new team, the Washington Capitals, alongside Jordan Kyrou and Boone Jenner. His second-unit role in Buffalo is his baseline, and it lands seven points short of the price: 58th forward at second-unit minutes against a 53rd-forward price, 34th at first-unit minutes next to Alex Ovechkin. That is a small, model-dependent difference, not a verdict; a shortfall of that size should inform the pick, not dictate it. Mika Zibanejad goes at 64 (44th forward) after leading the Rangers with 35 power-play points, and that is the point: his price is a first-unit price with a premium on top. At first-unit minutes he ranks 57th, 13 forward ranks below his price; at second-unit minutes he is the 113th forward. Tuch’s gap between the two roles is 74 points per 84 games; Zibanejad’s is 114.
Stone and Nugent-Hopkins. Mark Stone goes at 94 (65th forward). He needs the top unit, 35th forward there against 96th on the second unit, and he needs to play: the historical-games formula gives him 64 expected games because his recent seasons have been short, and even after that adjustment his top-unit rank, 39th, stays inside the price. Ryan Nugent-Hopkins goes at 152 (100th forward) and is a role-dependence example rather than a bargain. At first-unit minutes he is the 109th forward, nine ranks short of a 100th-forward price; at second-unit minutes he is the 205th and projects below the starting-center replacement level in a 12-team, two-center format. At pick 152 you are drafting a bench center whose whole case is the Edmonton top unit; whether he is worth that spot on the second unit depends on bench size, eligibility and what the waiver wire offers.
The eight names mentioned thus far are the clearest cases. Figure 2 shows the 20 players between picks 31 and 160 whose price needs the top unit and who have the most to lose on the second unit, in draft order; Figure 3 shows the full list whose price holds on the second unit. Same dots, same tick, same rule as Figure 1.
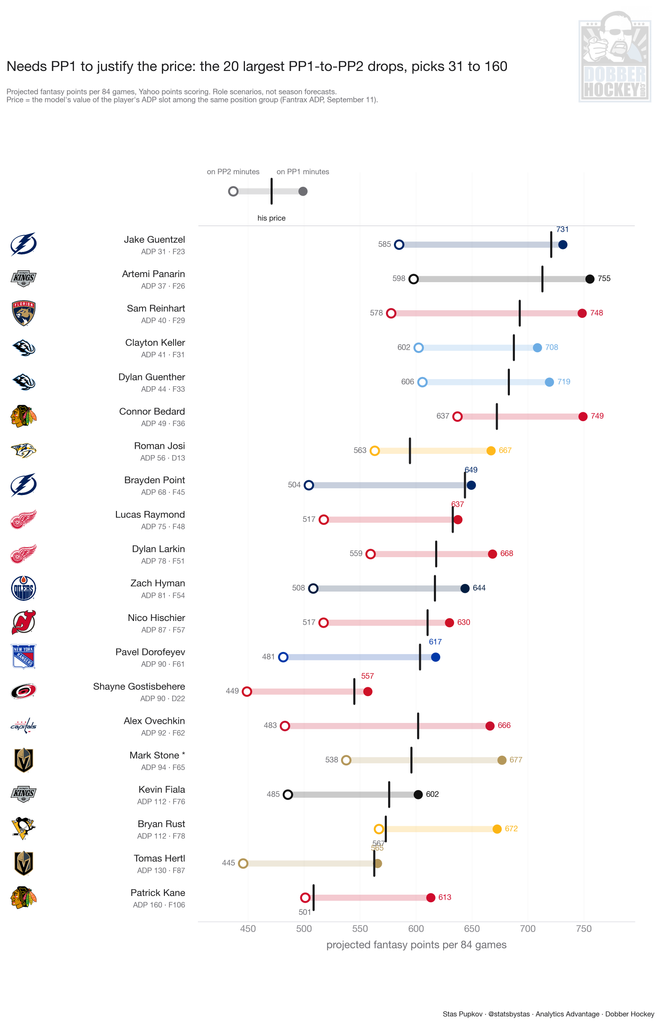
Figure 2. Among players drafted from picks 31 to 160 who need PP1 to justify their price, these 20 have the largest projected PP1-to-PP2 drops. Shown in draft order. Asterisks mark players discussed in the text.
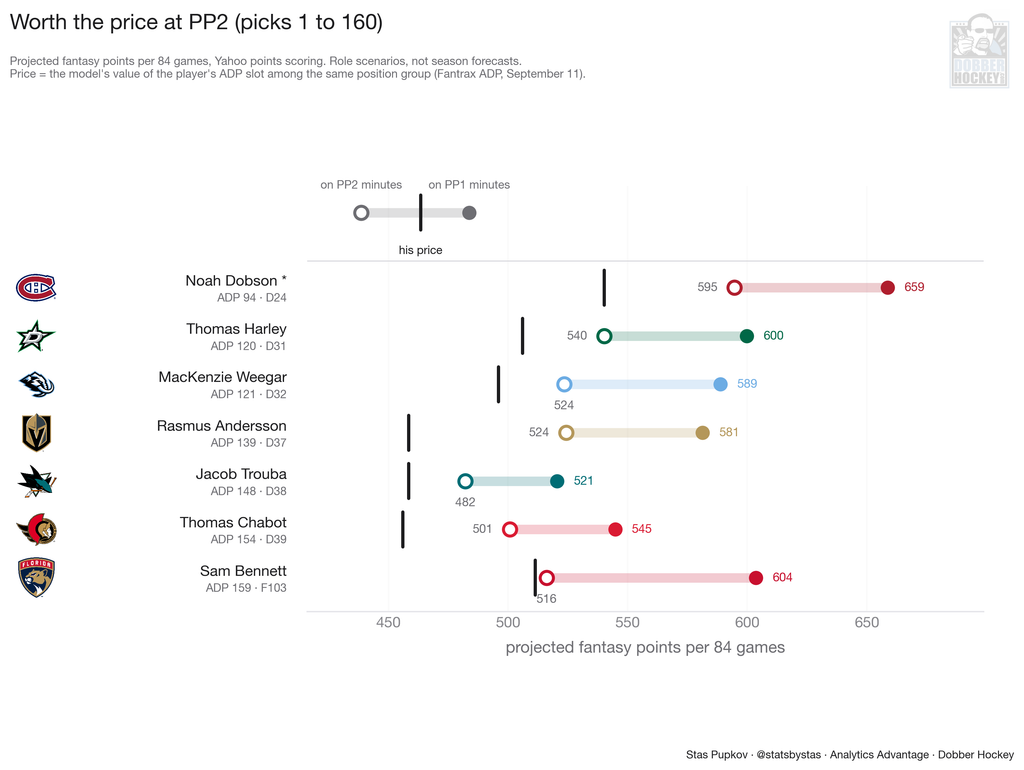
Figure 3. Picks 1 to 160: players whose price is reached by the hollow dot, in draft order. The solid dot is what the top unit would add.
A Condition, Not a Warning
Needing PP1 is a condition attached to the price, not a reason to avoid the player. Stone’s modeled value clears the price under the first-unit scenario; Tuch’s misses the second-unit bar by a small, model-dependent difference. A camp assignment does not settle deployment, health or the projection, and the full totals and the price comparison rest on more than the power-play test above. What the reader gains is knowing which picks carry that condition and which, like Dobson, do not.
Two checks anyone can run: the published power-play units in the first week of camp, then the 5-on-4 minutes over the first ten games as a checkpoint on deployment, not a verdict on scoring.
For the eight:
• Price holds on the second unit, top unit is the bonus: Dobson.
• Price needs the top unit, so check the camp units before you pay it: Theodore, Faber, Stone, Hedman, whose top unit has Carlson on it, and Tuch, by seven points.
• Short of the price even on the top unit: Zibanejad by 13 forward ranks, Nugent-Hopkins by nine, and on the second unit Nugent-Hopkins is a bench center.
About a quarter of this season’s first-unit players will not carry that classification next season. The charts tell you which of your picks depend on being in the other three-quarters.
Related Posts
Starting Goalies







Top Skater Views
 DET
 STL
 CHI
 BOS
Top Goalie Profile Views
 EDM
 MTL
 S.J
 WSH


LINE COMBOS
| Frequency |
 NYR Players | |
|---|---|---|
| 25.0 | MIKA ZIBANEJAD GABE PERREAULT PAVEL DOROFEYEV | |
| 19.3 | J.T. MILLER ALEXIS LAFRENIERE TYE KARTYE | |
| 16.6 | EELI TOLVANEN NOAH LABA WILL CUYLLE | |
DobberHockey Podcasts

Keeping Karlsson: Short Shifts – NHL Frozen Frenzy Recap
Elan and Lewis recap the Frozen Frenzy as well as two big returns and more!
Keeping Karlsson: Delusions of Garandeur
Elan and Brian dive into the latest NHL hot streaks, cold streaks, line changes, outjuries, injuries, buy-lows and sell-highs to give you top notch tips in your fantasy hockey league

Fantasy Hockey Life: TiDy Takes Part 2
Last week, Victor Nuno and Ryan Downey broke down trades from our top tier dynasty league. This week, they consider some dynasty trades from other divisions. Have a listen! Our show is part of the Dobber Podcast Network and sponsored by Fantrax.com. Email [email protected] and ask to join our free discord. Join our Patreon at […]
Keeping Karlsson: Matchup Maximizer 2026/27 Week 3
Elan takes a look at the schedule for the upcoming weeks of NHL action and recommends players with good schedules that you should consider streaming in to win your head to head matchups.
Keeping Karlsson: Short Shifts – Sharks Looked Like Celebweenies
Elan recaps the major injuries, outjuries, game results and changed line combos that we’ve seen since Sunday’s mega-show.