

Analytics Advantage: How Teams Score Their Goals Affects Their Fantasy Value for 2026-27
Stas Pupkov
2026-09-18
Same scoreboard, different engines
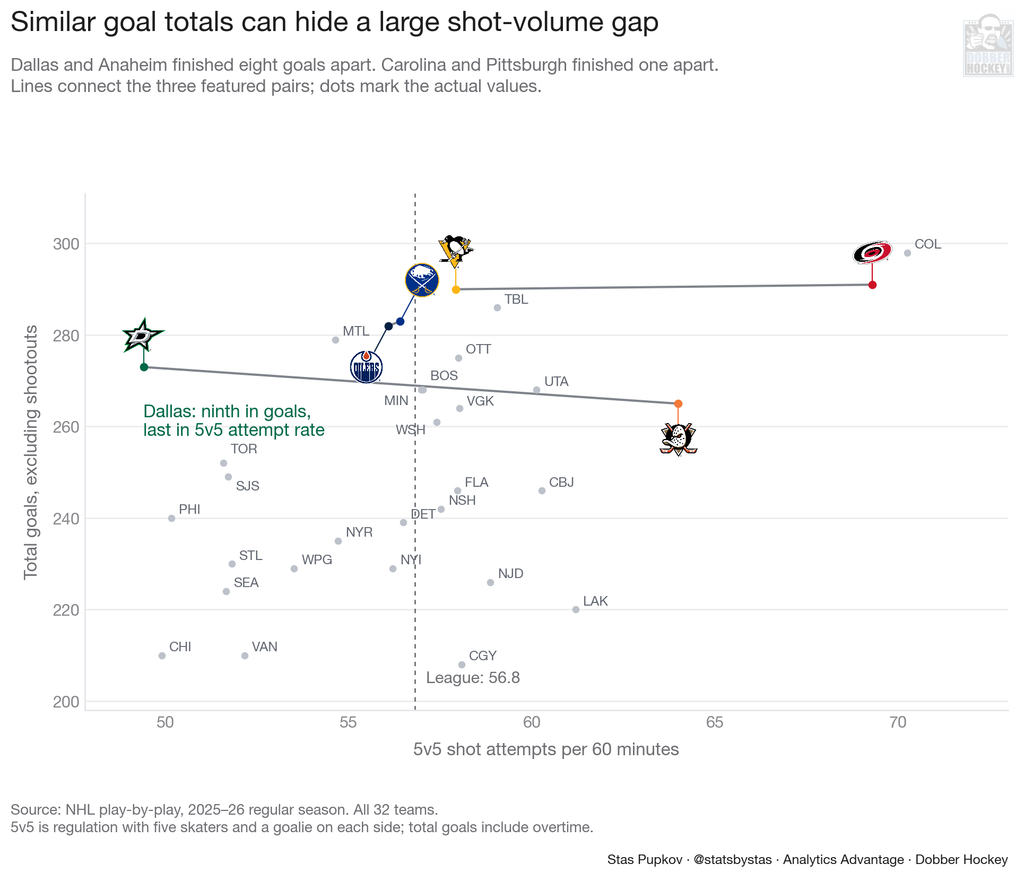
The Dallas Stars scored 273 goals last season and the Anaheim Ducks scored 265, and they got there from opposite ends of the shot chart. Dallas took the fewest 5v5 attempts in the league (five a side, both goalies in net, and in regulation time), 49.4 per 60 minutes against a league average of 56.8. Anaheim took the third-most, 64.0. The Carolina Hurricanes and Pittsburgh Penguins finished a goal apart, 291 and 290, with Carolina outshooting Pittsburgh by 11 attempts per 60 at 5v5. The Edmonton Oilers and Buffalo Sabres, 282 and 283, took attempts at similar rates but got different shares of their goals from the power play. The standings keep the total. A fantasy roster is built on what produced it.
[FIGURE 1]
Four dials
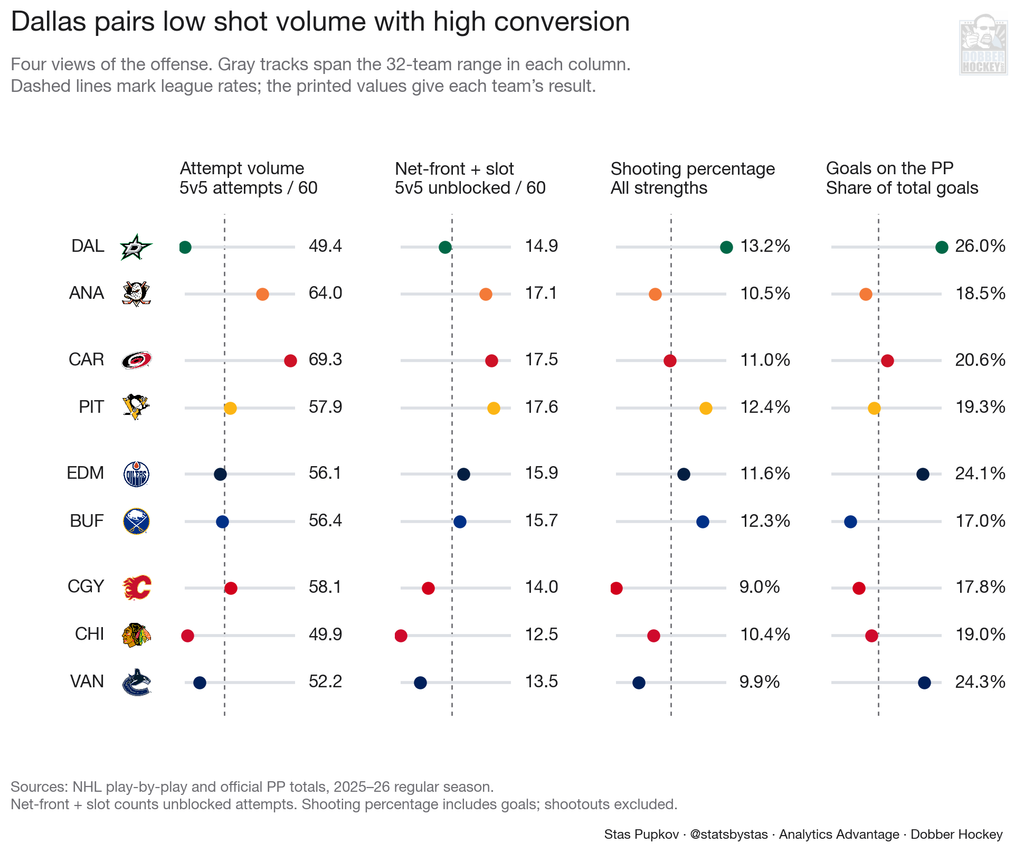
Goals per game are attempts per game, times the share of attempts that get past a defender, times the share that hit the net, times the share that go in. Two teams can post the same total with any mix of those four, and last season three pairs did. Figure 2 compares four measures for the three pairs and the three lowest-scoring teams: attempt rate and net-front rate at 5v5, then shooting percentage and power-play share across all strengths. Each measures a different part of the offense; they do not multiply into a single goal total.
[FIGURE 2]
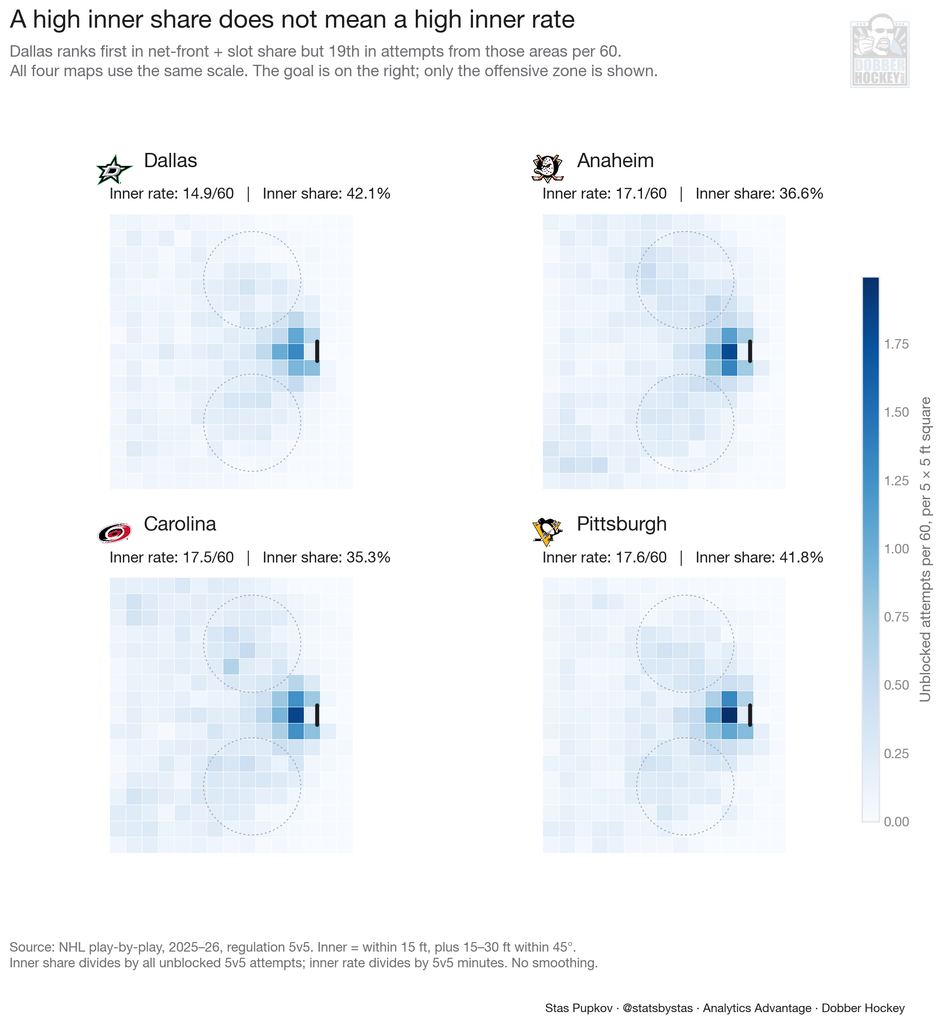
Dallas shows why shot share and shot rate need to be read together. The Stars had the league’s highest share of unblocked attempts from the net front and slot (within 15 feet, plus attempts 15 to 30 feet away within 45 degrees of straight ahead) and the 19th-highest rate of them, 14.9 per 60 against a league average of 15.3. Dallas concentrated a larger share of its unblocked attempts in those areas, but generated fewer of them per minute. Carolina and Anaheim produced 17.5 and 17.1 per 60, third and fourth in the league. Pittsburgh combined a share close to Dallas’s with the second-highest rate, as Figure 3 shows.
Dallas and Anaheim: 273 goals on the fewest attempts
Dallas’s 273 goals were ninth in the league and came on the lowest 5v5 attempt rate. The Stars’ attempt rate has fallen across the last three seasons, 63.4 to 58.5 to 49.4 per 60, and last season it sat 14.6 below Anaheim’s; the central 90 percent of gaps from 1,000 resamples of the schedule run from 11.9 to 17.5. Conversion and the power play made up the difference. Dallas scored on 13.2 percent of its shots on goal, best in the league, and 71 of its 273 goals came with the man advantage, a 26 percent share that also led the league. At 5v5 the two teams scored at nearly the same rate, 2.59 per 60 for Dallas and 2.62 for Anaheim.
Anaheim’s 265 came from volume. The Ducks took 64.0 attempts per 60 at 5v5, reached the net front at the fourth-best rate in the league, and scored on 10.5 percent of their shots on goal, 24th. Their 5v5 goals finished nine percent under expected. That gap moves around from season to season.
[FIGURE 3]
Figure 3 has Dallas, Anaheim, Carolina and Pittsburgh on the same rink at the same color scale. Dallas has less shot volume near the net than the other three. Its 42.1 percent inner share nevertheless leads the league because its overall unblocked volume is lower.
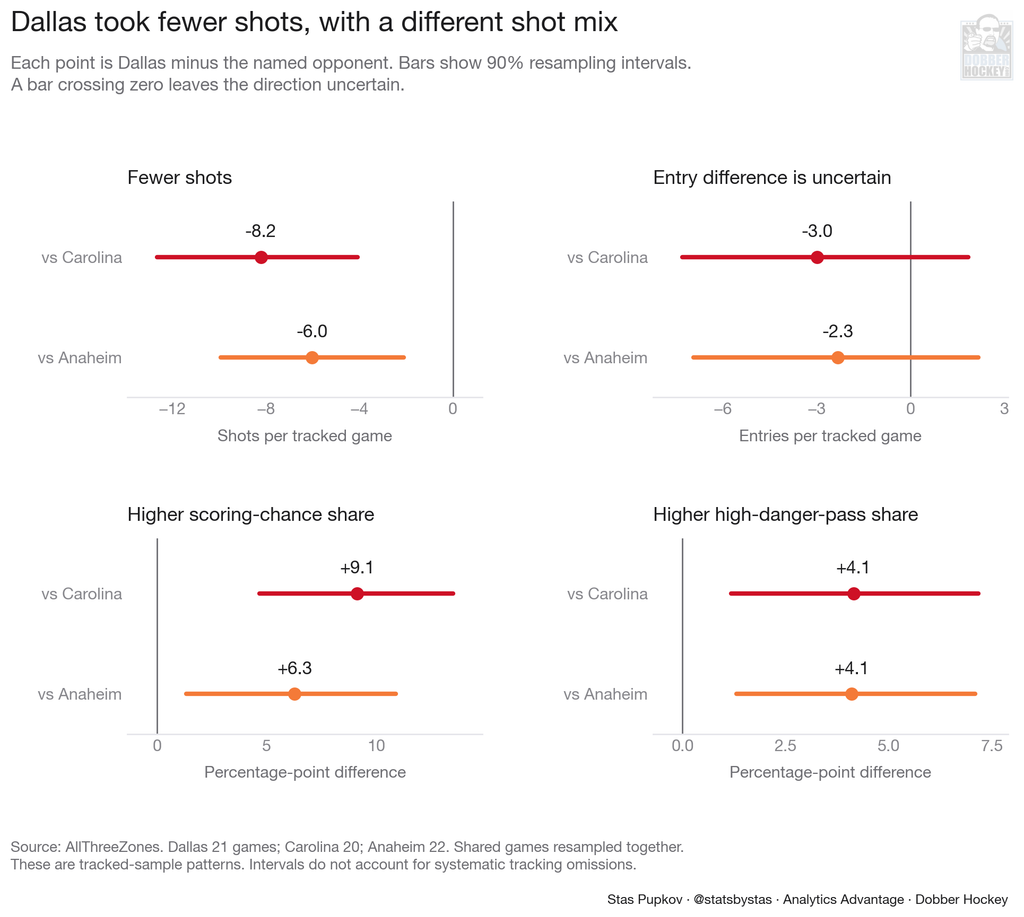
AllThreeZones tracked 21 Dallas games, 22 Anaheim games and 20 Carolina games, and the tracking records things the play-by-play does not: whether a shot followed a high-danger pass, whether it was coded as a scoring chance, and how the puck entered the zone. Across the study’s tracked team-games, the median ratio of ATZ shot counts to play-by-play unblocked 5v5 attempts is 0.88. That is a count comparison, not proof of which shots are missing. Tracking omissions may differ by team and shot type, so these patterns apply to the sample; the intervals below do not account for systematic omissions. In those games Dallas took 8.2 fewer 5v5 shots a game than Carolina and 6.0 fewer than Anaheim, and a bigger share of the ones it took came off a high-danger pass, 4.1 percentage points more than either team (the 90 percent interval runs from +1.2 to +7.2 against Carolina and +1.3 to +7.1 against Anaheim). Its scoring-chance share was 9.1 points above Carolina’s and 6.3 above Anaheim’s. Dallas also entered the zone less often, 3.0 and 2.3 fewer entries a game, but those two intervals include zero, so the entry difference could go either way.
[FIGURE 4]
Dallas’s highest-volume departure is Mavrik Bourque, traded to the Nashville Predators as free agency opened. He was fifth on the team in 5v5 attempts with 207, 6.4 percent of the Stars’ total; Jason Robertson led with 370. The only skater added who played in the NHL last year is Joel Kiviranta, 1.71 attempts a game with the Colorado Avalanche, and the camp chart does not have him on it. Glen Gulutzan is back. The returning leaders therefore matter more to this preview than the newcomer totals. The two fantasy numbers: Robertson’s 370 attempts and 45 goals survived a team-wide drop in volume, and Wyatt Johnston scored 25 of his 45 goals on the power play, making Johnston’s power-play role particularly relevant to his fantasy value.
Anaheim turned over more. Jacob Trouba, Olen Zellweger, Mason McTavish and Chris Kreider appear in the Ducks’ departure table, taking 998 5v5 attempts and 13 of the team’s 49 power-play goals with them (Kreider 8, McTavish 5). The additions who played in the NHL last year are A.J. Greer, 17 goals in 78 games for Florida and penciled onto the third line, and Nick Jensen on the third pair. Cutter Gauthier, 380 attempts and 41 goals, and Beckett Sennecke, 293 attempts with 118 from the net front, are what stays.
Carolina and Pittsburgh: 290 from opposite directions
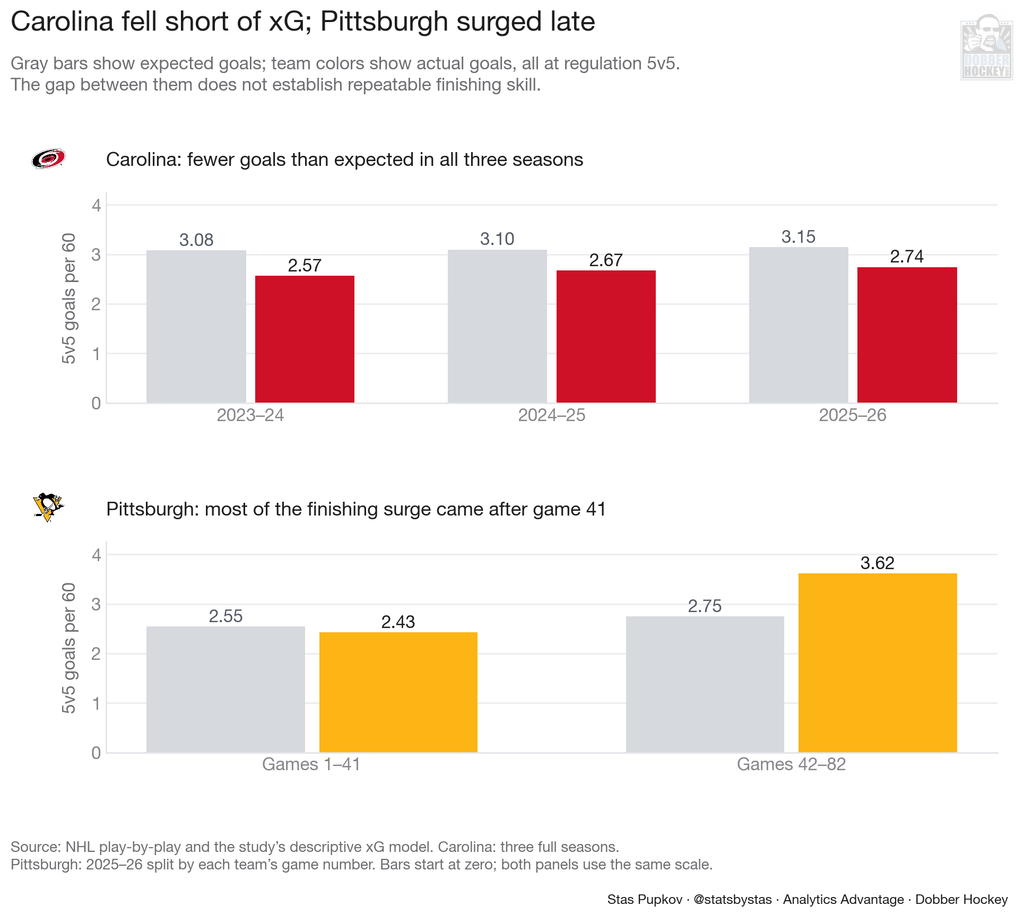
Carolina took 69.3 attempts per 60 at 5v5, second in the league, reached the net front at the third-highest rate, 17.5, and built the second-most expected goals, 3.15 per 60. It scored 2.74, 13 percent under expected, for the third season in a row below the model: 0.83, 0.86 and 0.87 goals per expected goal. Pittsburgh out-finished it by 0.27 goals per expected goal, a gap with a 90 percent resampling interval of 0.11 to 0.44 and shows up under two different expected-goal models scored on the same shots.
Pittsburgh got to 290 on a 13th-ranked attempt rate, 57.9 per 60, with the second-highest net-front rate in the league at 17.6 and the highest ratio of goals to expected goals, 1.14. The observed net-front rates, 17.5 and 17.6, are similar, with an uncertain difference: the 90 percent interval runs from 1.5 fewer to 1.3 more per 60. Their clearest contrasts are total attempt volume and goals relative to expected goals. The latter is a residual from the study’s descriptive model, rather than a measure of repeatable finishing skill.
[FIGURE 5]
Figure 5 shows how differently Carolina’s and Pittsburgh’s results developed. Through Game 41, the Penguins scored 2.43 goals per 60 at 5v5 on 2.55 expected. From game 42 on they scored 3.62 on 2.75. Attempts barely moved, 58.4 to 57.4, while net-front attempts moved from 17.1 to 18.0 per 60. Pittsburgh’s full-season 5v5 result combines an ordinary half with a hot one. That timing matters when judging the returning scorers.
Carolina’s only skater addition from outside is Pierre-Olivier Joseph, and Alexander Nikishin, 255 5v5 attempts from the blue line, is an unsigned restricted free agent who is not at camp. Frederik Andersen left for Edmonton. One of the league’s highest-volume teams has no incoming NHL forward scoring to add to this comparison. Pittsburgh lost Anthony Mantha, its top goal scorer with 33 and fourth on the team in 5v5 attempts, along with Noel Acciari (12 5v5 goals) and Parker Wotherspoon. They signed Andrei Kuzmenko, 13 goals in 52 games for the Los Angeles Kings, 8 of them on the power play, off meniscus surgery in February, and traded for Nick Robertson, 16 goals with the Toronto Maple Leafs. The camp chart has Kuzmenko on the first power-play unit and Robertson on the fourth line, but the chart is still labelled with last year’s date, so both are pencil. Bryan Rust, 29 goals and 106 net-front attempts, and Erik Karlsson, 323 attempts, are the volume coming back. Dan Muse is in his second year.
Edmonton and Buffalo: what a power play conceals
Edmonton scored 282 goals and 68 of them on the power play, a 24.1 percent share, fourth in the league (two of the 68 came in overtime). Per minute of power-play time nobody scored more: 11.9 goals per 60. At 5v5 the Oilers’ attempt rate has fallen across three seasons, 64.6 to 62.7 to 56.1, expected goals went with it, 3.44 to 2.69 per 60, and the 5v5 goal rate of 2.55 ranked 21st.
Buffalo scored 283 with 17 percent of them on the power play, 26th, and the fourth-highest 5v5 goal rate in the league, 2.94 per 60, 13 percent above expected. Buffalo’s 5v5 edge over Edmonton, 0.39 goals per 60, has an interval from 0.80 in Buffalo’s favor to 0.10 in Edmonton’s, so the two are not cleanly separated at even strength. What separates them is where the goals came from, and Edmonton’s three-year 5v5 slide does not need Buffalo to be visible. One caution on the power-play gap itself: its 90 percent interval excludes zero when I resample single games but includes zero when I resample whole weeks or fortnights of the schedule, so it is the softest of the pair contrasts here.
Edmonton changed coaches on June 23, Mike Babcock for Kris Knoblauch, and lost its 5v5 attempt leader, Darnell Nurse with 327, to San Jose, Jack Roslovic and his 21 goals to Toronto, and Adam Henrique and Curtis Lazar. The new skaters are Ryan Shea and Shakir Mukhamadullin on defense and Mathieu Joseph at forward. Connor McDavid‘s 323 attempts, 152 from the net front, and Evan Bouchard‘s 306 are still there. Buffalo lost Alex Tuch and his 33 goals in a sign-and-trade with the Washington Capitals and Bowen Byram to the Chicago Blackhawks, and brought in Olen Zellweger, 3.46 5v5 attempts a game in Anaheim, with Louis Crevier and Conor Sheary. Tage Thompson, 364 attempts and 40 goals, is the base.
The bottom three
The Calgary Flames, Chicago, and the Vancouver Canucks scored 208, 210 and 210, and there is less separating them than the tidy version would have. Calgary’s 5v5 attempt rate, 58.1 per 60 and ninth in the league, is well clear of Chicago’s 49.9 and Vancouver’s 52.2, and both gaps hold in resampling. Calgary also converted 9.0 percent of its shots on goal, the lowest in the league, from the 29th-ranked net-front rate, but the gap to Chicago’s 10.4 percent has an interval that includes zero. Vancouver’s 24.3 percent power-play share was second in the league and its 5v5 goal rate of 1.96 was last, and its 5v5 attempt rate went from 56.0 in the first half of the season to 48.6 in the second. Chicago had the second-lowest attempt rate in the league and scored close to the model’s expected total.
Six things to watch in October
Dallas: does the 5v5 attempt rate come off 49 per 60? A team that scored 273 on conversion and the power play needs one of those two to hold. Bourque’s 207 attempts and 16 goals at 5v5 departed. Track how the returning players and Kiviranta are deployed, alongside Johnston’s and Robertson’s power-play roles.
Carolina: 5v5 goals against expected goals. Last season it was 0.87 goals per expected goal, the third straight year below 0.90. Check whether the high attempt and expected-goal rates hold up alongside any change in conversion, particularly with Nikishin absent from camp.
Pittsburgh: track whether the 17.6 net-front attempts per 60 continue, and whether Kuzmenko keeps the projected power-play role. Treat October finishing as another short sample rather than confirmation that the late-season surge will repeat.
Edmonton: a new coach and a 5v5 attempt rate down eight and a half per 60 in two years. Alongside the strong power play, watch whether the 5v5 rate stops falling with Nurse gone.
Buffalo: 5v5 goals ran 13 percent above expected and Tuch’s 33 goals left. Track the returning players’ attempt rates and power-play opportunities alongside the goal rate to see how Tuch’s minutes are redistributed.
Anaheim: four departures took 13 of 49 power-play goals with them. Gauthier and Sennecke are the volume that stays, and Greer is the forward addition with a 2025-26 NHL scoring record. His camp slot remains a projection.
Numbers: NHL play-by-play and official power-play totals, 2025-26 regular season, shootouts excluded; prior seasons where labelled. 5v5 rates use regulation with both goalies on the ice. Expected goals use the study’s descriptive model; tracking is from AllThreeZones. Roster and camp-chart snapshot: September 18, 2026; camp roles are projections.
Related Posts


Starting Goalies



Top Skater Views
| Players | Team | |
|---|---|---|
| LUKE EVANGELISTA |
 N.J N.J | |
| JOSH DOAN |
 BUF BUF | |
| MASON MARCHMENT |
 S.J S.J | |
| MAVRIK BOURQUE |
 NSH NSH | |
| FRANK NAZAR |
 CHI CHI
| |
Top Goalie Profile Views
| Players | Team | |
|---|---|---|
| DAN VLADAR |
 PHI PHI | |
| SCOTT WEDGEWOOD |
 COL COL | |
| SPENCER KNIGHT |
CHI | |
| YAROSLAV ASKAROV |
S.J | |
| JOEL HOFER |
 STL STL
| |
LINE COMBOS
| Frequency |
 WSH Players WSH Players
| |
|---|---|---|
| 18.4 | CONNOR MCMICHAEL RYAN LEONARD HENDRIX LAPIERRE | |
| 18.1 | DYLAN STROME ALEX OVECHKIN ANTHONY BEAUVILLIER | |
| 16.0 | TOM WILSON ILYA PROTAS ALIAKSEI PROTAS | |
DobberHockey Podcasts

Fantasy Hockey Life: Nashville Predators with Emma Lingan
Emma Lingan joins the program to discuss the Nashville Predators

Keeping Karlsson: The 2026-27 Keeping Karlsson Breakfast Club
Don’t you forget about them! Elan and Brian remind you of at least one player on each NHL team whose name you might forget to consider at the draft table.
Fantasy Hockey Life: Tampa Bay Lightning with Erik Erlendsson
Erik Erlendsson joins the program to discuss the Tampa Bay Lightning. Jesse and Victor ask about pros Nikita Kucherov, Jake Guentzel, Brandon Hagel, Brayden Point, Anthony Cirelli, Ilya Mikheyev, Gage Goncalves, Conor Geekie, Benjamin Rautiainen, John Carlson, Victor Hedman, Charle-Edouard D’Astous, Andrei Vasilevskiy, Jonas Johansson, and Dennis Hildeby. In Cat’s instincts, Cat Silverman of InGoal […]
Fantasy Hockey Life: New York Rangers with Colin Stephenson
Colin Stephenson joins the program to discuss the New York Rangers.
Keeping Karlsson: Matchup Maximizer Schedule Deep Dive
Elan is joined by the Keeping Karlsson Accountability Czar Trev to take a deep dive into the NHL schedule for next season and how it should affect our drafting decisions.