In the realm of hockey analytics, two metrics have increasingly become the focal point for understanding the intricacies of the game: Corsi For Percentage (CF%) and Expected Goals For Percentage (xGF%). These advanced statistics offer a glimpse beyond traditional metrics, providing a deeper insight into a team’s performance and player efficiency. This analysis embarks on a journey to unravel the symbiotic relationship between CF% and xGF%, aiming to uncover the hidden layers of strategy and skill that define success on the ice. Through a comprehensive examination of player data, we delve into how these metrics correlate with winning dynamics and individual prowess, challenging conventional wisdom and reshaping our understanding of hockey excellence.
Deep Dive into Analytics
The Significance of CF% and xGF% – In the analytical toolkit of hockey, CF% and xGF% stand out as paramount indicators of team control and predictive success. These statistics, while not new to the seasoned analyst, offer a nuanced view of the game that goes beyond goals scored and shots taken. By examining these metrics, we embark on a detailed exploration of how teams establish dominance on the ice and the key factors that contribute to sustainable performance.
Unpacking the Data – Our journey into the analytics begins with a meticulous selection process, sifting through the vast sea of data to focus on players who meet our criteria: a minimum of 15 games played and over 150 minutes of time on ice. This ensures that our analysis is grounded in a foundation of significant contribution and reliability.
Methodology at a Glance – The core of our analysis rests on the standardization of CF% and xGF%, allowing us to place these metrics on a common scale for comparison. We delve into the intricacies of calculating a composite score that marries these two statistics, providing a singular lens through which to assess player effectiveness. This composite score serves as the cornerstone of our ranking system, unveiling the top performers in a landscape often dominated by traditional stats.
Results
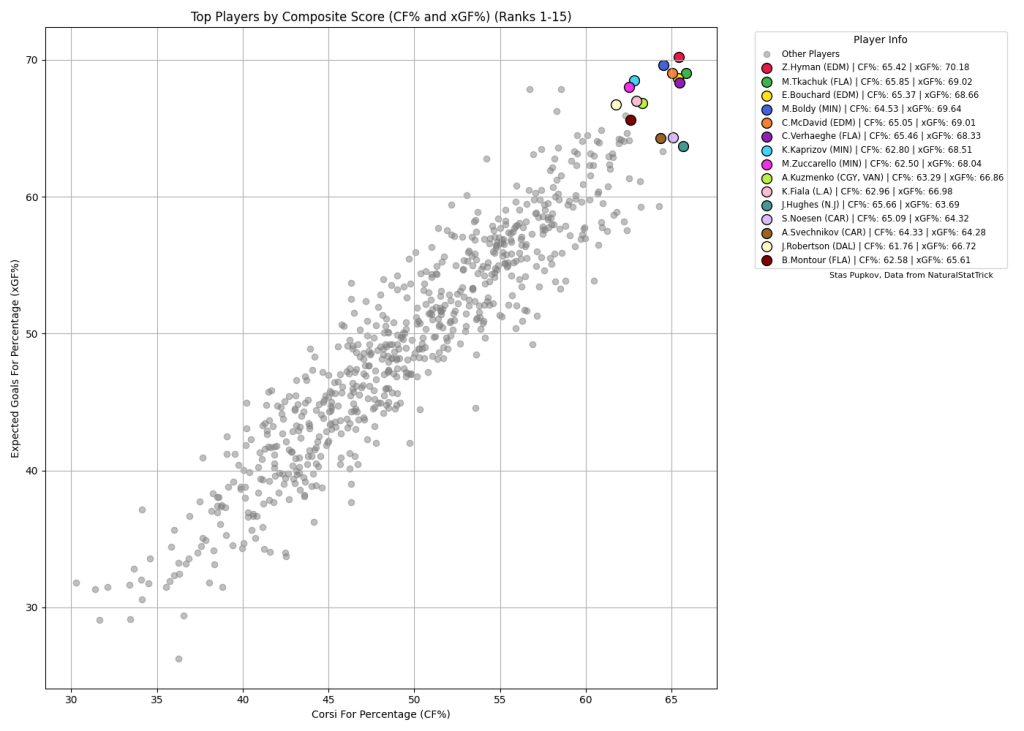
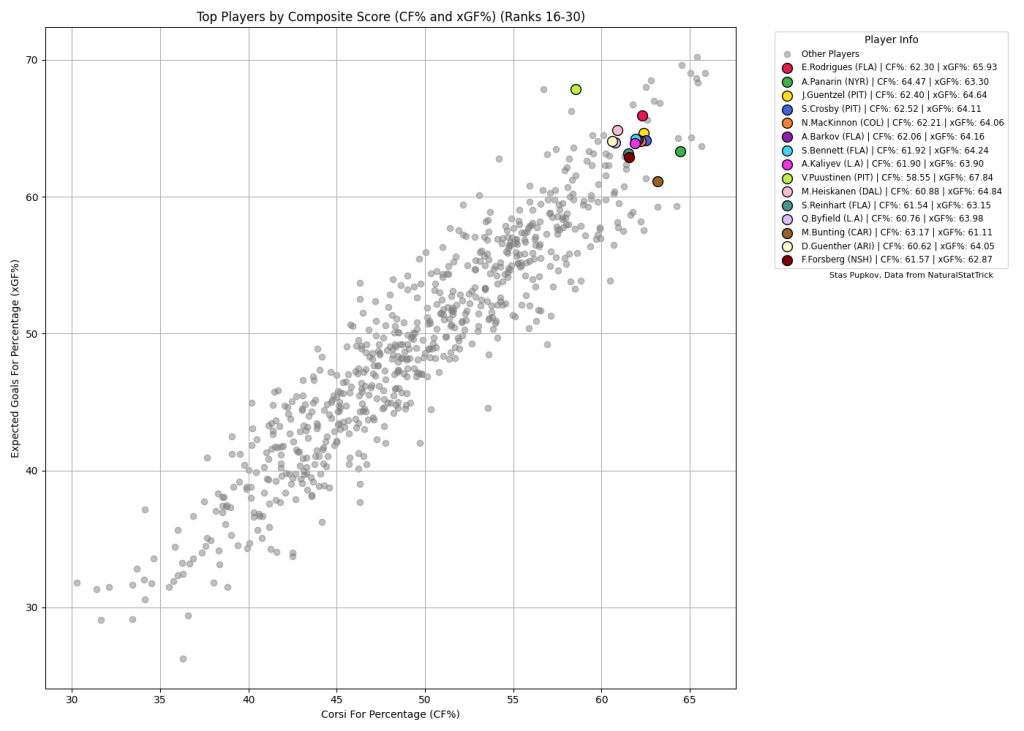
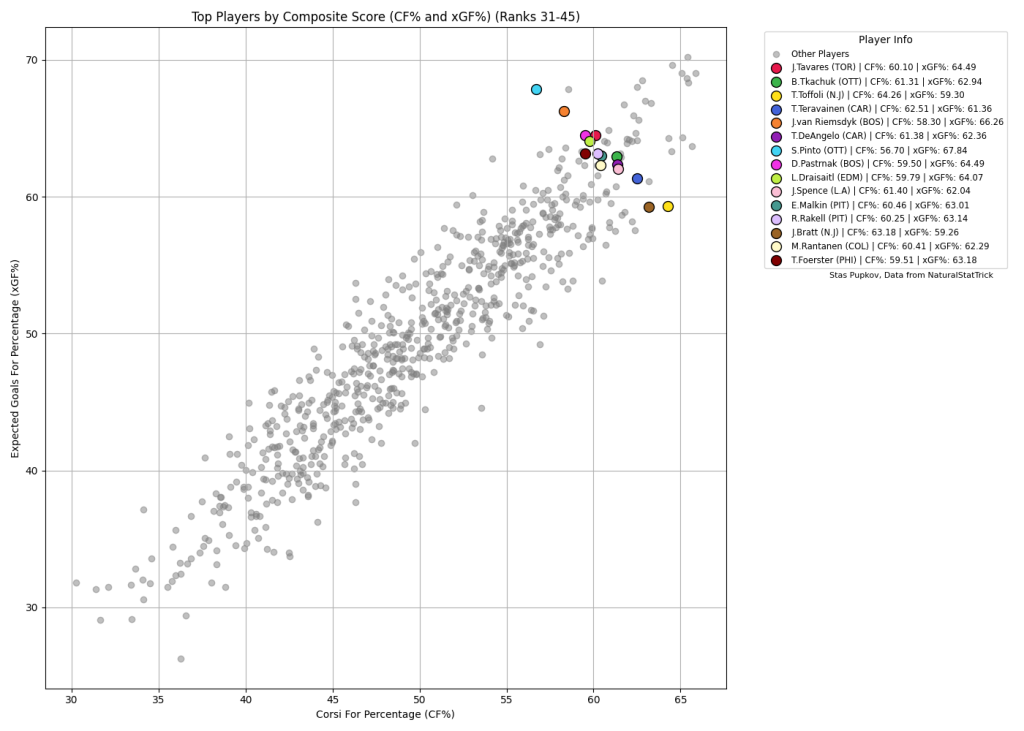
Top Performers in the Spotlight – With the analytical groundwork laid, we spotlight the top players who have excelled in balancing CF% and xGF%, according to our composite score rankings. This elite group showcases not only their ability to drive play but also their effectiveness in creating quality scoring opportunities. Highlighting specific players, we draw attention to their remarkable achievements and the strategies that likely propelled them to the top of our rankings.
Insights from the Data – The visualization of our analysis reveals compelling patterns and outliers among the ranked players. It becomes evident that a high CF% does not always correlate directly with a high xGF%, suggesting the importance of shot quality over quantity. Additionally, we observe that the top performers consistently excel in both metrics, underscoring the multifaceted nature of hockey excellence.
The Correlation Conundrum – Further examination of the data indicates a nuanced relationship between CF% and xGF%. Players who excel in one metric often perform well in the other, but exceptions exist, highlighting the complexity of hockey analytics. This section delves into these anomalies, offering potential explanations and implications for player evaluation and team strategy.
In our exploration of the nuanced interplay between CF% and xGF%, we’ve traversed beyond the surface to uncover deeper insights into player performance and strategic team dynamics. This analysis not only challenges traditional perspectives on player valuation but also enriches our understanding of the game’s underlying mechanics. By integrating advanced metrics into our evaluation toolkit, we unveil a broader landscape of potential, highlighting players poised for breakout success and those who may not sustain their current performance. As the fantasy hockey landscape evolves, leveraging such insights becomes paramount in crafting a team that stands the test of time.
Thank you for reading and have a great rest of your day!
Twitter/X – @DH_staspup for any questions, corrections, or comments
If you want to see how your team looks on the graph, DM me a list/photo of your roster
Player Data sourced from NaturalStatTrick
Related Posts
UPCOMING GAMES
Starting Goalies
Top Skater Views
Top Goalie Profile Views
| Players | Team | |
|---|---|---|
| ALEX LYON |
| |
| NIKITA QUAPP |
| |
| JUUSE SAROS |
| |
| FREDERIK ANDERSEN |
| |
| STUART SKINNER |
| |
LINE COMBOS
| Frequency |
| |
|---|---|---|
| 13.2 | COREY PERRY RYAN NUGENT-HOPKINS CONNOR MCDAVID | |
| 11.6 | VASILY PODKOLZIN MATTIAS JANMARK VIKTOR ARVIDSSON | |
| 11.0 | KASPERI KAPANEN ADAM HENRIQUE LEON DRAISAITL | |
DobberHockey Podcasts

Fantasy Hockey Life: Pittsburgh Penguins with Josh Yohe
Josh Yohe is here to report on the Pittsburgh Penguins. Jesse and Victor interview Josh about returning pros Sidney Crosby, Bryan Rust, Rickard Rakell, Evgeni Malkin, Tommy Novak, Rutger McGroarty, Ville Koivunen, Erik Karlsson, Matt Grzelcyk, Kris Letang, Owen Pickering, Tristan Jarry and Alex Nedeljkovic. In Cat’s Instincts, Cat Silverman of InGoal mag breaks down […]
Fantasy Hockey Life: Seattle Kraken with RJ Eskanos
RJ Eskanos of Emerald City Hockey is here to report on the Seattle Kraken. Jesse and Victor interview RJ about returning pros Jared McCann, Chandler Stephenson, Jaden Schwartz, Jordan Eberle, Kaapo Kakko, Shane Wright, Matty Beniers, Andre Burakovsky, Eeli Tolvanen, Jani Nyman, Vince Dunn, Brandon Montour, Ryker Evans, Joey Daccord, and Philipp Grubauer. In Cat’s […]

Keeping Karlsson: KK Leagues Report – 2025 Champs!
Derrick talks to the big winners of the various Keeping Karlsson leagues from this past season. He’s first joined by the new KKUPFL Ultimate Champion Ian and the reigning fast-track winner Alec. Then Derrick is joined by the year 1 KK Dynasty League champions Ian (different Ian), Saqib, and Brett, aka the “Good ol’ Ottawa Boys”.
Fantasy Hockey Life: Anaheim Ducks with Derek Lee
Derek Lee of the Hockey News is here to report on the Anaheim Ducks. Jesse and Victor interview him about returning pros Troy Terry, Mason McTavish, Trevor Zegras, Frank Vatrano, Leo Carlsson, Cutter Gauthier, Sam Colangelo, Jackson LaCombe, Olen Zellweger, Pavel Mintyukov, Radko Gudas, Jacob Trouba, Lukas Dostal, and John Gibson. In Cat’s Instincts, Cat […]
Fantasy Hockey Life: Fluto Shinzawa Boston Bruins Preview
Fluto Shinzawa of the New York Times joins the show to break down the Boston Bruins. Jesse and Victor ask him about David Pastrnak, Morgan Geekie, Pavel Zacha, Elias Lindholm, Casey Mittelstadt, Matthew Poitras, Fraser Minten, Charlie McAvoy, Mason Lohrei, Hampus Lindholm, Jeremy Swayman, and Joonas Korpisalo. Cat’s instincts covers prospect goalies Brandon Bussi and […]