Analytics Advantage: Corsi-For Percentage and Expected Goals-For Percentage
Stas Pupkov
2024-03-07
In the realm of hockey analytics, two metrics have increasingly become the focal point for understanding the intricacies of the game: Corsi For Percentage (CF%) and Expected Goals For Percentage (xGF%). These advanced statistics offer a glimpse beyond traditional metrics, providing a deeper insight into a team’s performance and player efficiency. This analysis embarks on a journey to unravel the symbiotic relationship between CF% and xGF%, aiming to uncover the hidden layers of strategy and skill that define success on the ice. Through a comprehensive examination of player data, we delve into how these metrics correlate with winning dynamics and individual prowess, challenging conventional wisdom and reshaping our understanding of hockey excellence.
Deep Dive into Analytics
The Significance of CF% and xGF% – In the analytical toolkit of hockey, CF% and xGF% stand out as paramount indicators of team control and predictive success. These statistics, while not new to the seasoned analyst, offer a nuanced view of the game that goes beyond goals scored and shots taken. By examining these metrics, we embark on a detailed exploration of how teams establish dominance on the ice and the key factors that contribute to sustainable performance.
Unpacking the Data – Our journey into the analytics begins with a meticulous selection process, sifting through the vast sea of data to focus on players who meet our criteria: a minimum of 15 games played and over 150 minutes of time on ice. This ensures that our analysis is grounded in a foundation of significant contribution and reliability.
Methodology at a Glance – The core of our analysis rests on the standardization of CF% and xGF%, allowing us to place these metrics on a common scale for comparison. We delve into the intricacies of calculating a composite score that marries these two statistics, providing a singular lens through which to assess player effectiveness. This composite score serves as the cornerstone of our ranking system, unveiling the top performers in a landscape often dominated by traditional stats.
Results
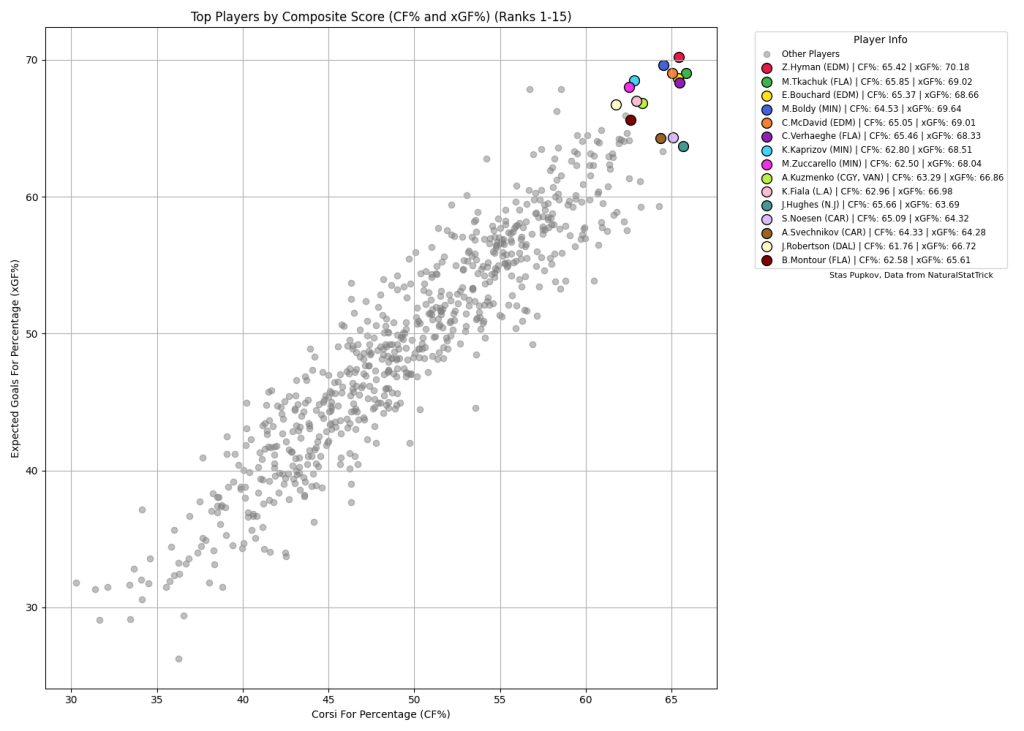
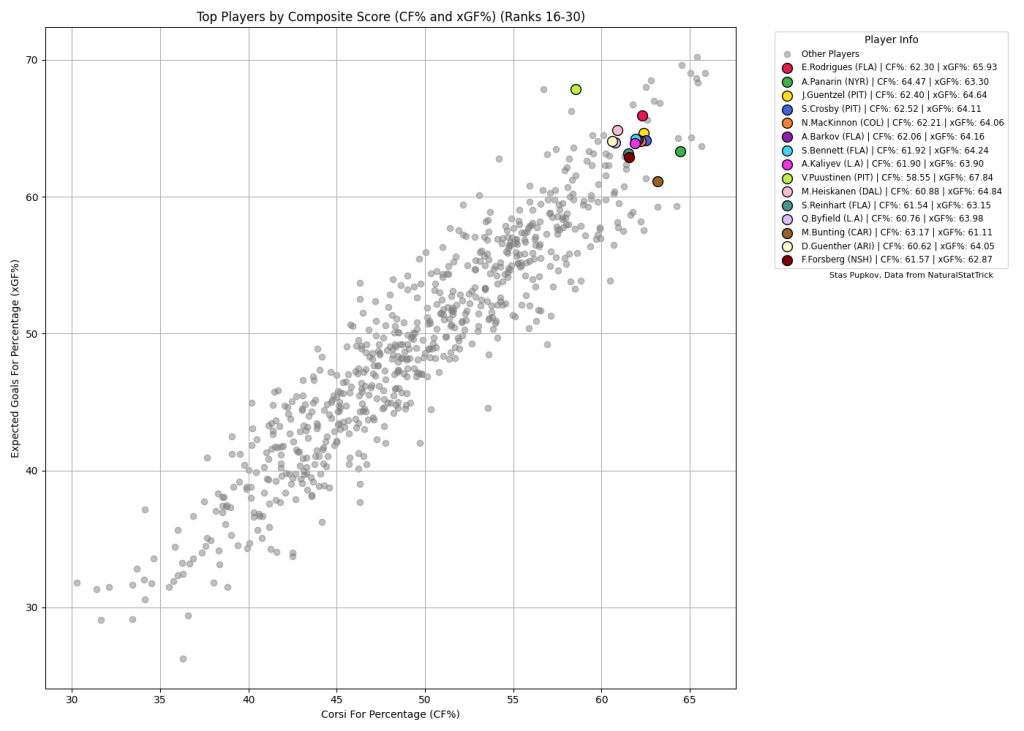
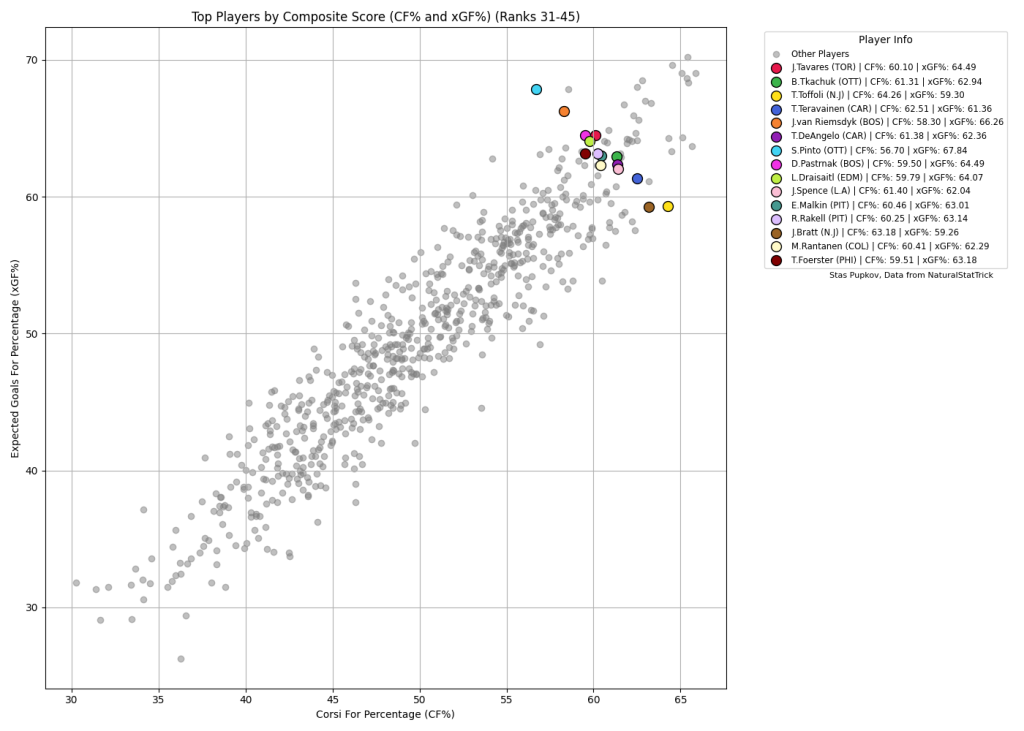
Top Performers in the Spotlight – With the analytical groundwork laid, we spotlight the top players who have excelled in balancing CF% and xGF%, according to our composite score rankings. This elite group showcases not only their ability to drive play but also their effectiveness in creating quality scoring opportunities. Highlighting specific players, we draw attention to their remarkable achievements and the strategies that likely propelled them to the top of our rankings.
Insights from the Data – The visualization of our analysis reveals compelling patterns and outliers among the ranked players. It becomes evident that a high CF% does not always correlate directly with a high xGF%, suggesting the importance of shot quality over quantity. Additionally, we observe that the top performers consistently excel in both metrics, underscoring the multifaceted nature of hockey excellence.
The Correlation Conundrum – Further examination of the data indicates a nuanced relationship between CF% and xGF%. Players who excel in one metric often perform well in the other, but exceptions exist, highlighting the complexity of hockey analytics. This section delves into these anomalies, offering potential explanations and implications for player evaluation and team strategy.
In our exploration of the nuanced interplay between CF% and xGF%, we’ve traversed beyond the surface to uncover deeper insights into player performance and strategic team dynamics. This analysis not only challenges traditional perspectives on player valuation but also enriches our understanding of the game’s underlying mechanics. By integrating advanced metrics into our evaluation toolkit, we unveil a broader landscape of potential, highlighting players poised for breakout success and those who may not sustain their current performance. As the fantasy hockey landscape evolves, leveraging such insights becomes paramount in crafting a team that stands the test of time.
Thank you for reading and have a great rest of your day!
Twitter/X – @DH_staspup for any questions, corrections, or comments
If you want to see how your team looks on the graph, DM me a list/photo of your roster
Player Data sourced from NaturalStatTrick
Related Posts
UPCOMING GAMES
| Apr 26 - 19:04 |
| vs |
| |
| Apr 26 - 19:04 |
| vs |
| |
| Apr 26 - 22:04 |
| vs |
| |
| Apr 26 - 22:04 |
| vs |
| |
Starting Goalies
Top Skater Views
Top Goalie Profile Views
LINE COMBOS
| Frequency |
| |
|---|---|---|
| 15.9 | ELIAS LINDHOLM DAKOTA JOSHUA CONOR GARLAND | |
| 13.8 | SAM LAFFERTY PHILLIP DI GIUSEPPE TEDDY BLUEGER | |
| 12.9 | PIUS SUTER J.T. MILLER BROCK BOESER | |
DobberHockey Podcasts

Fantasy Hockey Life: Salary Cap Basics Remix
If you missed last year’s series on salary leagues, this is a remix with some bonus material. Jesse and Victor discuss the different ways you can step up your dynasty league with a salary component. Our show is part of the Dobber Podcast Network and sponsored by Fantrax.com. Email [email protected] and ask to join our […]

Keeping Karlsson: No. 533 – Ultimate Champion Interview + Playoff Preview
On this week’s Keeping Karlsson Fantasy Hockey Podcast mega-show, Elan and Brian gather and analyze the latest fantasy hockey news, notes and data.
Fantasy Hockey Life: Tim-Eh’s Time in the TIDY Top Tier
When one of the managers in the TIDY league top tier left midseason, Patron Tim volunteered to give up his excellent team to take over a mid-season orphan fighting to escape relegation. And Tim did not go quietly. Ryan, Jesse and Victor welcome Tim to talk through his experience and the trades he made in […]
Keeping Karlsson: Better Off Nedeljkovic
On this week’s Keeping Karlsson Fantasy Hockey Podcast mega-show, Elan and Brian gather and analyze the latest fantasy hockey news, notes and data from the past season to work on projecting the 2023-24 NHL and fantasy hockey season. — Join the Keeping Karlsson patron community! Patrons get guaranteed KKUPL invitations, plus monthly bonus AMA episodes, and full access to […]
Fantasy Hockey Life: FHL Player Cards with Brandon
Our guy Brandon has been doing great work behind the scenes to great Fantasy Hockey Life prospect player cards, visualizations with the metrics we care about most – including BASH. These are a great tool to catch at a glance the stats for upcoming players. Jesse interviews Brandon and Victor on the decisions behind what […]