

Analytics Advantage: Previewing a Potential Montreal Canadiens-Tampa Bay Lightning First Round Playoff Matchup
Stas Pupkov
2026-04-10
This one is the generational clash. Tampa Bay has Andrei Vasilevskiy, Nikita Kucherov, Jake Guentzel, and Brayden Point — veterans who know what playoff hockey costs. Montreal has Cole Caufield, Nick Suzuki, Lane Hutson, Juraj Slafkovsky, and Ivan Demidov — the young core that has picked up the pieces along the way. Tampa’s average age is 28.7 with 19 players who have five or more NHL seasons. Montreal’s is 25.9 with seven players in their first or second year. Experience versus energy. Pedigree versus potential.
They split the season series 2-2, but the arc tells you everything. Tampa won the first two convincingly — 6-1 in December, then 5-4 in a shootout — before Montreal took the last two, both in Tampa, 4-1 on March 31 and 2-1 on April 9. The young team figured it out. The question is whether they figured it out enough.
I pulled every shot, shift, and play-by-play event from the NHL API through April 9 for the full 2025-26 season and threw it all into my database. With 79 games per team, there’s plenty to dig into. Let’s get into it.
*Editor’s Note: At time of writing, this is the likeliest first-round matchup for both teams, though Montreal can still win the division and avoid this matchup, as MoneyPuck has them just over 20% to do so.
The Basics — How These Teams Stack Up
Through 79 games, Tampa has 102 points (48-25-6) with a +59 goal differential. Montreal has 104 points (47-22-10) at +29. Montreal actually has more standings points despite Tampa having more wins — the Canadiens only have 22 regulation losses to Tampa’s 25, picking up 10 overtime losses along the way. Both are top-six scoring teams in the league: Tampa at 3.57 goals per game, Montreal at 3.48. Where Tampa separates itself is defense — 2.82 goals against compared to Montreal’s 3.11. That gap is nearly a third of a goal per game.
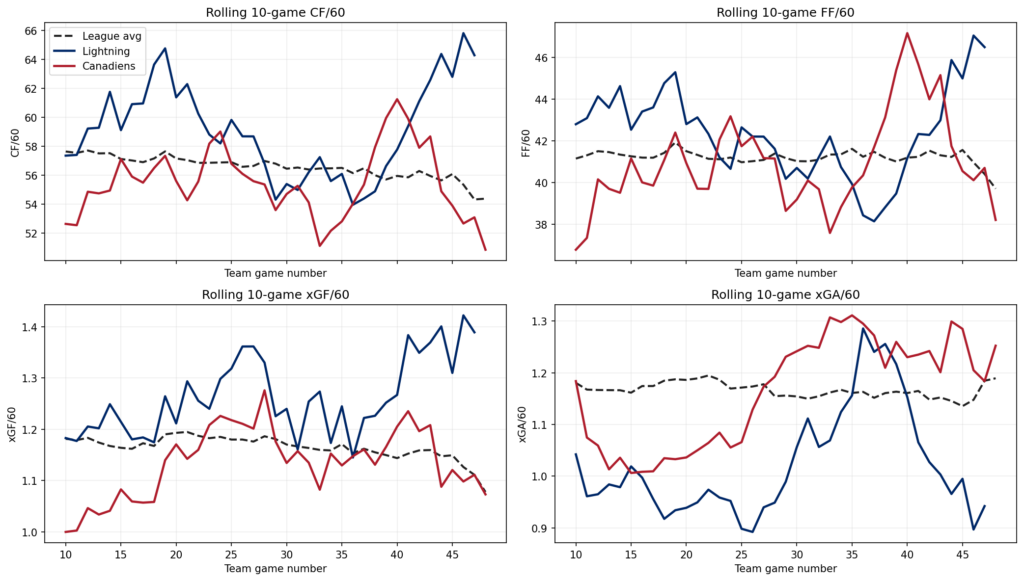
The rolling 10-game chart shows Tampa played better, more consistent hockey for most of the season. Montreal’s expected-goals numbers were middling early on, but the Canadiens picked it up significantly as the year went on, especially on offense. Both teams have seen their goals-against creep up as injuries hit, but Montreal has tightened up recently while Tampa has slipped since the Olympic break. The Canadiens figured out their defensive issues late. Tampa’s are getting worse at the wrong time.
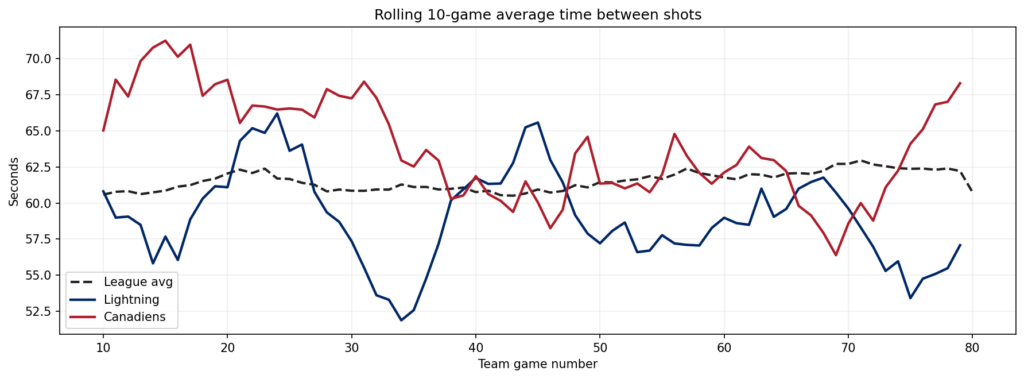
Tampa likes to pepper the goalie. Their average time between shots has been among the lowest in the NHL all season — well above league average in shot pace for almost the entire year. To shoot the puck you need to have the puck, and Tampa is a possessive team. Montreal sits closer to league average. This matters because Tampa’s offensive identity is volume from dangerous areas. They don’t wait for the perfect look. They shoot.
The defensive philosophies are completely different. Montreal leads the entire league in blocked shots at 16.4 per game. Tampa is 29th at 12.2 — nearly dead last. Montreal throws bodies in front of everything. Tampa prevents the chance from happening in the first place by limiting slot access. Both work, but they fail differently under pressure.
A few splits worth noting. Montreal is 23-16 in one-goal games (.590). Tampa is only 13-16 (.448) — a massive gap in close contests. In overtime, Montreal is 10-5; Tampa is 5-4. When scoring first, Tampa is 31-7 — nearly unbeatable when it gets ahead. Montreal is 31-14, also strong. Tampa is a second-period team with a +32 goal differential in the middle frame alone, the best single-period number on either side. Montreal builds gradually and peaks in overtime, where the Canadiens have 10 goals on 98 shots. Against the Eastern Conference, Montreal is the better team at .638 points percentage to Tampa’s .564. Against the West, Tampa dominates at .766.
Shot Maps — Where They Score and Where They Bleed
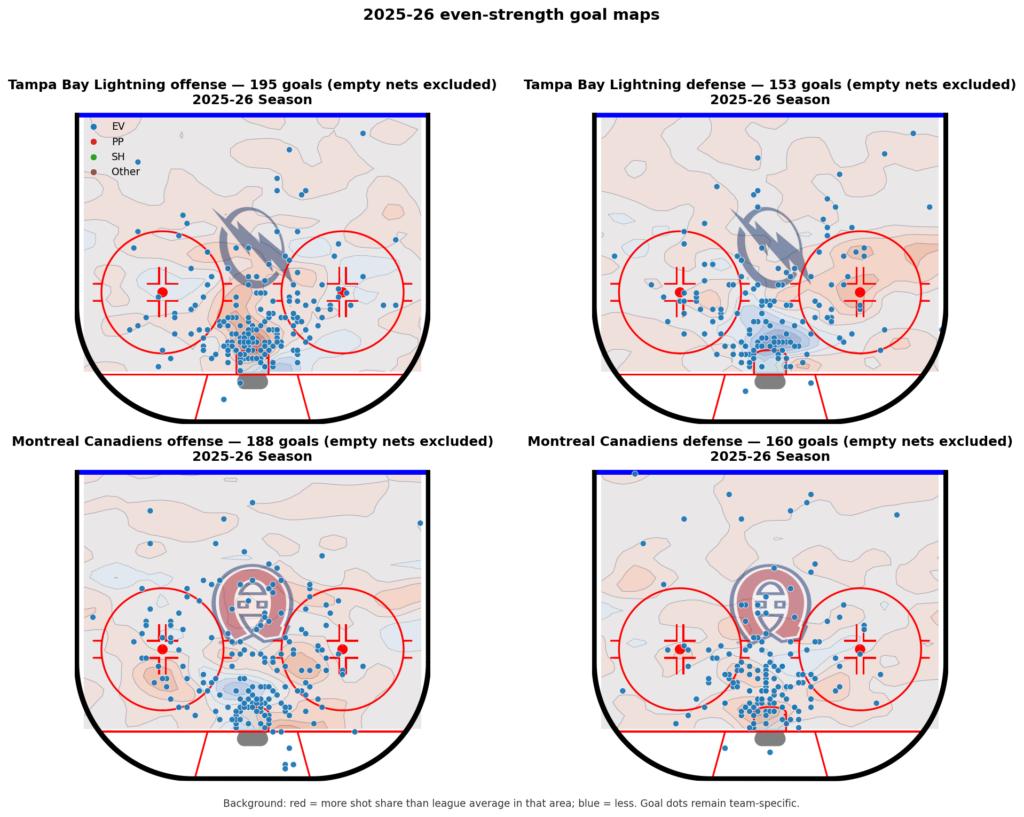
Tampa penetrates the middle of the ice. At even strength, 36.9% of its shots come from the slot, converting at 8.9% — the highest rate in this matchup. But they also produce from the perimeter, with above-league-average shot share from spots most teams ignore. Tampa has a lot of snap shots from the middle, deflections in front, and cross-ice one-timers. Their backhands convert at 10.3%, the highest rate for any shot type on either team. They get to the dirty areas and finish.
Montreal works outside-in. The Canadiens cycle from behind the net through the circles. Their shots cluster around the bottom of the circles, outside the house, and along the hashmarks — they don’t actually get a ton of attempts from right in front of the crease. 36.2% come from the slot at 7.5%, and they generate a decent amount from the point at 12.8%. Montreal’s offense is perimeter-driven, working the puck inside through movement rather than direct slot attacks.
Defensively, the contrast is sharp. Tampa’s shot map shows a well-protected house — the hash-to-crease area is locked down. They allow only 1,082 slot shots against (32.3%) at 7.8%. Montreal gives up 1,371 slot shots (36.6%) at 7.6%. The Canadiens are below league average in suppression across most zones. They rely on volume blocking and goaltending rather than structural prevention.
On rebounds, Tampa is more dangerous: 16 goals on 241 rebound shots versus Montreal’s 10 on 177. On the rush, Montreal is more efficient — 10 goals on 260 rush shots compared to Tampa’s seven on 358. Neither team is primarily a rush team, so expect a half-court series that favors structure.
Special Teams and Penalties
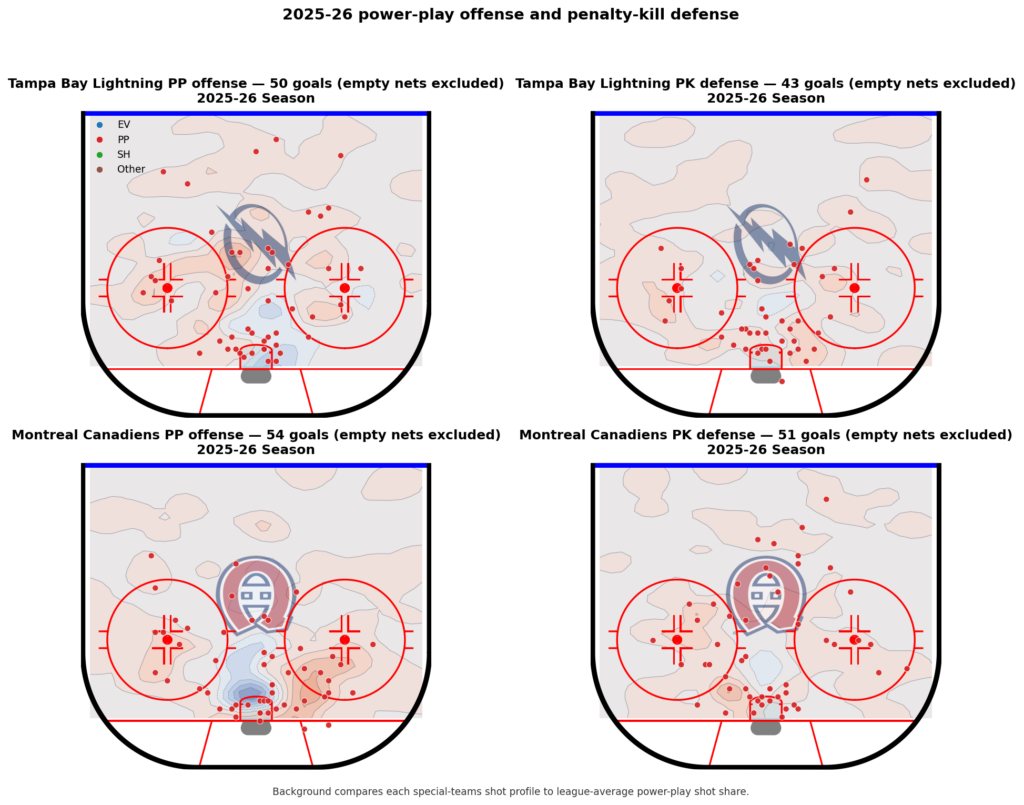
Tampa’s power play works the bumper and umbrella. Darren Raddysh leads with 10 PP goals at 19.6% shooting from the point — he has a cannon. Oliver Bjorkstrand has nine at 19.6%. Kucherov runs the half wall with 121 PP shot attempts, feeding one-timers and working snap shots through traffic. They don’t take many shots directly from in front of the net; they prefer tips, deflections, and shots from the circles. Tampa converts at 20.6%.
Montreal’s power play is built around Caufield’s one-timer on the right side. The shot map makes it obvious — there’s a heavy concentration of attempts on that right half-wall where Caufield and Suzuki set up. Slafkovsky leads with 15 PP goals at a 29.4% shooting percentage. Suzuki has 11 at 26.8%. Caufield has 10 on 105 attempts. There is a dead zone directly in front of the net — Montreal takes almost no shots there on the power play. They work completely on the outside in. Montreal converts at 23.1%, the more efficient unit.
On the penalty kill, Tampa is the significantly better team at 83.9% versus Montreal’s 79.4%. That is a nine-goal difference on nearly the same number of opportunities. Both teams can counter-punch shorthanded — Tampa has 27 shorthanded goals, Montreal has 20. Montreal’s PK scored twice in the March 31 head-to-head game alone.
The penalty gap is where this series could be decided. Tampa has 415 penalties for 1,187 PIM. Montreal has 340 for 827 PIM. Tampa takes 22% more penalties. Roughing is Tampa’s biggest issue at 101 calls — 24% of their total. Then tripping (46), fighting (44), holding (33). Montreal’s top infractions are roughing (70), tripping (38), hooking (37), and high-sticking (35). Tampa plays angry. Montreal plays lazy. Both will get punished, but Tampa’s volume problem is worse.
The timing matters. Both teams take about 18.5% of their penalties while leading in the third — protecting a lead and getting sloppy. Raddysh has 25 penalties with 40% late in periods. That is a lot of box time for a top-pair D-man Tampa needs on the ice. On Montreal’s side, Brendan Gallagher has 18 penalties with 50% late — the worst late-penalty rate on either team. Every undisciplined penalty is a potential goal against when both power plays are this dangerous.
Line Matchups, Size, and Who Moves the Needle
Montreal has line stability. Suzuki-Caufield-Slafkovsky is the clear first line at 364 minutes and 53.1% xGF. Tampa is still searching. The most-used trio is Yanni Gourde–Zemgus Girgensons–Pontus Holmberg at 362 minutes — a grinding line with a strong 57.2% xGF. The high-skill combination of Kucherov-Anthony Cirelli–Brandon Hagel at 192 minutes is dominant at 63.1%, the best number on either team, but Kucherov-Guentzel-Point at 118 minutes sits at only 46.7%. Tampa’s most talented forwards haven’t found chemistry together. The combinations that work all have Cirelli as the connector.
The defensive pairs tell the real story. Tampa’s Raddysh-J.J. Moser is the best pair in the matchup: 540 minutes at 59.9% xGF, 32 goals for and 19 against. Montreal’s Matheson-Noah Dobson, the most-used pair at 515 minutes, is underwater at 45.7%. Hutson is the swing factor — every pair he joins improves. Dobson-Hutson at 188 minutes is 60.1%. Home ice and last change are massive for Montreal because of Hutson.
The size difference up front is dramatic. Tampa’s top-six forwards average just 176 pounds. Montreal’s average 194 — nearly 18 pounds per player. Tampa’s skill forwards are small and fast. Montreal’s top six is bigger, with Slafkovsky at 238 and Josh Anderson at 222. The question is whether Tampa’s speed or Montreal’s size matters more when lanes close in the playoffs.
In faceoffs, Montreal has the clear edge. Jake Evans wins at 81.8% in the defensive zone. Suzuki is 62.6% in the offensive zone. Tampa’s centers lose more draws than they win outside the D-zone.
Caufield has 50 goals with 29 go-ahead goals and 12 game-winners — an absolutely clutch player who loves scoring the goals that manner. Since January 1, he has 31 goals, leading the entire NHL. Kucherov has 128 points overall with 77 since January 1 — 25 goals and 52 assists in 38 games. Raddysh had a breakout 70-point season from the blue line with six game-winning goals. Suzuki has 98 points. Hutson has 63 assists as a sophomore, ninth in the league. The scoring distribution between the two teams is almost identical — same number of 40-plus and 30-plus point players. Montreal’s defense contributes more points; Tampa’s forwards are slightly more productive. But Montreal is more top-heavy. After the top five, scoring dries up. Tampa has more balanced depth throughout the lineup.
Goalies — The Matchup That Decides Everything
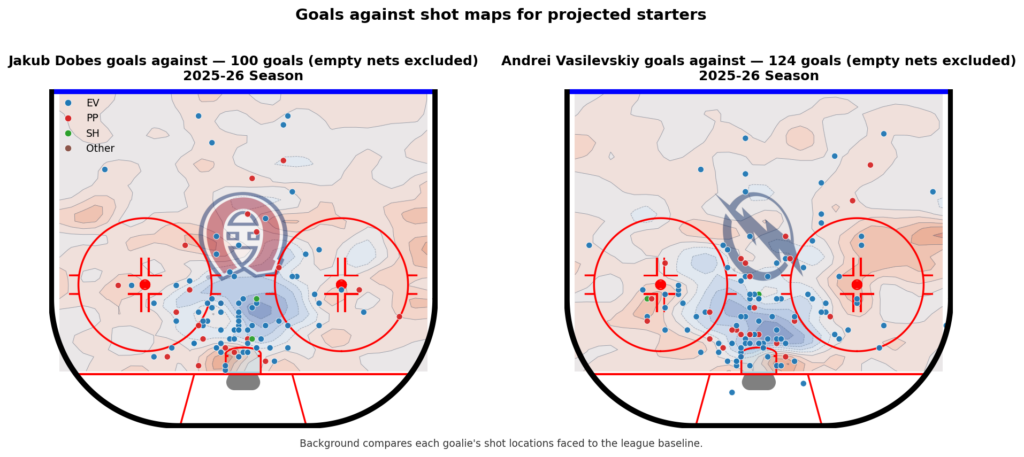
Vasilevskiy has been Tampa’s rock: 55 starts, .911 save percentage, 2.32 GAA, two shutouts. He is the best goalie in this series by a margin that matters. The shot map shows his house is completely protected — the middle of the ice in front of him is locked down. His slot save percentage is .903 (league average .897), high slot .933 (.936 league), perimeter .980 (.982 league). Above average everywhere. His backup Jonas Johansson is shaky at .884 overall and .854 over his last 10 starts. If Vasilevskiy needs a night off, Tampa has a real problem.
Jakub Dobes has 39 starts at .904 and 2.69 GAA, with recent form that’s outstanding — .938 over his last 10 starts with a 1.87 GAA, so he is peaking at exactly the right time. His high-slot save percentage (.941) and perimeter (.985) are both above league average. He faces more shots from the left side and outside compared to Vasilevskiy. Jacob Fowler has 16 starts at .904. Samuel Montembeault has 23 at .872. Montreal’s goaltending is deeper but less top-heavy.
Bottom line: Vasilevskiy gives Tampa the higher ceiling. Dobes gives Montreal depth and consistency, especially in his current form. If Vasilevskiy plays all seven, Tampa has the goaltending edge. If there’s a back-to-back, Montreal’s three-goalie rotation is the advantage.
Recent Form and Head-to-Head
Over the last 15 games, Montreal is 11-4, outscoring opponents 47-34 with a 2.27 GAA. Tampa is 8-7, outscoring 53-45 with a 3.00 GAA. Montreal is playing tighter hockey. Tampa is scoring but giving up too much at the other end.
Montreal’s hot list: Caufield has 23 points in 15 games (1.53/game vs 1.12 season average), Suzuki 23 in 15 (1.53 vs 1.24), Slafkovsky 18 in 15 (1.20 vs 0.90). The stars are surging. The concern is depth — Hutson dropped from 0.95 to 0.60, Dobson from 0.59 to 0.33. Tampa’s hot list: Hagel at 18 in 15, Cirelli 14 in 15. The cold list is concerning — Point has cratered to 6 in 15 (0.40 vs 0.79), Bjorkstrand has one point in 15 games. Kirby Dach is back for Montreal. Victor Hedman‘s status is uncertain — if he returns, Tampa’s defense can go to another level.
The four head-to-head games tell the story in miniature. December 9 in Montreal: Tampa 6, Montreal 1 — Point, Holmberg, and Kucherov scored in the first, Raddysh scored twice including a power-play goal. December 28 in Tampa: Tampa 5, Montreal 4 (SO) — Kucherov scored twice, Tampa led 4-1, then Demidov, Slafkovsky, Dobson, and Slafkovsky (empty net) made it 4-4. March 31 in Tampa: Montreal 4, Tampa 1 — Slafkovsky opened on the PP, then Montreal’s PK scored twice through Matheson and Suzuki. April 9 in Tampa: Montreal 2, Tampa 1 — Caufield and Slafkovsky scored, Raddysh got one back on the empty net. The pattern: early in the season, Tampa’s firepower overwhelmed Montreal. As the year went on, Montreal learned. They won the last two in Tampa by a combined 6-2 at even strength.
The numbers say this is close to a coin flip. Montreal has better points percentage, better close-game record, better faceoff depth, better recent form, and the more efficient power play. Tampa has better goal differential, better defensive structure, better slot shooting, more balanced depth, the better penalty kill, the best goalie in the series, and the best player in the series in Kucherov. If Tampa stays disciplined and Vasilevskiy is at his best, Tampa in six. If Montreal’s stars keep surging and the Canadiens play the tight hockey they showed in the last two head-to-head wins, Montreal in seven.
All numbers from my April 9 data pull, covering 79 games per team. Caufield: 50 goals, 31 since January 1 (league-leading), 12 game-winners. Kucherov: 128 points, 77 since January 1. Hutson: 63 assists as a sophomore, ninth in the NHL. Raddysh: 70-point breakout from the blue line.
Related Posts


Starting Goalies
















Top Skater Views
| Players | Team | |
|---|---|---|
| TRISTAN LUNEAU |
 ANA ANA | |
| LUCA CAGNONI |
 S.J S.J | |
| ADAM JIRICEK |
 STL STL | |
| MARCO ROSSI |
 VAN VAN | |
| IGOR CHERNYSHOV |
S.J
| |
Top Goalie Profile Views
| Players | Team | |
|---|---|---|
| JOEL HOFER |
STL | |
| NICO DAWS |
 N.J N.J | |
| DYLAN GARAND |
 NYR NYR | |
| ARTURS SILOVS |
 PIT PIT | |
| SERGEI MURASHOV |
PIT
| |
LINE COMBOS
| Frequency |
 VGK Players VGK Players
| |
|---|---|---|
| 12.6 | MARK STONE JACK EICHEL IVAN BARBASHEV | |
| 11.6 | MITCH MARNER WILLIAM KARLSSON IVAN BARBASHEV | |
| 10.3 | MARK STONE BRETT HOWDEN JACK EICHEL | |
DobberHockey Podcasts

Keeping Karlsson: Matchup Maximizer 2026/27 Week 2
Elan takes a look at the schedule for the upcoming weeks of NHL action and recommends players with good schedules that you should consider streaming in to win your head to head matchups.

Fantasy Hockey Life: Tidy Takes Part 1
TiDy Admiral Ryan Downey and Victor Nuno break down recent trades in the FHL Tiered Dynasty’s top division, the Lord Stanley division. Tune in to consider trades between some of the best dynasty sharks we know, including patron polls on the trades and Victor’s analysis. Have a listen! Our show is part of the Dobber […]
Keeping Karlsson: Short Shifts – I Tried to be Like Parker Kelly
Elan is joined by Ryan Downey for the premiere of season 8 of Short Shifts! — KKUPFL late registration is ongoing! We’re still filling new divisions in the world’s greatest fantasy hockey league. Details at https://www.kkupfl.com/. Join the Keeping Karlsson patron community! Patrons get access to all our perks all year round, including KKUPFL […]
Keeping Karlsson: Shabanov Ranks
Elan and Brian fly through the final preseason lines for every NHL team ahead of opening night, and share their guys to watch– or look away from– in your fantasy hockey leagues.
Fantasy Hockey Life: Western Conference Catchup and Mustard
Jesse and Victor are here to Catch Up on everything in the Western Conference that transpired ofter our team previews. We also have our annual spicy mustard competition – two hot takes per team. Our show is part of the Dobber Podcast Network and sponsored by Fantrax.com. Email [email protected] and ask to join our free […]