
Taking a look back at the “expert” pre-season predictions for the Western Conference.
Most predictions are abandoned moments after they are made, never to be visited by their creators again. That’s particularly tragic given that the perspective of a carefully examined summer study shold still hold good value months later – and it’s a perspective that can be even further improved the following year when its successes and failures are examined.
That’s why I’m using the year-end holiday pause to go back to the pre-season projections of almost 100 analysts, and comparing them to the current standings. The goal is to try to learn something by explaining any notable differences, and to use this information to predict what will happen the rest of the way.
Each divisional section begins with a table that breaks down all the relevant information at a high level. Categories include:
- Current position in the standings, which is based on winning percentage, since not every team has played the same number of games. It does not include Friday night’s games.
- Expected position in the standings, which is based on the consensus of 97 sets of published projections, which are available here on Dobber.
- The difference in points, which is how many more (or less) points a team would have had to earn to currently stand where they were predicted to be.
- The Luck Index, which is the effect on the standings various luck-based factors have had on a team, as measured in points. Factors (to varying degrees) include injuries, shooting and save percentages, special teams, record in one-goal games, and in the overtime and shootout. It’s available at Hockey Abstract.
- Projected position, which is where they are currently projected to finish, using a variety of statistical methods available at Hockey Reference, Sports Club Status, Playoff Status, and Ineffective Math.
We’ll start with the Western Conference today, and hit the Eastern Conference next weekend.
Central Division
Chicago, St. Louis, and Minnesota are all almost exactly where they were expected to be, but Nashville and Winnipeg have been much better, while Colorado and Dallas have been much worse.
Team Win% Current Expected Difference Luck Index Projected
Chicago .703 1st 1st N/A +5 pts 1st
Nashville .700 2nd 6th +9 pts +6 pts 2nd/3rd
St. Louis .688 3rd 2nd -1 pt +3 pts 3rd/4th
Winnipeg .594 4th 7th +10 pts -2 pts 4th/5th
Minnesota .567 5th 4th -2 pts -1 pt 4th/5th
Dallas .483 6th 3rd -13 pts -3 pts 6th
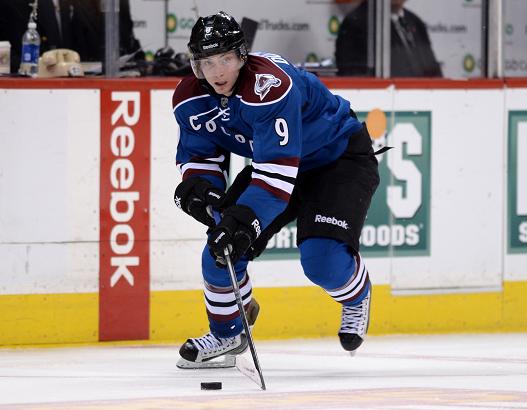
Colorado .452 7th 5th -8 pts -3 pts 7th
The top five teams from the Central division could potentially qualify for the post-season, which will feature a reasonably close three-way race for first, two teams jockeying for one of the better wild card positions, and very little chance for either Dallas and Colorado, the latter of whom could finish as low as 28th overall.
Chicago Blackhawks
What happens when you take one of the worst possession teams in the league and regress their goaltending back down to average? Last place! However, comfort with analytics wasn’t a pre-requisite to predict this tumble, as analysts of all stripes placed last year’s divisional champions in the bottom half this year. Interestingly, only Grant Jenkins had them in dead last, where they are most likely to finish. In fact, there’s an outside chance they can finish 28th overall and get a good ticket in the Connor McDavid lottery.
Pacific Division
The Pacific Division has been a little bit more unpredictable, in a sense. Four teams were pegged within a single position in the standings, and two more within two positions, but the number of points required for teams to fall within those expected positions were quite high in all but two cases (Vancouver and San Jose).
Team Win% Current Expected Difference Luck Index Projected
Anaheim .721 1st 2nd +8 pts +3 pts 1st
Vancouver .613 2nd 4th +3 pts 0 pts 2nd-4th
San Jose .606 3rd 3rd N/A -1 pt 2nd/3rd
Los Angeles .576 4th 1st -10 pts -1 pt 3rd-5th
Calgary .545 5th 7th +16 pts +2 pts 4th/5th
Arizona .419 6th 5th -8 pts -3 pts 6th
Edmonton .303 7th 6th -8 pts -10 pts 7th
The Ducks are a runaway favorite for the divisional crown, and Arizona and Edmonton will almost certainly finish sixth and seventh respectively, but almost anything could happen in the middle. Most likely, San Jose will edge Vancouver for second, while Los Angeles finishes far closer to those two teams than to Calgary in fifth.
Anaheim Ducks
Anaheim is a sparkling 10-0 in one-goal games decided in regulation. It also have four empty-netters while allowing two, potentially making a close-game record of 14-2. Can this continue? Well, last year’s best close-game regulation record (Colorado) was 26-11, so probably not. The Ducks are nevertheless a strong team, and has built up a lead in the standings that should hold up through the remaining games, as just over half the analysts predicted.
Vancouver Canucks
The Canucks went off the board with a great possession-focused AHL coach, Willie Desjardins, and the results have been fantastic. Radim Vrbata has helped rejuvenate the Sedins, and the team has enjoyed far more secondary scoring than anyone could have hoped, with many players on track for career scoring highs. Being in second place is quite unexpected, with only two analysts, Donny Rivette and Adam Rickert, having predicted such. While there’s great risk of the Canucks slipping down the standings once the team’s scoring cools and the blue line thins out with injuries, only six more analysts even had them in third. This team is not out of the woods yet, though, with a 16% to 30% chance of missing the playoffs in consecutive seasons for the first time since 2000.
San Jose Sharks
Things are unfolding largely as expected this year in San Jose, who are on pace for about 95 points. That’s still cutting it pretty close, however. The Sharks currently have about a 20% to 33% chance of missing the playoffs for only the second time since 1997 — although only 10 analysts predicted them to tumble outside the division’s top three.
Los Angeles Kings
The most pessimistic predictions for Los Angeles involved third place, and only 10 analysts were even prepared to go that low. What happened? As covered in a recent ESPN piece, the team’s possession numbers have dropped, largely because of some blue line absences that are no longer forcing teams to dump-and-chase. That means the first place predictions were clearly wrong, that the champs are finally vulnerable, and that they will actually be scratching and clawing for a playoff spot if and when the goaltending cools down.
Calgary Flames
The Flames hopefully enjoyed their great start, because this is clearly the rebuilding team that everybody saw in September. True, there were a dozen analysts that saw the Flames finishing fifth or better, but the recent six-game losing skid has thrown some cold water on the optimists. This is one of the worst possession teams in the league, and while they are well-coached and have a great top pairing, we’re starting to see what happens to this team when its shooting percentage drops below an unsustainably high 11%. While winning is never a bad thing, the sad news for Flames fans is that the hot start is more likely to deny them a good draft pick than it is to get them a wild card spot – but at least they have that shot.
Arizona Coyotes
New name, same result. Most experts pegged Arizona for fifth, but sixth was also seen as a strong possibility. This is a surprisingly disappointing team defensively, which is further aggravated by Mike Smith struggling through his worst season ever. The team’s playoff hopes are essentially over, and it’s in a roughly four-way race for the third best ticket in the McDavid lottery.
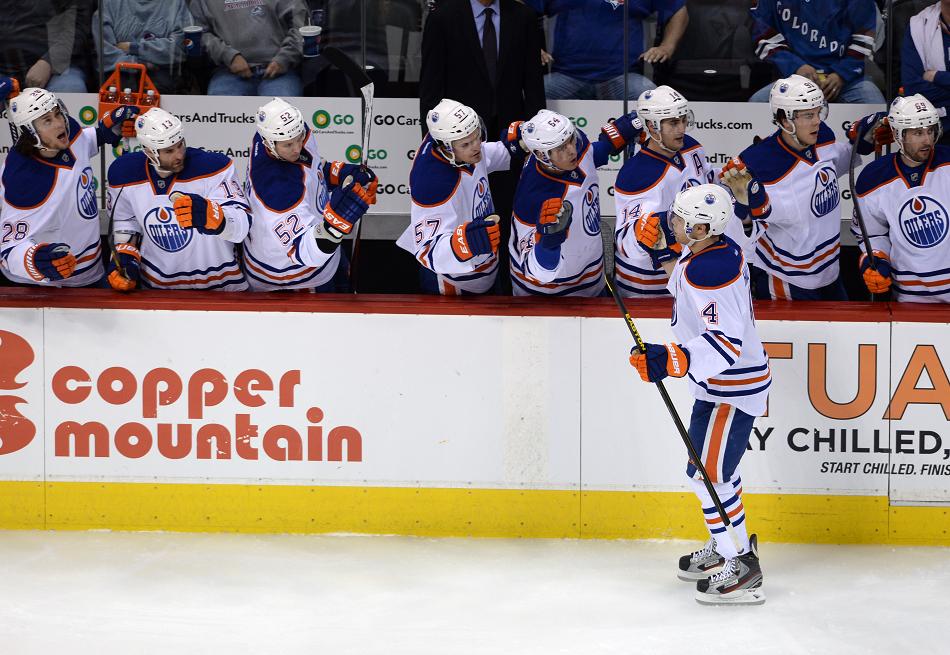
Edmonton Oilers
The Oilers may be bad, but they’re not this bad. An 0-5 record in overtime, 0-1 in the shootout, a 7-12 close-game regulation record, a 7.3% team shooting percentage, and an opponent shooting percentage of 10.8% all add up to a miserable record for an otherwise near-average team. Only a quarter of the experts predicted the Oilers would trail the Pacific division (Dobber even had as high as them fourth), and now they’re battling Buffalo for the Connor McDavid ticket.
Closing Thoughts
No reasonable fan expects the experts to be right 100% of the time, but they would like to know what happened when they get one wrong, and see that information influence future predictions.
This exercise can also help those remaining fans who still see pre-season predictions as anything more than an entertaining point-in-time perspective. I’ve seen so many fans that take them far too seriously when even the collected wisdom of almost 100 experts can only peg five of these 14 teams within five points after only 30 games. The end-of-season standings are really anybody’s guess. Have a safe holiday, and enjoy the balance of the 2014-15 season!
Related Posts
UPCOMING GAMES
Starting Goalies
Top Skater Views
| Players | Team | |
|---|---|---|
| SAM RINZEL |
| |
| STEFAN NOESEN |
| |
| NOAH DOBSON |
| |
| KIRILL MARCHENKO |
| |
| MORGAN GEEKIE |
| |
Top Goalie Profile Views
LINE COMBOS
| Frequency |
| |
|---|---|---|
| 19.9 | TOM WILSON ALIAKSEI PROTAS PIERRE-LUC DUBOIS | |
| 19.2 | DYLAN STROME ALEX OVECHKIN ANTHONY BEAUVILLIER | |
| 17.8 | TAYLOR RADDYSH BRANDON DUHAIME NIC DOWD | |
DobberHockey Podcasts

Keeping Karlsson: Green Boys of 2024-25
Elan and Brian set their sights on NHL players who saved their best for last in 2024-25 — and wonder whether their projections should look more like their slow start, or hot finish.

Fantasy Hockey Life: Stefan Rosner on the New York Islanders
Stefan Rosner is here to report on the New York Islanders. Jesse and Victor interview Stefan Rosner about returning pros Bo Horvat, Anders Lee, Mathew Barzal, Simon Holmstrom, JG Pageau, Maxim Tsyplakov, Calum Ritchie, Noah Dobson, Ryan Pulock, Alexander Romanov, Scott Perunovich, and Ilya Sorokin. In Cat’s Instincts, Cat Silverman of InGoal mag breaks down […]
Fantasy Hockey Life: Draftastic 3 – Q&A on the NHL Draft
Jesse asks Victor the questions you wanted answers to from the NHL Draft!
Keeping Karlsson: UFA Szzzn
Elan and Brian work their hardest to make the most of the NHL’s 2025 UFA signings and player movement, searching for the guys who may be the most likely to exceed expectations in new homes and situations.
Fantasy Hockey Life: Draftastic 2 – Q&A on the NHL Draft
Victor and Jesse are back in studio as Victor reports on his time at the NHL Draft and his outlook on fantasy rookie drafts. We discuss Michael Misa, Matthew Schaefer, Cole McKinney, Mason West, Milton Gastrin and Jacob Ihs-Wozniak with player audio. Victor also answers patron questions on which players you’ll want to target for […]