Frozen Tools Forensics: Multi-cat forwards past and present
Chris Kane
2020-03-27
We started off this idea last week, looking at various stat categories and comparing them to past years, and we are going to continue this week. We don't have a lot of new information to use, and we don't know what the future of the NHL season looks like so it seems a good use of our time. Last week we took a look at defensemen and which of them contributed well across the board in your peripheral categories. This week we are going to finish up that mini-series and hit the forwards. We will follow largely the same format, pointing out leaders in various categories, then in combined metrics, then comparing player numbers to the last several seasons.
This week: Multi-Cat Forwards
Just as a reminder, Frozen Tools has an easy way to pull up this kind of data. If you navigate to the report section, just click on the Muli-Category button. If we pull up the report for 2019-20 here is the table we get.
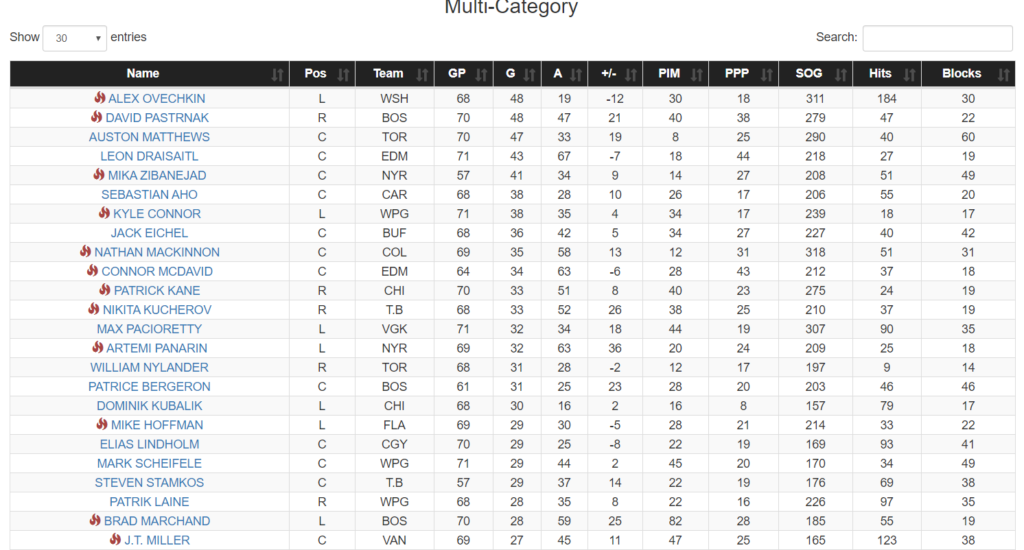
For the purposes of this column, I am mostly going to be looking at shots, hits, and blocks. As you can see the report also gives points so if I want to use a point floor at a later date I can do that. I am not going to use PM at the moment, even though I know some leagues still utilize that stat. I am also going to try an account for games played so I put all of the 2019-20 stats in a per-game rate but will also filter for at least 20 games played to eliminate players with very small sample sizes.
Our leaders in shots per game:
| Name | Pos | Team | GP | SOG/G | Hit/G | Block/G |
| NATHAN MACKINNON | C | COL | 69 | 4.61 | 0.74 | 0.45 |
| ALEX OVECHKIN | L | WSH | 68 | 4.57 | 2.71 | 0.44 |
| MAX PACIORETTY | L | VGK | 71 | 4.32 | 1.27 | 0.49 |
| AUSTON MATTHEWS | C | TOR | 70 | 4.14 | 0.57 | 0.86 |
| DAVID PASTRNAK | R | BOS | 70 | 3.99 | 0.67 | 0.31 |
| PATRICK KANE | R | CHI | 70 | 3.93 | 0.34 | 0.27 |
| BRENDAN GALLAGHER | R | MTL | 59 | 3.83 | 0.90 | 0.49 |
| MIKA ZIBANEJAD | C | NYR | 57 | 3.65 | 0.89 | 0.86 |
| BRADY TKACHUK | L | OTT | 71 | 3.65 | 4.27 | 0.61 |
| TAYLOR HALL | L | ARI | 65 | 3.57 | 0.72 | 0.45 |
For forwards shots is a pretty quintessential category. Unlike defensemen, there are a much higher number of them who produce high rates (potentially obvious, given their role).
Our leaders for hits per game:
| Name | Pos | Team | GP | SOG/G | Hit/G | Block/G |
| RYAN REAVES | R | VGK | 71 | 0.86 | 4.45 | 0.34 |
| MATT MARTIN | L | NYI | 55 | 0.89 | 4.40 | 0.44 |
| BRADY TKACHUK | L | OTT | 71 | 3.65 | 4.27 | 0.61 |
| SAMMY BLAIS | L | STL | 40 | 1.40 | 3.88 | 0.38 |
| TOM WILSON | R | WSH | 68 | 2.26 | 3.72 | 0.85 |
| BRANDON TANEV | L | PIT | 68 | 1.40 | 3.59 | 0.96 |
| TYLER MOTTE | C | VAN | 34 | 1.12 | 3.47 | 1.09 |
| CAL CLUTTERBUCK | R | NYI | 37 | 0.95 | 3.43 | 1.03 |
| BRETT RITCHIE | R | BOS | 27 | 1.26 | 3.30 | 0.11 |
| NICK FOLIGNO | L | CBJ | 67 | 1.96 | 3.16 | 0.75 |
We start to deviate from D trends even further here. There is very little overlap between the players who perform well on hit rates and who perform well on shot rates. Some D manage to do both because of their time on ice and how they are used on the ice, but forwards very rarely are in positions where they are able to contribute well in both shots and hits. This holds true for blocks as well, though there is a bit more overlap between blocks and hits.
And blocks per game:
| Name | Pos | Team | GP | SOG/G | Hit/G | Block/G |
| NOEL ACCIARI | C | FLA | 66 | 1.64 | 1.83 | 1.56 |
| NICK BONINO | C | NSH | 67 | 1.55 | 0.25 | 1.33 |
| BOONE JENNER | C | CBJ | 70 | 2.56 | 1.56 | 1.14 |
| LUKE GLENDENING | C | DET | 60 | 1.25 | 2.42 | 1.12 |
| TYLER MOTTE | C | VAN | 34 | 1.12 | 3.47 | 1.09 |
| COLTON SCEVIOUR | C | FLA | 69 | 1.65 | 1.32 | 1.04 |
| CAL CLUTTERBUCK | R | NYI | 37 | 0.95 | 3.43 | 1.03 |
| PHILLIP DI GIUSEPPE | L | NYR | 20 | 1.75 | 1.90 | 1.00 |
| BRETT HOWDEN | C | NYR | 70 | 0.91 | 0.99 | 0.96 |
| RYAN GETZLAF | C | ANA | 69 | 2.06 | 1.75 | 0.96 |
In most standard Yahoo points leagues the value of each of these stats is about the same. In order to rank a multi-cat player when they all have different strengths and weaknesses, I am adding their average stats per game in each of these categories. It certainly is not a foolproof method and if your league assigns different weights to these categories you will obviously get slightly different results.
| Name | Pos | Team | GP | SOG/G | Hit/G | Block/G | Muli-Cat Points | |
| 1 | BRADY TKACHUK | L | OTT | 71 | 3.65 | 4.27 | 0.61 | 8.52 |
| 2 | ALEX OVECHKIN | L | WSH | 68 | 4.57 | 2.71 | 0.44 | 7.72 |
| 3 | TOM WILSON | R | WSH | 68 | 2.26 | 3.72 | 0.85 | 6.84 |
| 4 | BLAKE COLEMAN | C | T.B | 66 | 3.03 | 2.89 | 0.70 | 6.62 |
| 5 | MAX PACIORETTY | L | VGK | 71 | 4.32 | 1.27 | 0.49 | 6.08 |
| 6 | PATRIC HORNQVIST | R | PIT | 52 | 3.23 | 2.06 | 0.79 | 6.08 |
| 7 | BRANDON TANEV | L | PIT | 68 | 1.40 | 3.59 | 0.96 | 5.94 |
| 8 | EVANDER KANE | L | S.J | 64 | 3.38 | 2.11 | 0.39 | 5.88 |
| 9 | NICK FOLIGNO | L | CBJ | 67 | 1.96 | 3.16 | 0.75 | 5.87 |
| 10 | NATHAN MACKINNON | C | COL | 69 | 4.61 | 0.74 | 0.45 | 5.80 |
| 11 | MATT MARTIN | L | NYI | 55 | 0.89 | 4.40 | 0.44 | 5.73 |
| 12 | TYLER MOTTE | C | VAN | 34 | 1.12 | 3.47 | 1.09 | 5.68 |
| 13 | SAMMY BLAIS | L | STL | 40 | 1.40 | 3.88 | 0.38 | 5.65 |
| 15 | RYAN REAVES | R | VGK | 71 | 0.86 | 4.45 | 0.34 | 5.65 |
Honorable mention to Joel Armia (5.62), Jamie Benn (5.61), and Timo Meier (5.60).
Blocks as a category are not all that well represented in this form. That isn't surprising as the leaders are barely over one per game, whereas the leaders in shots and hits are over four per game. Guys like Tom Wilson, Branden Tanev, and Tyler Motte rank reasonably well in that category, which certainly helps to augment their good hits showing, and make up for their low shot totals.
It is not a surprise to see Ovechkin at the top of the rankings, it is a known quantity that his shot and hit generation is elite. Any concerns that he has been slipping due to age are still unfounded. The surprise (for me at least) certainly comes in the form of Brady Tkachuk. He has elite hitting numbers and excellent shot generation. It would not have been a surprise for him to be on this list, but his first rank, and leading Ovechkin by .8 points is impressive. Blake Coleman also certainly made a name for himself this season, but it does remain to be seen if he can keep up this kind of production with a new team and new deployment.
I next wanted to compare 2019-20 to our recent history and see if there were any trends.
If we look at shots first, in 2019-20 we have four players who are pacing higher than four shots per game, Nathan MacKinnon, Alex Ovechkin, Max Pacioretty, and Austin Matthews. Over the prior three seasons, only two have been able to keep that pace (Ovechkin and MacKinnon). We saw something similar with D, but also noted that there were more good shooters in past seasons. With forwards that trend does not hold. There were 33 players who were putting up between three and four shots per game over the course of the season. Over the past three seasons there were 25. With the number of good D shooters decreasing, one hypothesis certainly can be that the style of play in the NHL is shifting and taking shots away from D.
In our hits category we saw fewer elite hitters, and fewer good hitters in 19-20 compared to recent seasons for defensemen. For forwards the case is decidedly mixed. There are three hitters who were putting up over four hits per game in 19-20. There were no players doing that over the three prior seasons. That is balanced somewhat though in the good hitters. In 2019-20 there were 11 players who averaged 3-4 hits per game. Over the three prior seasons that number was 13. So, a couple of more elite hitters, but a couple fewer good hitters than in past seasons in 2019-20.
Blocks are up across the board. That would make sense if we were thinking about an increase in shot totals. In 2019-20 there were eight blockers putting up over one block per game and 24 putting up between .8 and one block per game. Over the past three seasons the numbers are lower with five blockers averaging over one per game, and 20 in the .8-1.0 range.
When taken as a unit though we have very similar numbers between the samples. There are two players in 2019-20 who are averaging more than seven multi-cat points per game Ovechkin and Tkachuk). It is the same in the prior three years. There are four players averaging between six and seven multi-cat points a game in 2019-20 and three over the prior three years. Going down a bit further, in 19-20 we have 25 players between five and six points per game and 23 In the prior three years.
That is all for this week. Thanks for reading.
Stay safe out there.
Want more tool talk? Check out these recent Frozen Tool Forensics Posts.
Frozen Tools Forensics: Multi-Cat Defensemen Past and Present
Frozen Tools Forensics: Helping make fantasy decisions
Frozen Tools Forensics: Comparing deadline acquisitions
Related Posts


UPCOMING GAMES
| Apr 24 - 19:04 |
| vs |
| |
| Apr 24 - 21:04 |
| vs |
| |
| Apr 24 - 22:04 |
| vs |
| |
Starting Goalies
Top Skater Views
Top Goalie Profile Views
LINE COMBOS
| Frequency |
| |
|---|---|---|
| 19.3 | JACK QUINN DYLAN COZENS ZACH BENSON | |
| 12.4 | VICTOR OLOFSSON TYSON JOST ZEMGUS GIRGENSONS | |
| 11.3 | ALEX TUCH JJ PETERKA JORDAN GREENWAY | |
DobberHockey Podcasts

Fantasy Hockey Life: Salary Cap Basics Remix
If you missed last year’s series on salary leagues, this is a remix with some bonus material. Jesse and Victor discuss the different ways you can step up your dynasty league with a salary component. Our show is part of the Dobber Podcast Network and sponsored by Fantrax.com. Email [email protected] and ask to join our […]

Keeping Karlsson: No. 533 – Ultimate Champion Interview + Playoff Preview
On this week’s Keeping Karlsson Fantasy Hockey Podcast mega-show, Elan and Brian gather and analyze the latest fantasy hockey news, notes and data.
Fantasy Hockey Life: Tim-Eh’s Time in the TIDY Top Tier
When one of the managers in the TIDY league top tier left midseason, Patron Tim volunteered to give up his excellent team to take over a mid-season orphan fighting to escape relegation. And Tim did not go quietly. Ryan, Jesse and Victor welcome Tim to talk through his experience and the trades he made in […]
Keeping Karlsson: Better Off Nedeljkovic
On this week’s Keeping Karlsson Fantasy Hockey Podcast mega-show, Elan and Brian gather and analyze the latest fantasy hockey news, notes and data from the past season to work on projecting the 2023-24 NHL and fantasy hockey season. — Join the Keeping Karlsson patron community! Patrons get guaranteed KKUPL invitations, plus monthly bonus AMA episodes, and full access to […]
Fantasy Hockey Life: FHL Player Cards with Brandon
Our guy Brandon has been doing great work behind the scenes to great Fantasy Hockey Life prospect player cards, visualizations with the metrics we care about most – including BASH. These are a great tool to catch at a glance the stats for upcoming players. Jesse interviews Brandon and Victor on the decisions behind what […]