Capped: Identifying the top value years from draft slotting
Alexander MacLean
2020-07-02
We have made it to July. The year of 2020 is half gone, and I think that's the optimist's way of looking at things.
Two weeks ago, Jokke Nevalainen of our DobberProspects site put together an excellent analysis of the probabilities for the reward of different draft pick ranges (if you haven't read it yet, check it out here before you read my article). For years I had been meaning to look into whether there was any advantage to be gained in salary cap leagues based on picking players later into the first round for their expected production vs cap hit. The problem was that I didn't really know how to go about looking into it, and as a result it has just sat there on my list of brainstorming ideas for Capped articles. Well, with the help of Jokke's data and some free time this past week I managed to put together some results related to how best to mine value in cap leagues.
The main lump of time this week was taken just sorting all of the data into Excel. I only used the NHL first round, because as Jokke found, the fantasy relevant talent past pick 30 really drops off. From there, I went back to the beginning of the cap era, and collected every first-round pick's entire contract history from 2005 (the beginning of the cap era) to the 2014 draft (giving most of the draft class enough time to have signed their second contracts). With this data I was able to convert all of the cap hits into percentages of the cap, and then from there I was able to amalgamate the cap percentages into a few charts to make some comparisons. Then, using an approximation of expected value from Jokke's numbers, I made a few modifications and inputted each of the value ranges into my salary cap ranking algorithm to try and sort out where the highest value versus cost can be found.
****
Managing the Data
The player sets are broken into four tiers, generally based on the expected value to be found by those draft slots. We have the top two picks, slots three through seven, eight to 14, and 15 to 30. Each of these sections was averaged out from the years 2005 through 2014 to give us an established 10-year sample size all within the cap era. For each set of draft slots, their contract averages were taken in three year increments from when they were drafted (in order to keep consistency within draft classes and between years). For each set of draft slots I ended up with an average percent of the cap in five yearly segments (years one through three, four through six, etc). The cap hit percent was multiplied by the current $81.5 Million cap to show in today's cap world, how much NHLers were being paid by year for their draft slot range.
A few other assumptions I made with the data:
-Contracts were only used if the player played an NHL game under that contract.
-Cap Hit was used, and for contracts signed after the start of a season, the original value was used (William Nylander's recent contract was inputted as $7.5 Million over the six years).
-Contracts that were bought out were removed from the buyout year on.
-ELCs used to be a higher percent of the cap, and that is why the year one-three salaries show up as being averaged to over $1 million now.
****
Conclusions and Values
As expected, the players that are drafted highest get paid the most, and players continue to earn more over time up until they pass age 30 when the contracts start to dip a little. What was surprising was the drastic amount that the top two picks make versus even picks three through seven. However, if you have ever seen the draft pick value charts, the salary curves look eerily similar.
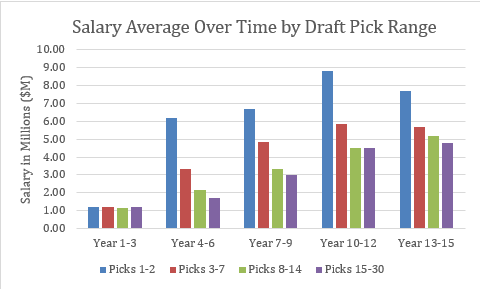
All in all, it looks as though if you have a top-two pick you should expect to be paying up by year four, with a next larger contract around year 10. For the rest of the first round we see a steadier rise, generally peaking around years 10-12, but with the back half of the first-round picks still going up slightly into their teen years.
Moving on from there, I borrowed some of Jokke's data to add some context and depth to the actual return on investment. For those that didn't read the article linked in the beginning, I find these two charts below to be the ones that sum up the data the best.
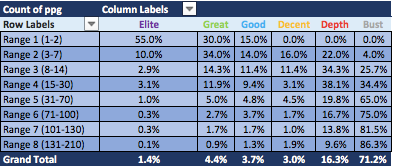
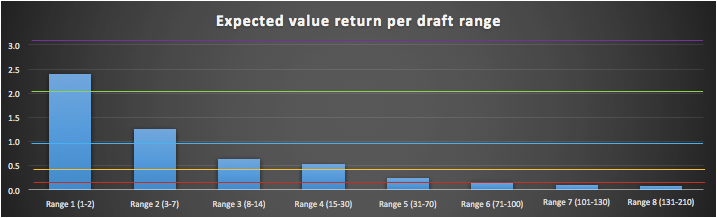
The highest quality and value is focused to the beginning of the draft, and as you can see from the second chart, the value returned in each draft slot is halved for each of the first couple step downs, and then slowly levels off after that.
Putting the two results together, we have the best players being the ones drafted earlier, and also getting the bigger contracts faster. The problem would usually be synthesizing those two conclusions to sort out where the best value for money can be found. Luckily for us, I was able to convert Jokke's data based on the expected return per draft range into some placeholder "players" to plug into my salary cap keeper value formula which I use for the bi-monthly top 200 rankings. This gives us a value discrepancy that takes into account age, current and future production, current and future cap hit, and balances them all to show where the best bang for your buck is. Any guesses where the top value is?
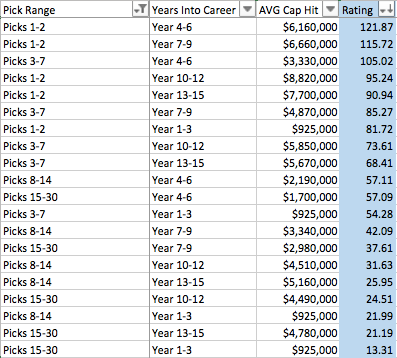
There you have it. The top values are still the prime-year, top picks. It matters little that they are getting paid the most, these top players are still the most valuable pieces of your team. I even put in one more trial player to mimic the top players like Mitch Marner who have produced some high numbers in their rookie deals and are seeking their big money deals right out of the gate. The value came in almost dead on the 121 rating of the expected peak years of the top picks, with the higher known production balancing out with the higher cap hit.
As always, any time you can get a bargain player it's something you should look into for your team's sake, but at the same time, it's tough to build a winning team without those star players. Don't be afraid to pay fairly in cap leagues for those top picks/players, they should pay off in the long run.
The other note of interest is how little value those rookies have from the back end of the first round. This is why rebuilding can take forever, because picks outside of the top eight can take forever to be valuable. If you're stocking up on picks and waiting for them to pan out, expect to be in the rebuild for five years – but that's a topic for another day.
****
I hope you enjoyed reading that as much as I enjoyed diving into it to write it. If you have any article topics you would like something written on, give me a shout! You can find me on Twitter @alexdmaclean for questions, comments, or article requests.
And stay safe!
****
Previous Capped articles:
Related Posts
UPCOMING GAMES
| Apr 26 - 19:04 |
| vs |
| |
| Apr 26 - 19:04 |
| vs |
| |
| Apr 26 - 22:04 |
| vs |
| |
| Apr 26 - 22:04 |
| vs |
| |
Starting Goalies
Top Skater Views
Top Goalie Profile Views
LINE COMBOS
| Frequency |
| |
|---|---|---|
| 23.1 | BRADY TKACHUK SHANE PINTO DRAKE BATHERSON | |
| 20.4 | MATHIEU JOSEPH RIDLY GREIG CLAUDE GIROUX | |
| 16.7 | JIRI SMEJKAL ZACK MACEWEN DOMINIK KUBALIK | |
DobberHockey Podcasts

Fantasy Hockey Life: Salary Cap Basics Remix
If you missed last year’s series on salary leagues, this is a remix with some bonus material. Jesse and Victor discuss the different ways you can step up your dynasty league with a salary component. Our show is part of the Dobber Podcast Network and sponsored by Fantrax.com. Email [email protected] and ask to join our […]

Keeping Karlsson: No. 533 – Ultimate Champion Interview + Playoff Preview
On this week’s Keeping Karlsson Fantasy Hockey Podcast mega-show, Elan and Brian gather and analyze the latest fantasy hockey news, notes and data.
Fantasy Hockey Life: Tim-Eh’s Time in the TIDY Top Tier
When one of the managers in the TIDY league top tier left midseason, Patron Tim volunteered to give up his excellent team to take over a mid-season orphan fighting to escape relegation. And Tim did not go quietly. Ryan, Jesse and Victor welcome Tim to talk through his experience and the trades he made in […]
Keeping Karlsson: Better Off Nedeljkovic
On this week’s Keeping Karlsson Fantasy Hockey Podcast mega-show, Elan and Brian gather and analyze the latest fantasy hockey news, notes and data from the past season to work on projecting the 2023-24 NHL and fantasy hockey season. — Join the Keeping Karlsson patron community! Patrons get guaranteed KKUPL invitations, plus monthly bonus AMA episodes, and full access to […]
Fantasy Hockey Life: FHL Player Cards with Brandon
Our guy Brandon has been doing great work behind the scenes to great Fantasy Hockey Life prospect player cards, visualizations with the metrics we care about most – including BASH. These are a great tool to catch at a glance the stats for upcoming players. Jesse interviews Brandon and Victor on the decisions behind what […]