Wild West: Shot Attempts by Team
Grant Campbell
2021-02-01
Weekly Western Leaders (to January 31st, 2021)
Goals – 8 – Brock Boeser – Vancouver, Connor McDavid – Edmonton
Assists – 15 – Leon Draisaitl – Edmonton
Points – 22 – Connor McDavid – Edmonton
PPP – 10 – Connor McDavid – Edmonton
Shots on Goal – 43 – Connor McDavid – Edmonton
Shooting % (min 10 SOG) – 45.5 – Joonas Donskoi – Colorado
PIM – 27 – Mark Borowiecki – Nashville
Best plus/minus – plus 11 – Justin Faulk – St. Louis
Worst plus/minus – minus 10 – Kyle Turris – Edmonton
Hits – 45 – Tyler Motte – Vancouver
Blocked shots – 35 – Adam Larsson – Edmonton
FOW – 128 – Bo Horvat – Vancouver
FOL – 97 – Bo Horvat – Vancouver
FO% (min 60 FO) – 64.7 – Pierre-Edouard Bellemare – Colorado
Giveaways – 18 – Calvin De Haan – Chicago
Takeaways – 10 – Mark Scheifele – Winnipeg
Highest GAR (goals above replacement) – 5.4 – Cale Makar – Colorado
Lowest GAR – minus 2.8 – Tyson Barrie – Edmonton
Highest xGAR (expected goals above replacement) – 5.4 – Shea Theodore – Vegas
Lowest xGAR – minus 2.4 – Mattias Janmark – Chicago
Highest CF% (min 6 GP) – 63.5 – Gabriel Landeskog – Colorado
Lowest CF% (min 6 GP) – 31.2 – Alex Chiasson – Edmonton
Highest PDO (min 6 GP) – 112.7 – Nikolaj Ehlers – Winnipeg
Lowest PDO (min 6 GP) – 85.7 – Alex Chiasson – Edmonton
Goalie wins – 6 – Philipp Grubauer – Colorado
Save percentage (min 5 starts) – 93.7 – Kevin Lankinen – Chicago
Quality starts – 5 – John Gibson – Anaheim, Philipp Grubauer – Colorado, Jordan Binnington – St. Louis, Kevin Lankinen – Chicago
Quality start % (min 5 starts) – 83.3 – Kevin Lankinen – Chicago
Shutouts – 2 – John Gibson – Anaheim, Philipp Grubauer – Colorado, Jacob Markstrom – Calgary
I thought we would look at each team in the West and dig a little deeper on shot attempts by teams and a few players. All attempts are not equal and this kind of analysis is focused on the bigger picture and the philosophy that you can't score if you don't shoot. All stats are taken from Dobber's Frozen Tools and NHL.com.
So far this season NHL teams have averaged 2.957 goals per game on an average of 29.83 shots per game which is a 9.85 shooting percentage. The average number of shot attempts per game is 54.07 of which 13.06 are blocked (24.1 percent of SAT) and 11.18 miss the net (20.68 percent). The NHL average for shot attempts that result in shots on net is 55.17 percent.
Anaheim
As a team, the Ducks are averaging 23.8 shots on goal through ten games while averaging 48.3 shot attempts which is a 49.27 percent shot on goal rate. The team has 28.36 percent of their shots blocked and 22.37 percent miss the net which are both higher than the NHL average. The combination of fewer shot attempts and shots on goal has severely limited the Ducks offence to the tune of 1.60 goals per game although their shooting percentage of 6.72 should increase.
Rickard Rakell is the leader by far in shot attempts (SAT) with 64 so far this season, with 34 being on the net which partially explains his 2.9 shooting percentage to date. Rakell is averaging 6.4 shot attempts per game which is pretty impressive and should translate into points sooner than later. The next highest Duck with attempts is Danton Heinen with 40 (4.0). Sam Steel is averaging 1.7 shot attempts per game, which won't produce many goals, unfortunately.
Arizona
The Coyotes are pretty close to the league average at 28.12 shots/g and 55.88 SAT/game for a 50.3 percent shot on goal rate. Arizona misses the net about 25.7 percent of the time which is above the league average of 20.68. The team shooting percentage is 8.89.
Jakob Chychrun leads the team with 51 SAT (6.37/g) and is closely followed by Conor Garland with 50 (6.25/g). Phil Kessel and Clayton Keller who I would have assumed would be leading the team in this regard have 36 and 35 attempts respectively. Barrett Hayton only has nine SAT in seven games. Garland is emerging as the go-to shooter as he has hit the net 64 percent of the time and is on pace for a 21-goal season in 56 games.
Calgary
The Flames are averaging 30 shots on goal per game along with 55.14 SAT for an average of 54.4 percent that hit the net. Calgary is averaging 2.86 goals per game with a shooting percentage of 9.52.
I would have guessed that Matthew Tkachuk led the team in SAT and I was correct as he has 42 attempts in his seven games, good for 6/game. Elias Lindholm, Sean Monahan and Johnny Gaudreau are utilized very similarly with Lindholm at 33 and the other two at 31. Derek Ryan will be hard-pressed to have his fifth straight year of 10 goals or more as he only has 11 attempts in seven games with only three of those on target.
Chicago
Chicago has been averaging 30.7 shots on the net but only 50.1 shot attempts for a shot on the net percentage of 61.28 which will be difficult to maintain, so expect a slight decrease in shots at some point. The Blackhawks are averaging 2.60 goals per game with a shooting percentage of 8.47. Chicago has only missed the net 14.57 percent of the time which is much better than the league average, while their shots being blocked is right around the average at 25.35.
Patrick Kane has 63 SAT in 10 games (6.3/game) with Dominik Kubalik next on the team at 48 SAT (4.8). Alex Debrincat was at 4.25 before he was held out of the lineup after six games. Pius Suter has 21 SOG on only 25 SAT, so either he is being far too selective or his SOG will decrease. I'm going to guess at the latter so be wary of Suter's production from here on unless he starts generating more attempts.
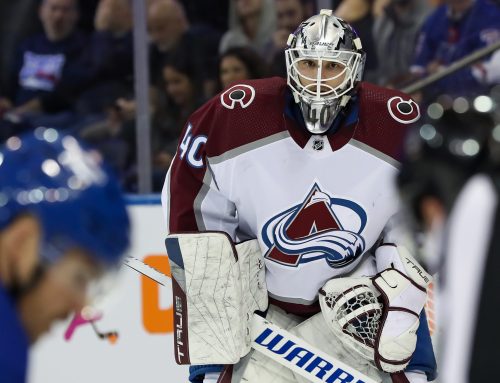
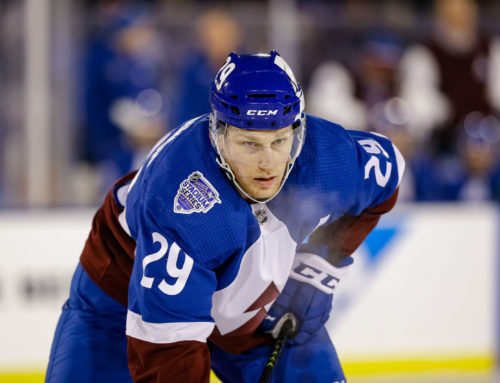
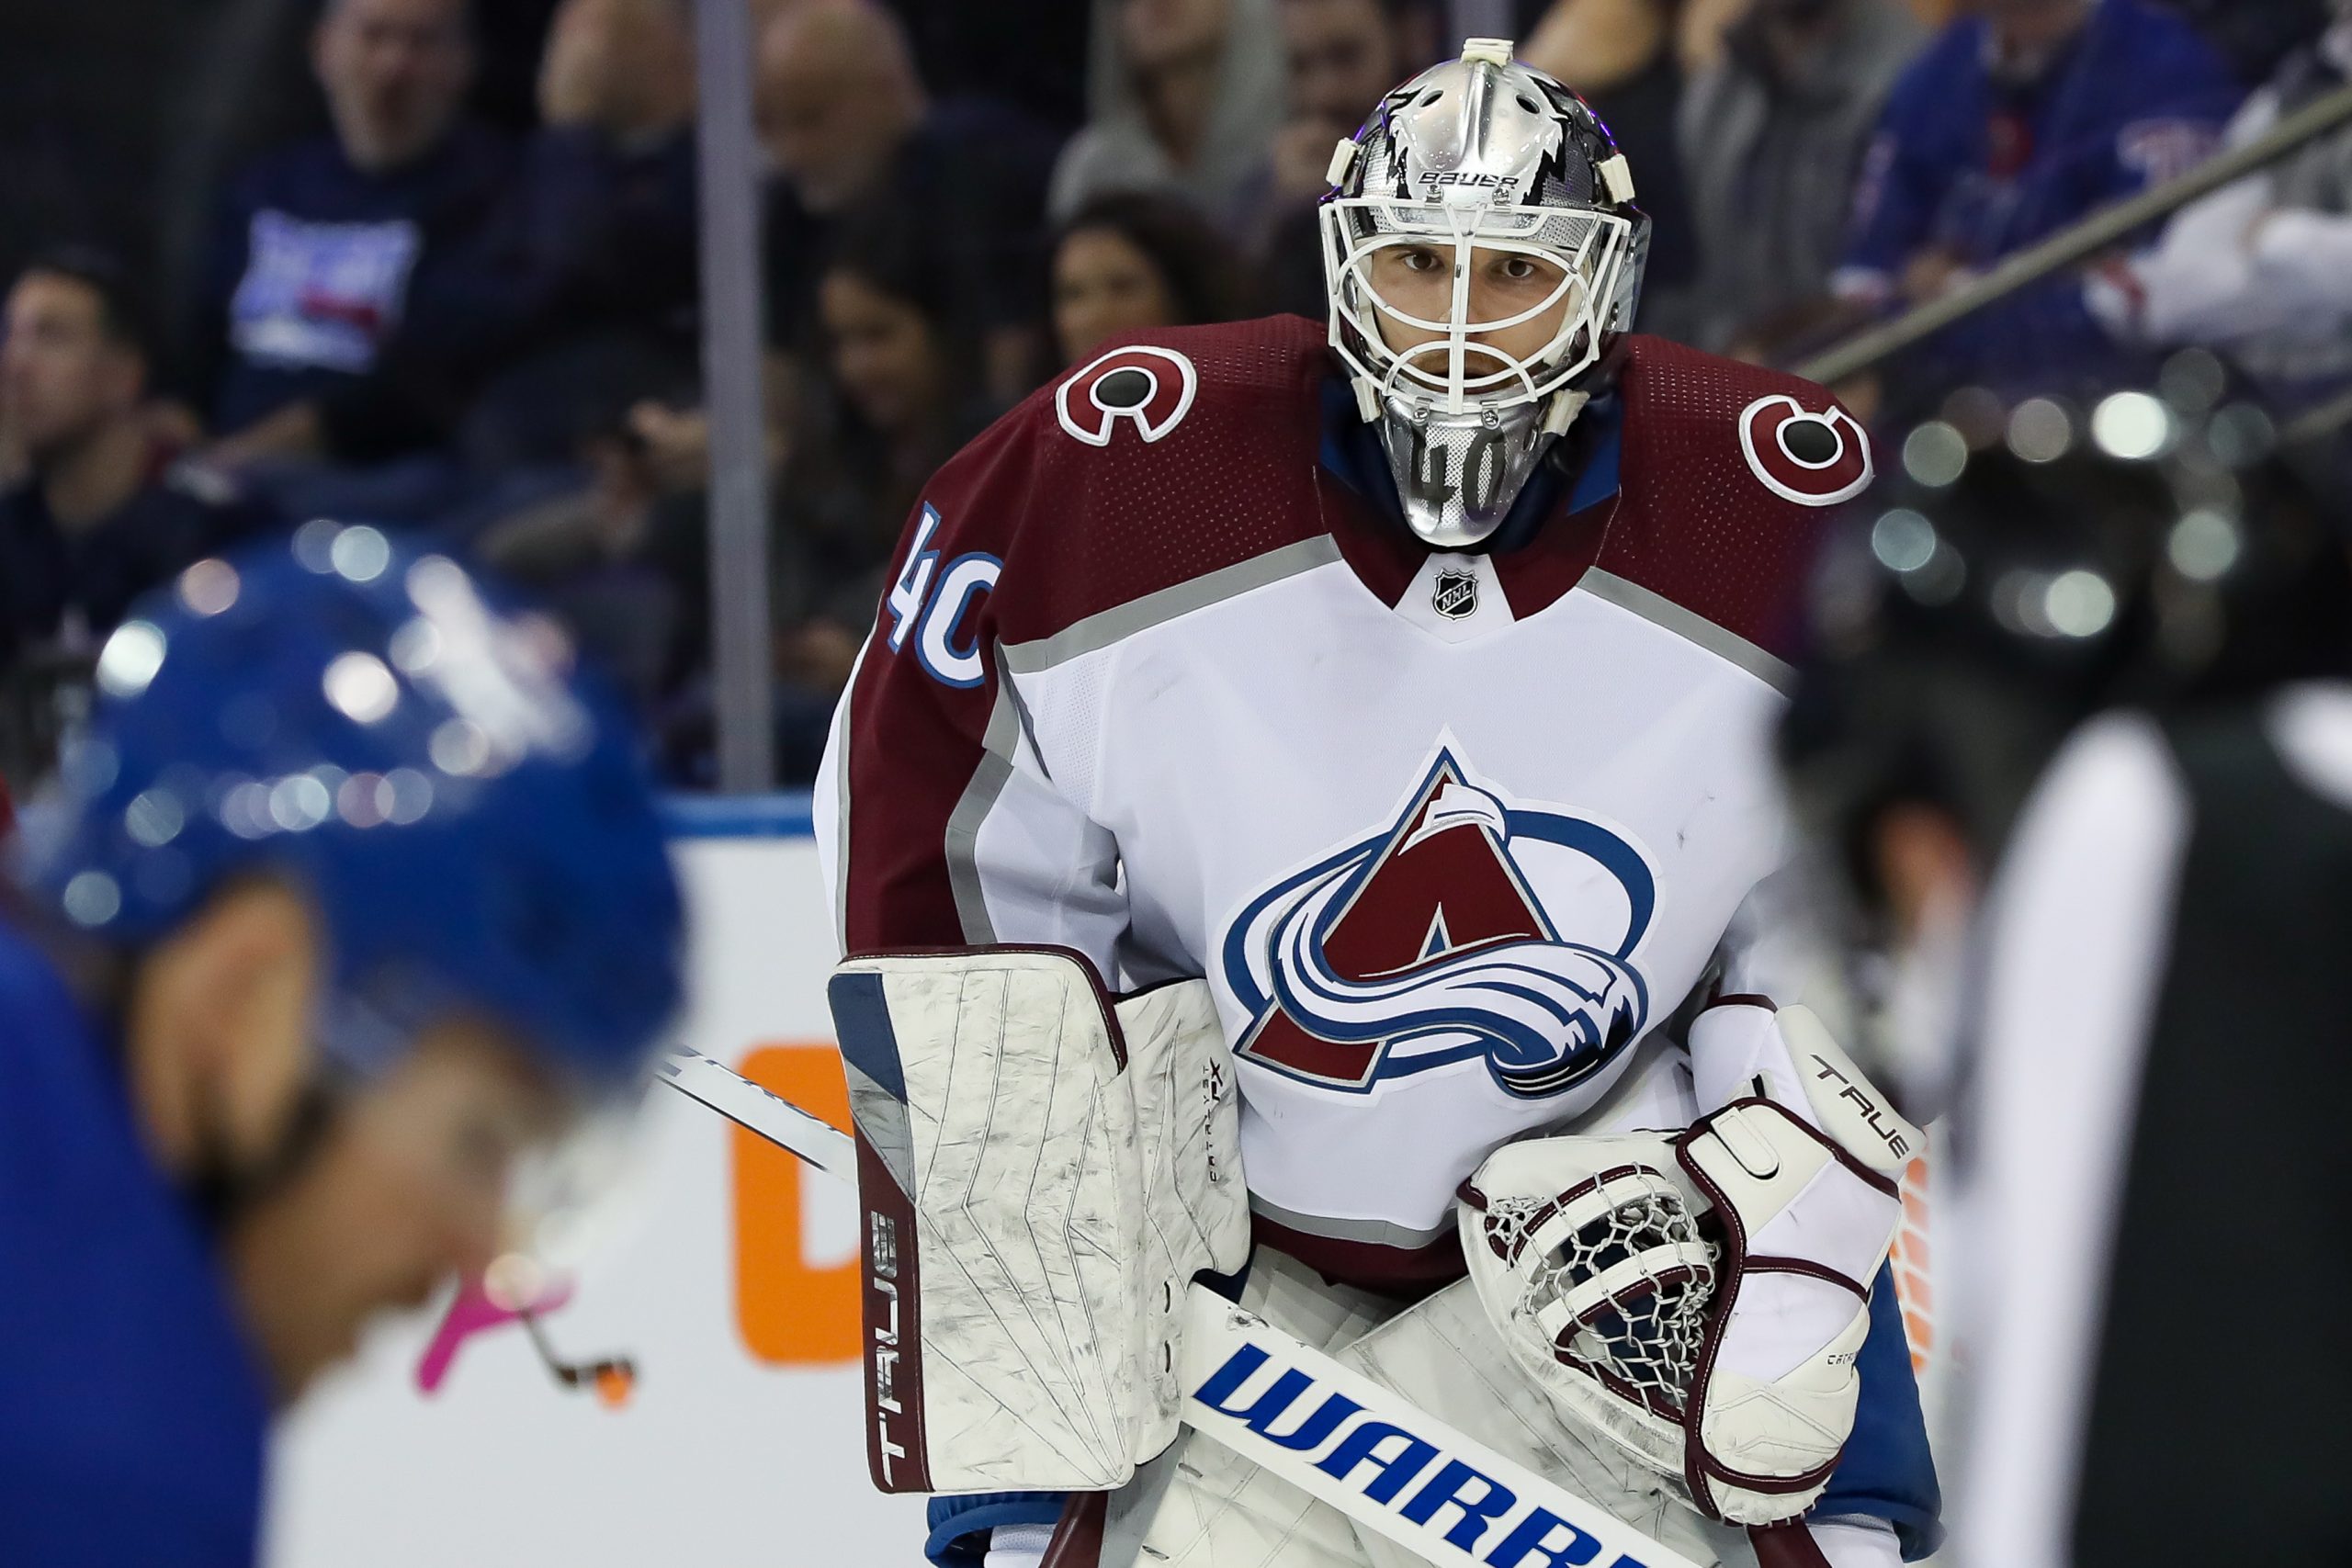
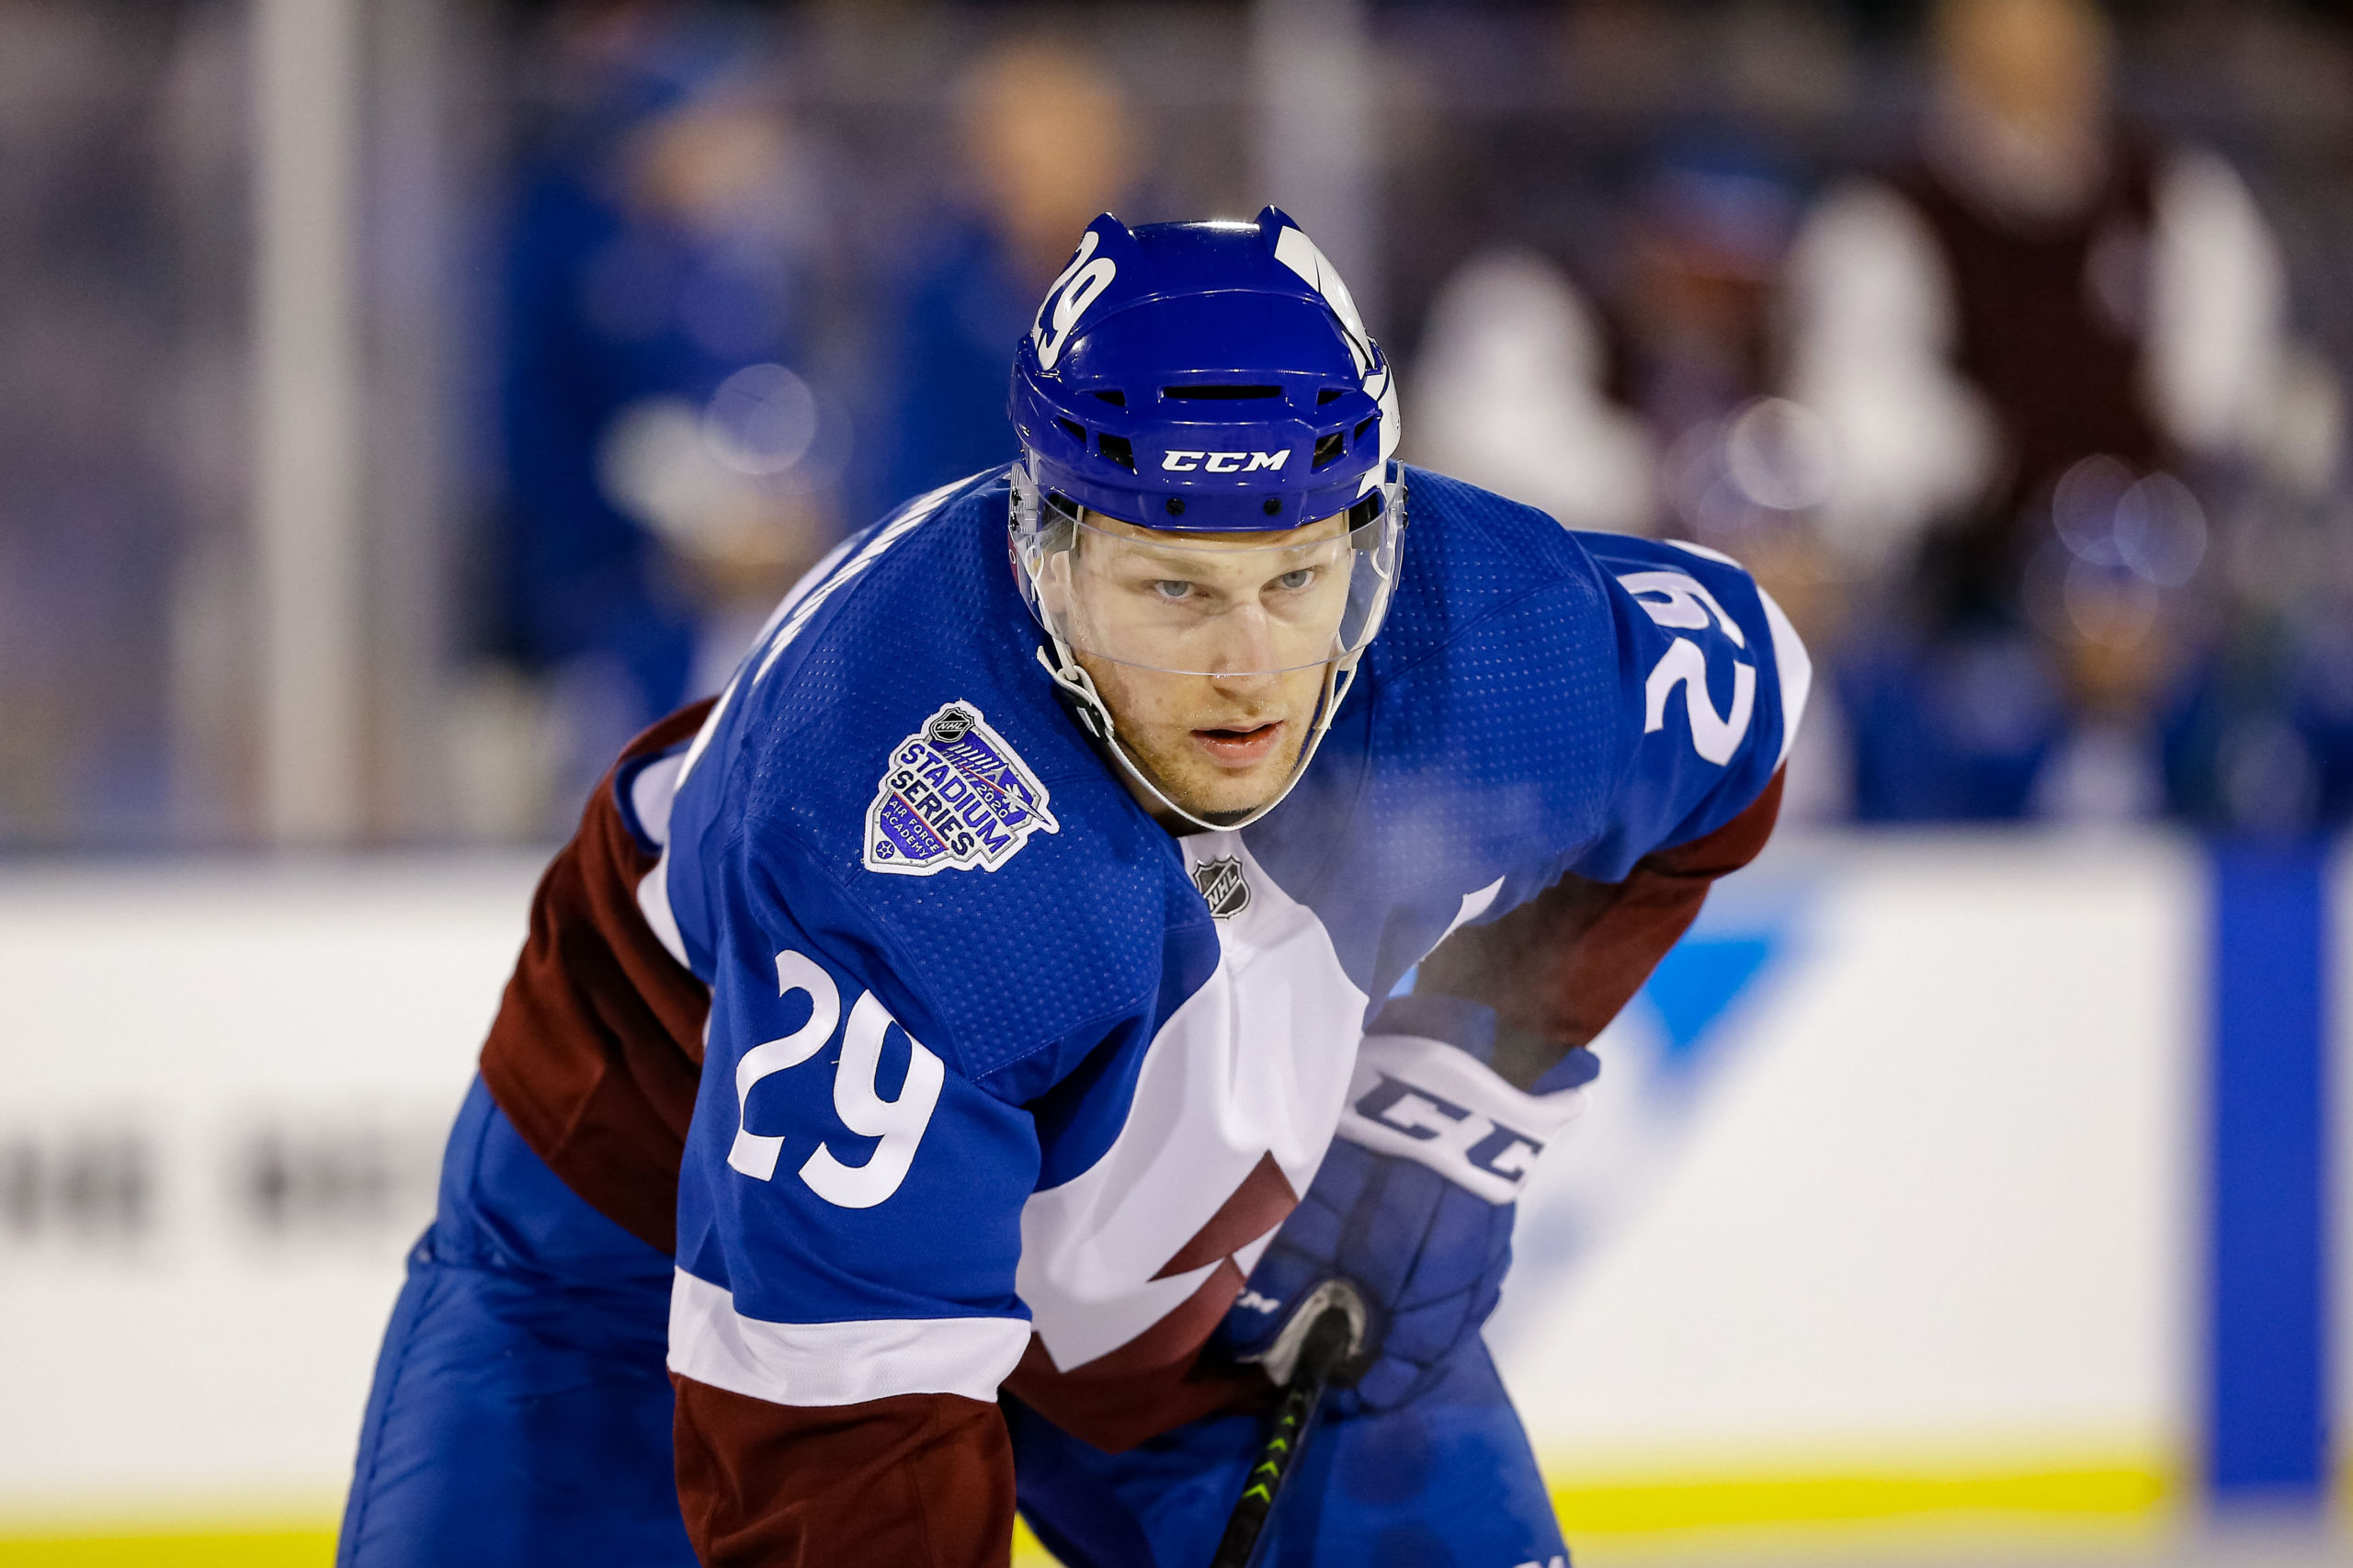
Colorado
This roster is loaded with firepower and is averaging 31.8 shots/game with 60.00 SAT/game for a shot on the net percentage of 53.00 which is slightly below average. The Avalanche are averaging 3.60 goals/game with a shooting percentage of 11.32 which is higher than the league average of 9.88. Expect this to slightly come down.
No surprise at all that Nathan MacKinnon leads the team with 78 SAT over 10 games for an average of 7.8 per game. The team is not a one-trick pony as Nazem Kadri, Cale Makar, Mikko Rantanen and Gabriel Landeskog are all over 50 attempts. Even though he missed some games Andrei Burakovsky only has 18 attempts and 10 shots in his seven games so far. Something to monitor as he has never been a big shot producer, but he won't be able to exceed his goal rates from prior seasons with only 2.43 attempts per game.
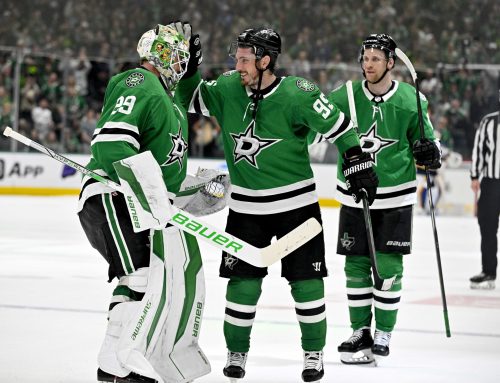
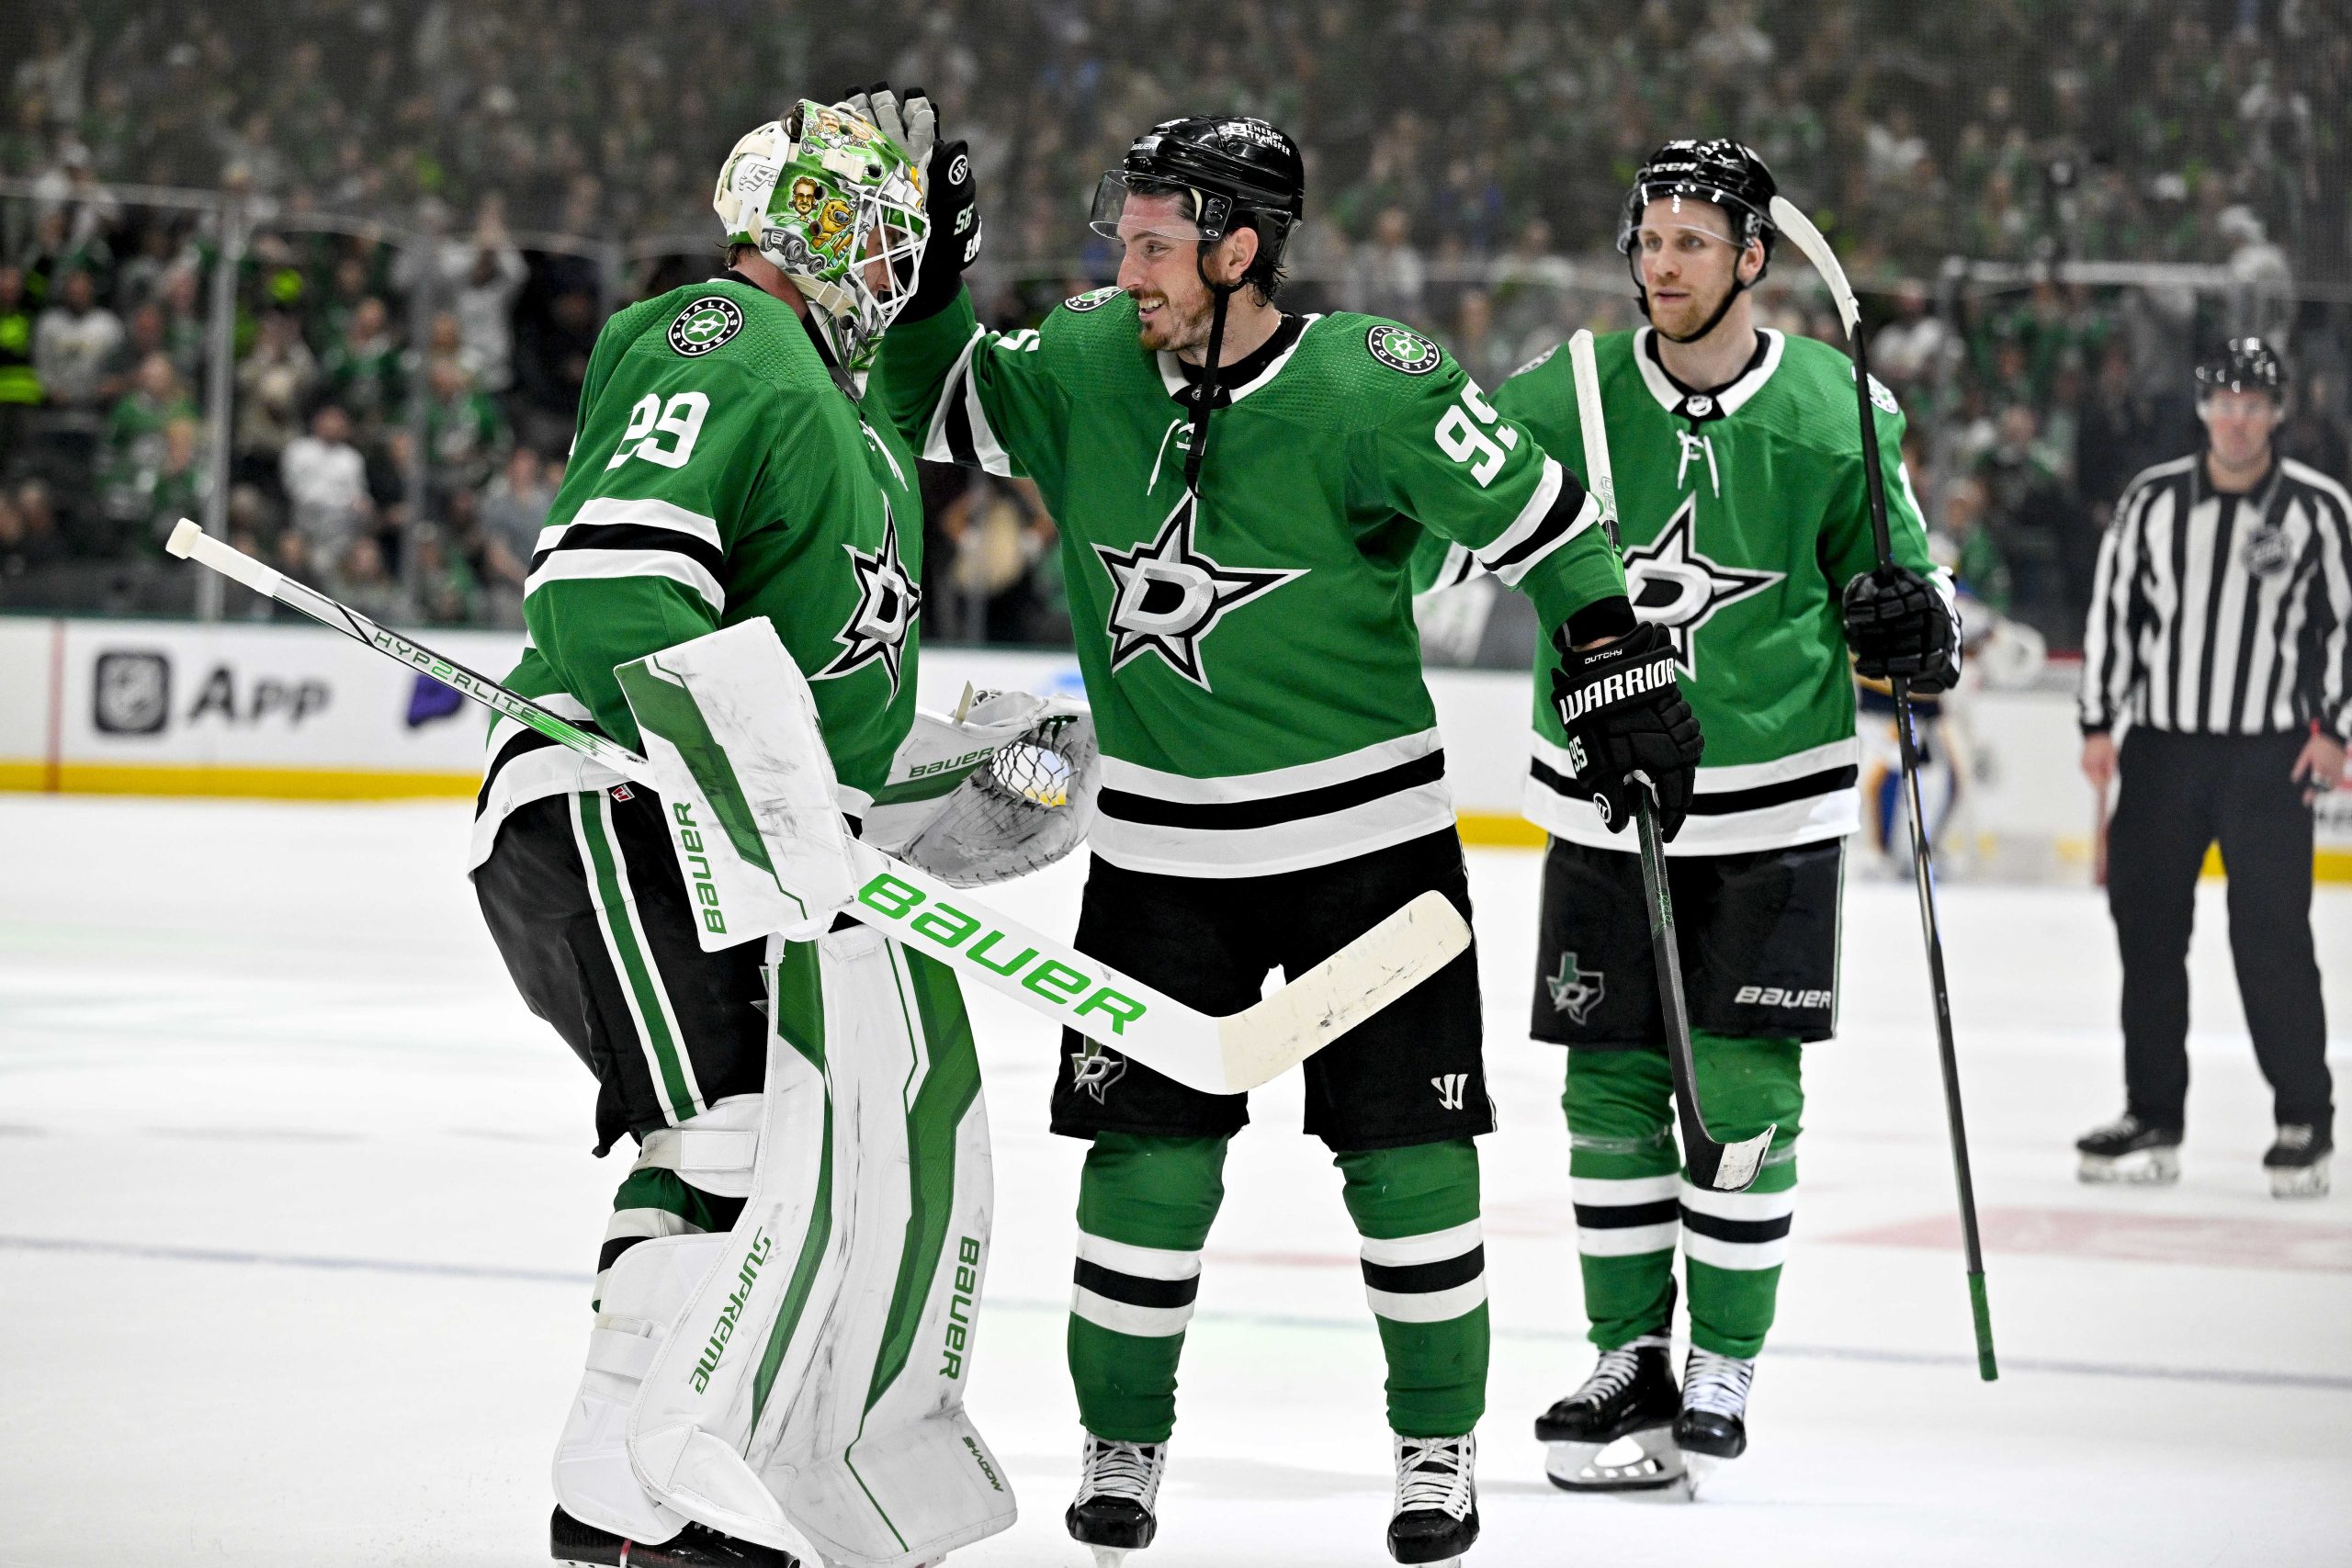
Dallas
The Stars have averaged 3.83 goals per game after their delay to begin the season. The concern is that they have only averaged 23.5 shots on goal per game along with 49.0 shot attempts per game, which are both below league average. Their team shooting percentage is an unsustainable 16.31 percent so we can expect a severe correction in the next 10-15 games. The team has had 29.25 percent of their attempts blocked so expect a few more of these shots to get through in the future.
Denis Gurianov has emerged as a prominent part of the Stars offence as he leads the team with 36 shot attempts in six games for an average of 6.0 attempts per game. Joe Pavelski is next on the list with 32 shot attempts for an average of 5.3 per game. Pavelski's shooting percentage is 35.7 with five goals in six games.
Edmonton
The Oilers have been hit and miss this season and have averaged 3.45 goals per game and are averaging 31.54 shots/game with 56.91 attempts per game. All are above average including their team shooting percentage of 10.95.
I was quite surprised to see a name other than Connor McDavid or Leon Draisaitl leading this team in shot attempts, but none other than Ryan Nugent-Hopkins is there. He has 65 shot attempts in 11 games (5.91/game), followed closely by McDavid with 59 (5.36) and Draisaitl with 52 (4.73) and newly acquired Tyson Barrie also has 52 SAT but has had 22 of those attempts blocked, so perhaps look for Barrie to improve his shots getting through shortly. Jesse Puljujarvi has been consciously hitting the center of the net it appears with 27 SOG on 34 SAT. He is either very unlucky or not aiming for the top corners. I would expect more attempts with less SOG as there is no way he will sustain hitting the net 79.4 percent of the time.
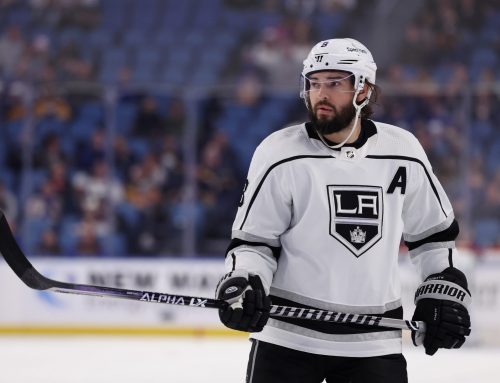
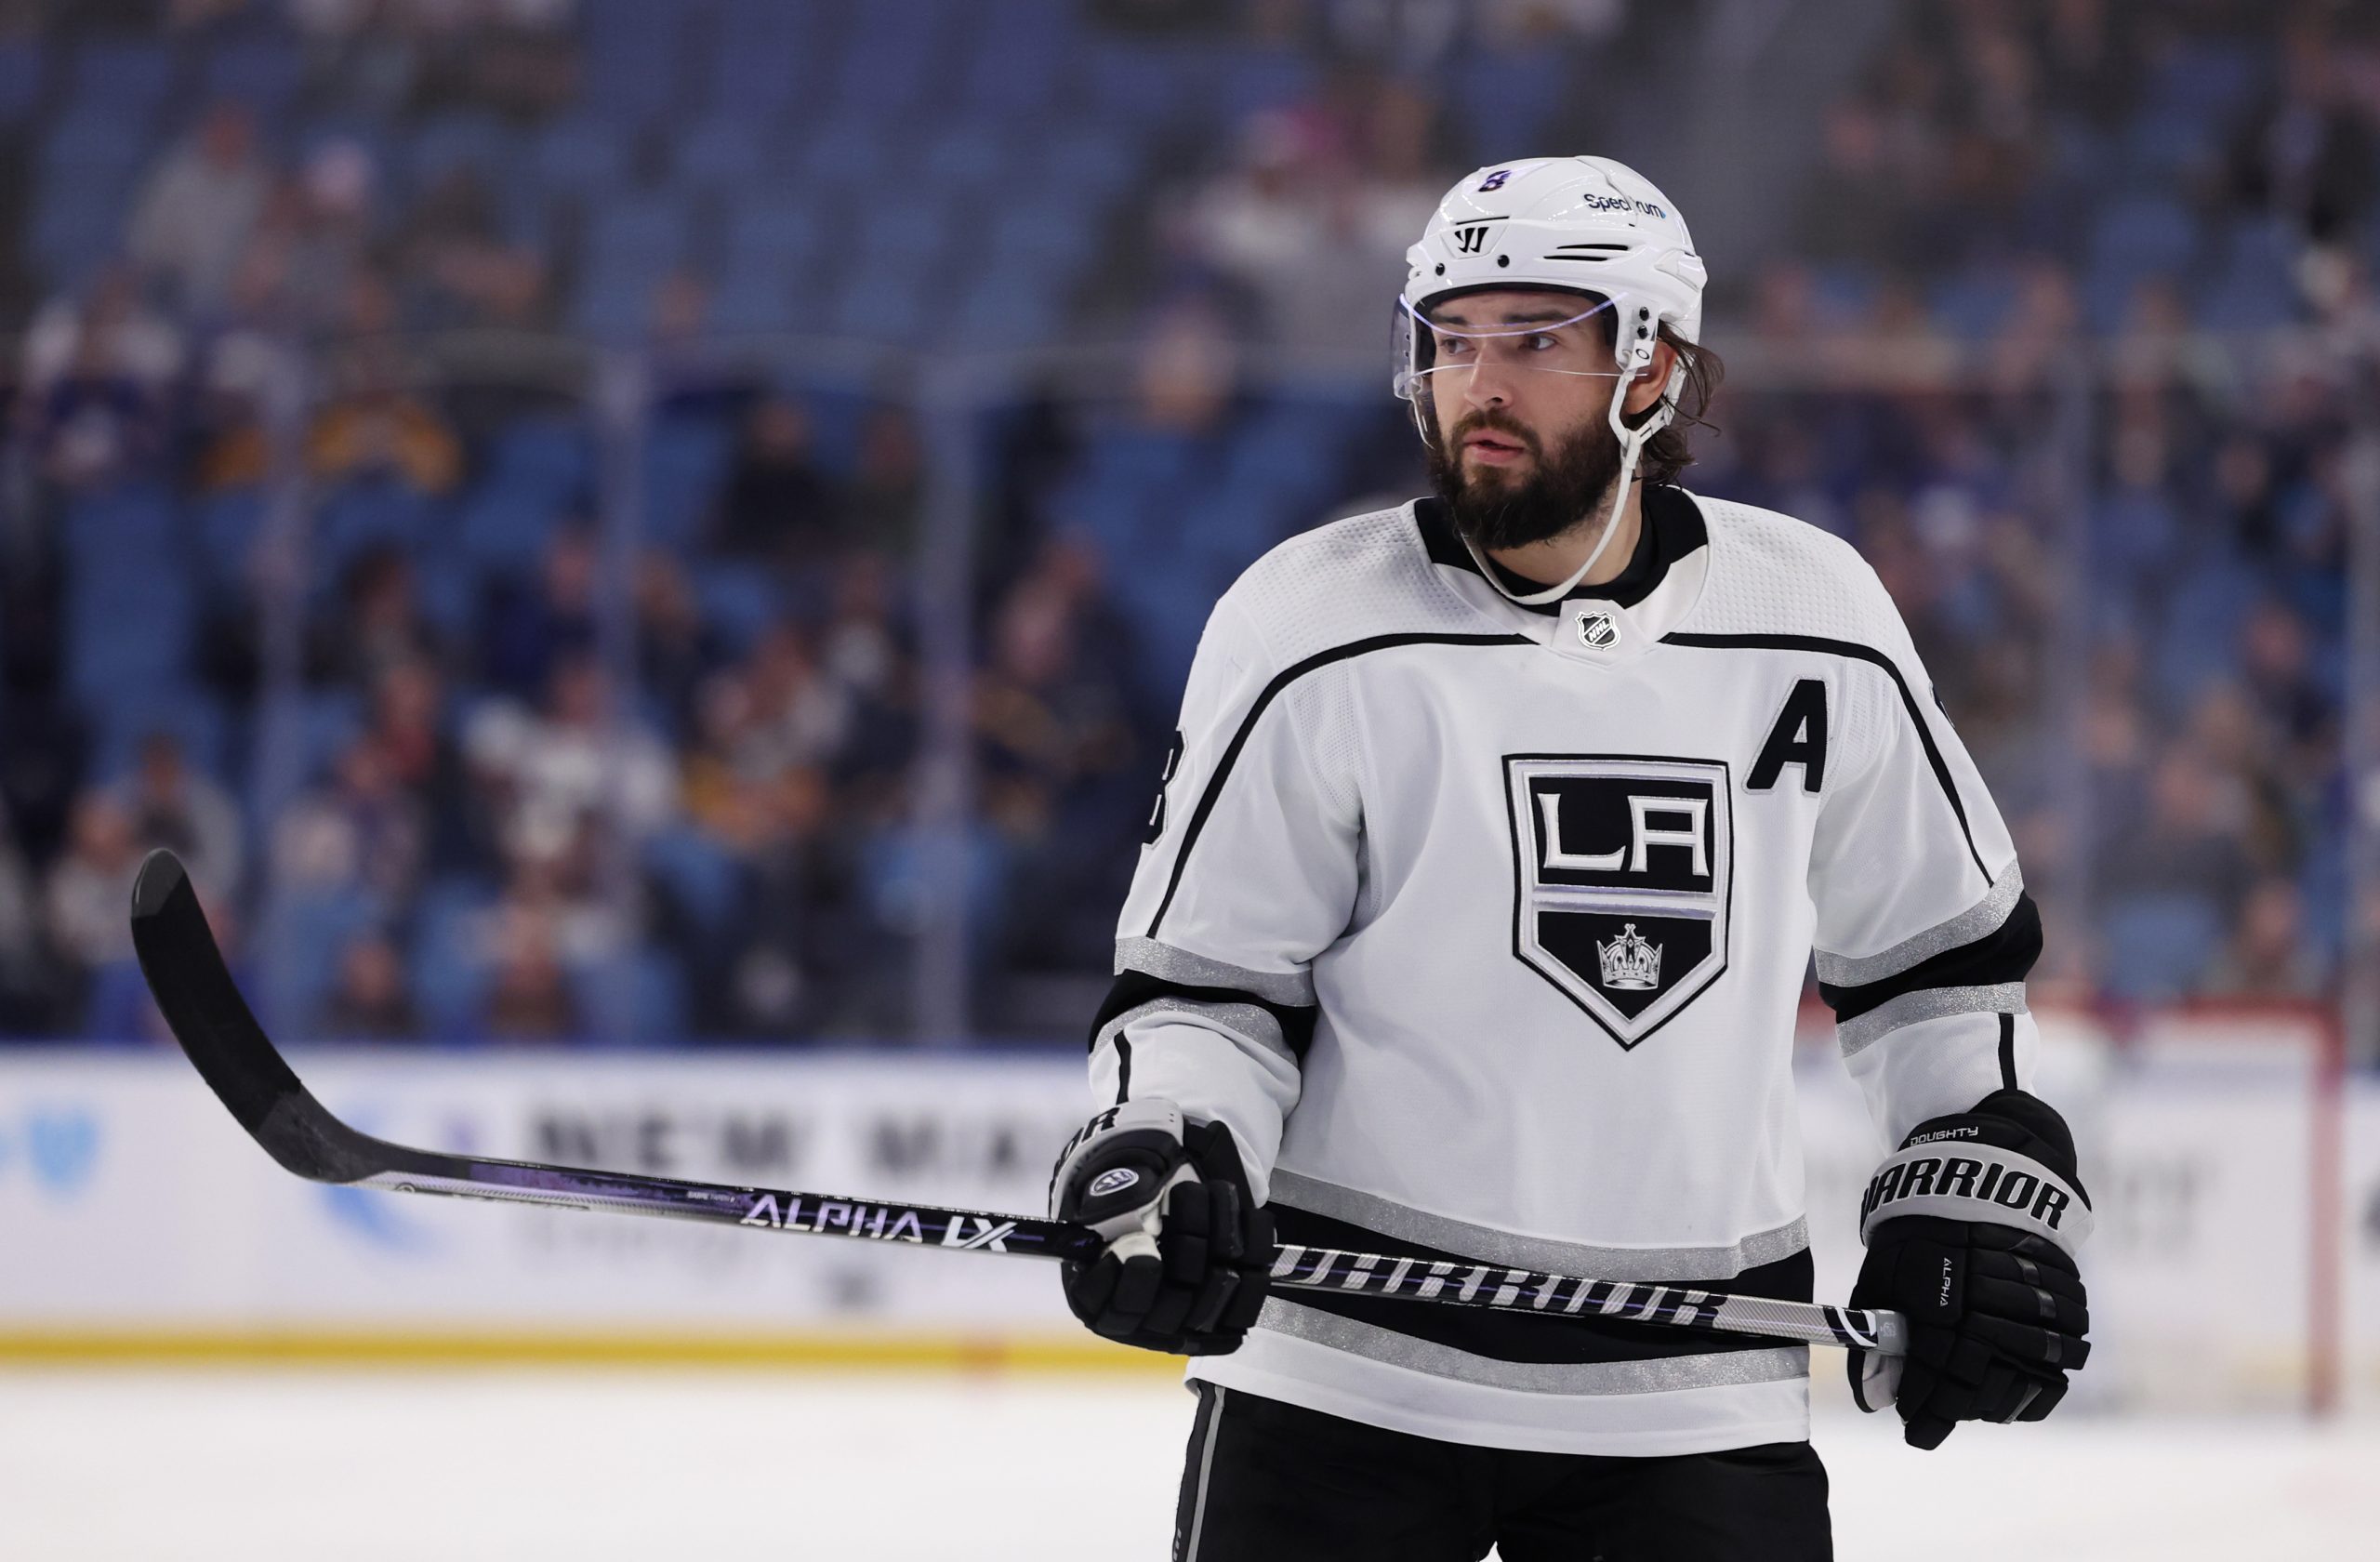
Los Angeles
The Kings have been better offensively than I would have given them credit for this early in the season. They are averaging 3.125 goals/game on 29.125 shots/game with 53.5 SAT/game. Their team shooting percentage is a little high at 10.72 and will surely come down a little.
The veterans are still leading the charge in LA with Anze Kopitar generating 41 SAT in 8 games (5.125/game) followed closely by Drew Doughty at 5/game and Alex Iafallo at 4.75/game. Gabriel Vilardi and Andreas Athanasiou have had trouble hitting the net with only seven shots on goal each this year but the troubling stat for both is that they are only averaging about 2.5 SAT/game. Both Vilardi and Athanasiou have 42.9 shooting percentages so far and they aren't going up.
Minnesota
The Wild have averaged 2.90 goals per game on 30.9shots/game with 55.1 SAT/game. The team shooting percentage is 9.39 so the Wild are pretty much average in every category.
Kevin Fiala has been suspended for three games but still leads the Wild with 54 SAT in eight games (6.75/game) followed by Ryan Suter with 51 SAT in ten games (5.1/game). Rookie Kirill Kaprizov has 38 SAT in ten games (3.8), while Joel Eriksson Ek has 29 SOG on 35 attempts (3.5) and has hit the net 82.9 percent of the time. That percentage can't continue so look for his shooting percentage of 17.9 or his SOG to decrease sooner than later.
Nashville
The Predators have struggled out of the gate with only 2.38 goals/game on 32.38 shots/game with 60.125 SAT/game. The team shooting percentage is only 7.34 so the Predators should see their goal production increase shortly.
The offence is fairly spread out in Nashville with Viktor Arvidsson leading the team in SAT with 53 in eight games (6.625/game) followed by Filip Forsberg at 52 (6.5), Roman Josi 48 (6.0), Ryan Ellis 45 (5.625). Erik Haula has only had with SOG on 17 attempts in eight games (2.125) while team leader Matt Duchene is at 36 (4.5) and Ryan Johansen is at 27 (3.38).
San Jose
San Jose has averaged 2.5 goals/game in eight games this year while averaging 31.125 shots/game with 55.375 SAT/game. The team shooting percentage is a little low at 8.03 so the goals should increase if the Sharks can maintain their opportunities.
Brent Burns remains an offensive catalyst as he leads the team with 55 SAT in eight games (6.875) followed by Timo Meier at 43 (5.375) and Logan Couture at 39 (4.875). Patrick Marleau is a shell of his former self with only four SOG and eight SAT in eight games played. Erik Karlsson is 7th on the team with 34 SATs (4.25) but only 12 shots have hit the net as 15 of his SATs have been blocked (44.12 percent). Tomas Hertl was a little surprising at only 26 SAT (3.25) and only 14 SOG in eight games.
St. Louis
The Blues have started this season out well offensively with 3.44 goals/game while only averaging 27.55 SOG/game with a 46 SAT/game which is much lower than the league average of 54/game. An example is the Blues 4-1 win over Anaheim on Sunday night. They managed four goals on 23 SOG on only 29 SAT, which is not usually a recipe for success. The Blues have only missed the net 16.18 percent of the time this year compared to the league average of 20.68 percent. The team shooting percentage is 12.5 which will come down eventually to around 10.
The offence is spread out with David Perron leading the team with 41 SAT in nine games (4.56/game) followed by Justin Faulk at 39 (4.33) and Jordan Kyrou with 38 (4.22). Faulk and Kyrou were not even fantasy relevant last season so it shows us how much things can change in a hurry. Vince Dunn has struggled with only 10 SOG on 29 SAT in the eight games he has dressed with 14 of those SAT being blocked (48.3 percent). Robert Thomas is a surprise to me with only four SOG on 11 SAT in nine games. I knew he was a passer but that is problematic.
Vancouver
The Canucks have taken off over their last four games and now are averaging 3.54 goals/game on 30.73 SOG/game with 56.73 SAT/game. Their team shooting percentage is a touch high at 11.54 and should come down closer to 10 much like St. Louis.
Quinn Hughes leads the Canucks with 54 SAT (4.91 SAT/game) followed by Elias Pettersson with 53 (4.82), Brock Boeser 48 (4.36) and Bo Horvat and Nate Schmidt at 45( 4.09). J.T. Miller has reverted a little to his Tampa Bay days and has only 12 SOG in eight games on 25 SAT (3.125). Antoine Roussel has only generated four SOG and eight SAT in 11 games.
What interested me initially in this topic was a post by Cam Robinson (@hockey_robinson) and who was leading the league in posts and crossbars since Elias Pettersson entered the league. The answer on Saturday night was Pettersson, McDavid and Patrik Laine with 26 (Pettersson has five this year alone). Update on Sunday has McDavid ahead of the pack with 27 now!
Vegas
The Golden Knights have started this season strong with 3.29 goals/game on 31.86 SOG/game with 64.42 SAT/game which is well above the league average of 54.07 SAT/game. The team shooting percentage is slightly above average at 10.31. Vegas has a lot of shots blocked as they are at 27.27 percent while the league average is 24.1 and are slightly high in missed shots as well with 23.28 percent compared to 20.68 percent being the average. The strategy appears to be just pepper the net and the goals will come.
My worries about Shea Theodore appear to be unfounded as he is leading the team with 56 SAT in seven games (8 SAT/game) which is up with the league leaders. Max Pacioretty is not far behind with 51 (7.29) which is not a surprise as he has always been amongst the league leaders in SOG. Mark Stone has only 25 SAT (3.57) but it is hard to argue with 11 points in seven games.
Winnipeg
Aside from being beaten 4-1 by Vancouver on Saturday night, the Jet’s offence has been deadly. They are averaging 3.625 goals/game on 31.5 SOG/game with 54.25 SAT/game. The team’s shooting percentage is 11.51 so should come down a little.
I'm not sure I would have had Andrew Copp at the top of this list but he is after eight games with 45 SAT (5.625) followed by Kyle Connor at 41 (5.125) and Nikolaj Ehlers at 40 (5). I must admit I didn't see this from Copp but perhaps this is why the team played hardball with Jack Roslovic and dealt him with Laine.
It's no secret to any team's success that their best players should be given the opportunities to produce the best results. It makes no sense for a team to have a player that is a career 10-goal scorer taking more shot attempts than a career 40-goal scorer, but if the puck goes in it doesn't matter who is shooting it. One thing to look for is a high percentage of SOG compared to SAT (75 percent and higher) as it either tells you that the player is hitting the breadbasket a lot or being far too selective before shooting. The best forwards in the league are between 52.46 and 72.49 (that is where MacKinnon and McDavid are at) while the best defensemen are between 40.4 and 65.3 (Cale Makar and Rasmus Dahlin). These are with a high volume of attempts as well.
Thanks for reading and if you have any comments or suggestions, please let me know below and/or follow me on Twitter @gampbler15.
Related Posts
UPCOMING GAMES
Starting Goalies
Top Skater Views
| Players | Team | |
|---|---|---|
| AUSTON MATTHEWS |
| |
| ALEC MARTINEZ |
| |
| JACK EICHEL |
| |
| ELIAS PETTERSSON |
| |
| ZACH HYMAN |
| |
Top Goalie Profile Views
LINE COMBOS
| Frequency |
| |
|---|---|---|
| 23.1 | BRADY TKACHUK SHANE PINTO DRAKE BATHERSON | |
| 20.4 | MATHIEU JOSEPH RIDLY GREIG CLAUDE GIROUX | |
| 16.7 | JIRI SMEJKAL ZACK MACEWEN DOMINIK KUBALIK | |
DobberHockey Podcasts

Fantasy Hockey Life: Salary Cap Basics Remix
If you missed last year’s series on salary leagues, this is a remix with some bonus material. Jesse and Victor discuss the different ways you can step up your dynasty league with a salary component. Our show is part of the Dobber Podcast Network and sponsored by Fantrax.com. Email [email protected] and ask to join our […]

Keeping Karlsson: No. 533 – Ultimate Champion Interview + Playoff Preview
On this week’s Keeping Karlsson Fantasy Hockey Podcast mega-show, Elan and Brian gather and analyze the latest fantasy hockey news, notes and data.
Fantasy Hockey Life: Tim-Eh’s Time in the TIDY Top Tier
When one of the managers in the TIDY league top tier left midseason, Patron Tim volunteered to give up his excellent team to take over a mid-season orphan fighting to escape relegation. And Tim did not go quietly. Ryan, Jesse and Victor welcome Tim to talk through his experience and the trades he made in […]
Keeping Karlsson: Better Off Nedeljkovic
On this week’s Keeping Karlsson Fantasy Hockey Podcast mega-show, Elan and Brian gather and analyze the latest fantasy hockey news, notes and data from the past season to work on projecting the 2023-24 NHL and fantasy hockey season. — Join the Keeping Karlsson patron community! Patrons get guaranteed KKUPL invitations, plus monthly bonus AMA episodes, and full access to […]
Fantasy Hockey Life: FHL Player Cards with Brandon
Our guy Brandon has been doing great work behind the scenes to great Fantasy Hockey Life prospect player cards, visualizations with the metrics we care about most – including BASH. These are a great tool to catch at a glance the stats for upcoming players. Jesse interviews Brandon and Victor on the decisions behind what […]