The march toward arbitration continues and there are players that may end up there, though most of these cases are often resolved beforehand. One interesting case is that of Toronto goalie lya Samsonov. Even with Jake Muzzin on LTIR, the team is in excess of $3M over the cap without Samsonov signed. Each dollar matters, and that's why the player and team being this far apart is important:
A lot of these end up just splitting the difference, but even a $3.5M AAV brings them past $6.5M over the cap. Just trading Matt Murray isn't enough. Trading Murray and going back in a time machine and not signing David Kampf would be enough, in case the team's analytics department has a time machine kicking around.
*
We also got arbitration news on Gabriel Vilardi:
There are very few more interesting players in fantasy this season. If his breakout continues, he could have a big year playing with some very good offensive players. If it doesn't…
*
An extension for Brett Howden:
I will have a bit more on Howden in an upcoming Ramblings but for cap leaguers, this is still just fine in multi-cat formats. He really seemed to create good chemistry in Vegas's top-6 mix.
*
This week, we've continued our look at peripheral stats in fantasy hockey, focusing on how they've changed in parallel to the game itself over the years. Last week's Ramblings covered how stats like blocked shots, hits, and penalty minutes have fluctuated in recent seasons, how many players reach different peripheral thresholds, and some players to target for various reasons. Go visit our Ramblings section to peruse the list.
The last couple Ramblings averted their gaze to the power play. The first looking at production and shot rates on the power play from defencemen, the distribution of points among the league's PP defencemen, and what it all means for fantasy. The second spent time on particular targets to consider outside of the top tier of producers.
Today, we'll move on to the forwards. If there are changes on the blue line, there are changes up front, and it's important to go through them. As usual, data will be from our Frozen Tools or Natural Stat Trick, unless otherwise indicated.
Edmonton
Power play scoring rose across the league with 149 more PP goals in 2022-23 than in 2021-22. That represents a 9.5% jump in power play goals in one year, and 17% since 2018-19. There are varied reasons for that – power-play opportunities and conversion percentage both went up – but the Edmonton Oilers need to be mentioned.
This past season saw the Oilers score 88 power-play goals, or 19 more goals than the next-closest team. There was an equal gap between their goal total and that of second-place Ottawa to that between Ottawa and 16th-place Calgary. Edmonton's 88 goals are the most on the power play for any team since 2009 (Detroit, 89) and there hasn't been another team to reach just 75 PP goals since the 2009-10 Capitals. In other words, Edmonton's power play was a monster outlier, even in a higher-scoring environment.
With such an outlier power play, we have to look at how that affected our stats. Consider what power play scoring looks like if we remove the highest-scoring team from each of the last two seasons (Edmonton in 2022-23, Colorado in 2021-22):
| Season | Goals/60 With Highest-Scoring PP Team | Goals/60 Without Highest-Scoring PP Team |
| 2021-22 | 7.43 | 7.38 |
| 2022-23 | 7.66 | 7.48 |
This shows us that goals/60 went up by 0.23 from 2021-22 to 2022-23, but if we remove the most prodigious PP team from each season, that falls to 0.1. It is why I want to be careful to overstate the jump in PP scoring we saw. If you were a fantasy owner that didn't have a piece of the 22-23 Edmonton power play, the rest of the players performed similarly to the year before. It wasn't exact, but close enough to not make sweeping judgments about modern special teams exploding in the NHL.
Point Distribution
Reviewing the Edmonton power play also matters for point distribution. It's easy to look at this past season having four instances of a player reaching 50 PPPs – the only four players to do so in a season since the 2012 lockout – and assume higher elite PP production rates. The fact is that three of those four players were all in Edmonton, while the fourth was Nikita Kucherov. Kuch, for his part, had 48 PPPs in 2018-19 so this isn't entirely new territory for him.
Setting aside the four players that reached the 50-point mark, Jason Robertson was the only other player to pass 40 PPPs in 2022-23. Robertson and Kucherov show us that there was more scoring elsewhere in the league but, again, a lot of the elite totals were thanks to Edmonton.
But, yes, there were more players with high-end totals than any point in recent memory. Because three of the last five seasons had COVID interruptions, the following benchmarks will be a per-game rate and limited to forwards that played at least 75% of the season's games. This is how the distribution fell for different PP production levels among forwards only over the last five seasons:
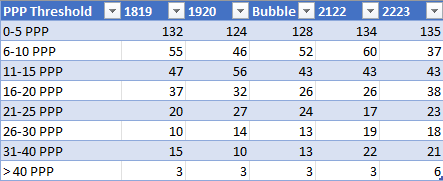
Here we can see where the high-end producers are becoming more readily available. The number of forwards to average the equivalent of 31-or-more PPPs last season was 27, more than double the same threshold from 2019-20 (13). The curious part is that despite a rise of 9.5% in power-play goals from 21-22 to 22-23, there are virtually the same number of players averaging north of 25 PPPs per game in both seasons (44 and 45, respectively). The number of super-elite forwards in the PPP department has exploded, relatively speaking, but the number in the next tier down is consistent. Here, again, we have the Edmonton power play to thank.
That is what is going to make fantasy drafts this coming September a little tricky to navigate. If power-play scoring holds over from last year, with similar distribution, there's an extra premium on those Edmonton forwards. Not that Connor McDavid and Leon Draisaitl need other reasons to be selected at the tippy-top of drafts, but it also greatly alters the value of both Ryan Nugent-Hopkins and Evan Bouchard, even if he's a defenceman. But for the next tier of players – Mitch Marner, Nathan MacKinnon, David Pastrnak, and so on – their PP value hasn't really changed a lot. The hope is that maybe a great season from MacKinnon or Kucherov can be similar to Draisaitl, but it's a hope rather than anything approaching likelihood. On the flipside, what if Edmonton's power play reverts closer to what it was in 2021-22 than in 2022-23?
Ice Time Distribution
Looking at the threshold table, something else comes to light: way fewer players contribute meaningful PPPs. It was discussed in a Ramblings earlier this week about how the middle class of PP producers was shrinking, and that is crystallized in that table: there were 80 forwards to produce a PPP/GP rate that worked out to 6-15 PPPS last season, a number that pales to the year before (103), and is the lowest in our five-year sample (next-closest was 95 in the Bubble season).
One reason why the middle-class of PP producers is declining is the distribution of ice time. In the 2022-23 season, there were 26 forwards that skated at least 70% of their team's available PPTOI. That number of forwards in 2021-22 was 19, and just 15 back in 2018-19. For just 60% of the available PPTOI, by the seasons we just listed, the numbers are 71, 65, and 57. In other words, there is a much larger number of players getting 60%, even 70%, of their team's PPTOI, and it leaves less for everyone else. Additional power-play opportunities haven't been enough to make up the difference from that ice-time change.
Let's sum it all up:
- Power play scoring went up, but much of the impact can be attributed to the hyper-elite Edmonton power play. If they can maintain that level, it skews their value a lot. If they can't, forwards like RNH and Zach Hyman will be overvalued at the draft table.
- Setting aside the Edmonton power play forwards, there were still more high-end PPP seasons in 2022-23 than in recent memory. Increased power play opportunities helped this along, but even without McDavid and Draisaitl, it's easier to find guys that will give you 19 or 26 PPPs. All hope is not lost if you don't have first overall pick in September.
- The change in ice-time distribution is suppressing the lower-end producers. They still exist, and there are a lot to pick from, but it's getting harder to find that winger who'll throw in 11 PPPs alongside stellar peripherals.
The changes to the man advantage have a lot of implications as far as draft value and subsequent waiver value are concerned. These differences apply both to defencemen and forwards, and that changes fantasy hockey entirely. It really is a fascinating time to be involved in this game.
After Bubble Keeper Week – that's all next week here at Dobber – we'll look at forward power-play targets.
Related Posts
UPCOMING GAMES
Starting Goalies
Top Skater Views
| Players | Team | |
|---|---|---|
| HENRY THRUN |
| |
| ISAAC HOWARD |
| |
| JACKSON LACOMBE |
| |
| MATHEW DUMBA |
| |
| ZACH BENSON |
| |
Top Goalie Profile Views
LINE COMBOS
| Frequency |
| |
|---|---|---|
| 21.9 | AUSTIN WATSON CRAIG SMITH TYLER MOTTE | |
| 21.3 | MARCO KASPER PATRICK KANE ALEX DEBRINCAT | |
| 17.2 | VLADIMIR TARASENKO MICHAEL RASMUSSEN J.T. COMPHER | |
DobberHockey Podcasts

Fantasy Hockey Life: Draftastic 3 – Q&A on the NHL Draft
Jesse asks Victor the questions you wanted answers to from the NHL Draft!

Keeping Karlsson: UFA Szzzn
Elan and Brian work their hardest to make the most of the NHL’s 2025 UFA signings and player movement, searching for the guys who may be the most likely to exceed expectations in new homes and situations.
Fantasy Hockey Life: Draftastic 2 – Q&A on the NHL Draft
Victor and Jesse are back in studio as Victor reports on his time at the NHL Draft and his outlook on fantasy rookie drafts. We discuss Michael Misa, Matthew Schaefer, Cole McKinney, Mason West, Milton Gastrin and Jacob Ihs-Wozniak with player audio. Victor also answers patron questions on which players you’ll want to target for […]
Fantasy Hockey Life: Draftastic 1 – NHL Draft Talk with Prospect Writers
Victor reports from the NHL Draft in Los Angeles.
Keeping Karlsson: Dobson is Free
On this edition of the Keeping Karlsson Fantasy Hockey Podcast, Elan and Brian ride the highway of National Hockey League offseason news, draft notes and transactions before the Free Agent Frenzy begins. All night long.