Analytics Advantage: Comparing Expected Goal Scoring with High-, Medium-, and Low-Danger Scoring
Stas Pupkov
2023-11-09
In the realm of fantasy hockey, where every point can be the difference between triumph and mediocrity, a deeper dive into advanced statistics becomes not just a strategy, but a necessity. This season, we’re peeling back the layers of conventional stats to reveal a hidden cove of insights through advanced metrics such as xGF%, HDGF%, MDGF%, and LDGF%. These figures don’t just tell us what has happened, but also give us a glimpse into the potential unfolding on the ice.
In these early stages, where the data is as dynamic as a puck on fresh ice, the opportunity to capitalize on emerging trends is immense. This analysis is less about jumping to conclusions and more about equipping fantasy managers with the foresight to make pivotal decisions. We are looking beyond the scoreboard and into the very fabric of player performance, identifying those who offer more than just points—they offer a winning edge. This report aims to spotlight the players who are quietly stacking the deck in their favor. From the relentless forechecker to the unyielding blueliner, today we are focusing on those whose contributions in the high-danger zones, the quality of shots, and the ability to sustain offensive pressure are just as crucial as the number of goals they score. In the nuanced world of fantasy hockey, these are the players who could be the difference-makers for your team.
As we delve into the analytics of hockey, it becomes clear that the traditional metrics of goals, assists, and wins, while still relevant, are mere surface scratches in a complex statistical landscape. In fantasy hockey, advanced metrics such as Expected Goals For percentage (xGF%), High-Danger Goals For percentage (HDGF%), Medium-Danger Goals For percentage (MDGF%), and Low-Danger Goals For percentage (LDGF%) offer a more nuanced understanding of a player’s impact on the game.
xGF%
The Expected Goals For (xGF%) metric is a predictor of offensive output that accounts for both the quantity and quality of shots. It is an invaluable tool for forecasting future performance, helping managers identify players who are consistently creating scoring opportunities, even if those chances haven’t yet translated into actual goals.
HDGF%
High-Danger Goals For percentage (HDGF%) focuses on scoring that occurs from areas on the ice where shots are most likely to result in goals. Players with high HDGF% are often those who thrive under pressure and can convert critical chances into points for their team — and for fantasy managers.
The interplay between a player’s expected goals for percentage (xGF%) and their high-danger goals for percentage (HDGF%) is a rich source of insight for fantasy hockey managers. These metrics, when plotted against each other, offer a visual representation of a player’s offensive prowess and their ability to capitalize on high-quality scoring chances. Let's explore what this means for fantasy hockey through a detailed graph analysis.
The graph below plots xGF% on the x-axis against HDGF% on the y-axis, providing a clear picture of how often players are involved in high-quality scoring plays versus how often those plays result in goals. Players situated in the top right quadrant excel in both metrics, indicating that they not only create a high volume of scoring chances but also convert these chances at a high rate. These are the clutch performers who can be counted on to score goals and rack up fantasy points.
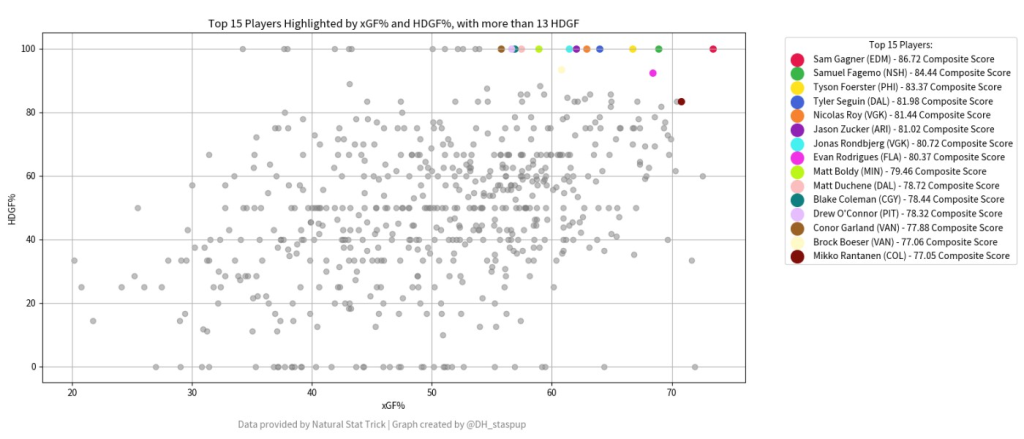
This graph serves as a strategic tool for fantasy managers, enabling them to identify players who are likely to see a positive regression in scoring, as well as those who may be currently overperforming.
MDGF% and LDGF% –
Medium and Low-Danger Goals For percentages (MDGF% and LDGF%) may not capture the limelight like their high-danger counterpart, but they’re indicative of players who consistently contribute regardless of the situation. Whether it’s a point blast from the blue line or a well-placed wrist shot from the perimeter, players who excel in these metrics provide a steady stream of fantasy points.
The graph plotting xGF% against MDGF% unlocks another dimension for fantasy hockey managers, pinpointing players who consistently contribute in medium-danger situations.
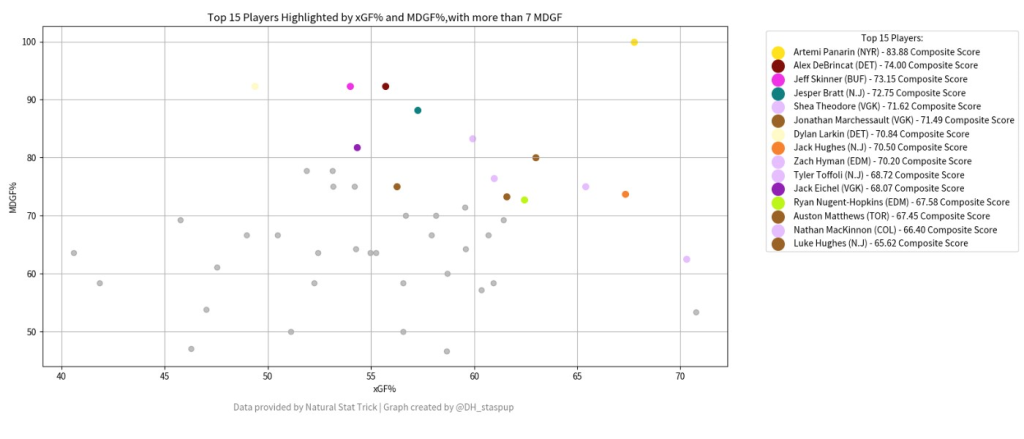
Here, xGF% along the x-axis aligns with MDGF% on the y-axis, illustrating the balance between creating medium-danger scoring chances and actual goals scored from those areas. Those positioned higher and to the right are players who not only initiate but also successfully execute medium-danger plays, providing a reliable source of fantasy points. This graph is a tactical asset, guiding managers to discern players whose medium-danger goal scoring is due to rise and those whose hot streaks may cool down.
The relationship between xGF% and LDGF% presents fantasy hockey managers with insights into players who excel in generating and converting low-danger chances.
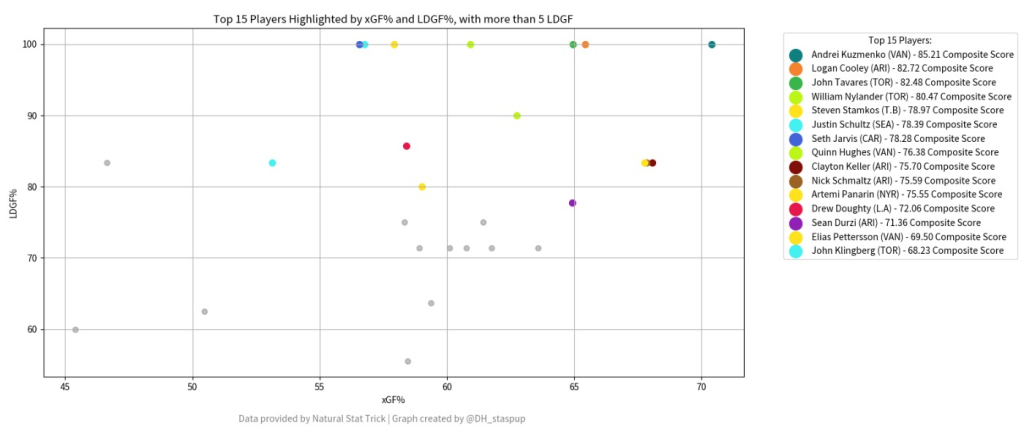
On this graph, xGF% on the x-axis correlates with LDGF% on the y-axis. This illustrates players’ effectiveness in creating and capitalizing on low-danger opportunities. Players in the upper-right are proficient at translating low-danger shots into goals, which can be a hidden gem for fantasy point accumulation.
This visualization aids managers in spotting players poised for a rise in low-danger goal production and highlights those who might not sustain their current pace.
These metrics, when combined, offer a holistic view of a player’s effectiveness and potential for contribution. They capture the essence of a player’s game beyond the flash of high-scoring nights — they measure the sustained pressure and quality of play that can be the backbone of a fantasy hockey team.
The strategic application of advanced metrics such as xGF%, HDGF%, MDGF%, and LDGF% offers a significant advantage in the analysis of player performance within the NHL. This season’s data reinforces the importance of looking beyond traditional statistics to gain a clearer picture of a player’s contribution to their team’s success. The detailed graphs presented here are not mere representations; they are analytical tools that provide fantasy hockey managers with actionable insights, enabling informed decision-making for roster selection and management.
As we delve deeper into the NHL season, it becomes increasingly clear that the key to a robust fantasy hockey strategy lies within these nuanced metrics. They allow us to identify not only the current standout performers but also those with the potential for improved performance as the season unfolds.
Ultimately, these advanced statistics are more than just numbers on a spreadsheet; they reflect the complex dynamics of hockey and an indispensable resource for any serious fantasy hockey manager. Staying attuned to these metrics could be the deciding factor in building a successful and competitive team.
Data courtesy of Natural Stat Trick | Graphs crafted by @DH_staspup
One Comment
Leave A Comment
You must be logged in to post a comment.
Related Posts
UPCOMING GAMES
| Apr 28 - 14:04 |
| vs |
| |
| Apr 28 - 17:04 |
| vs |
| |
| Apr 28 - 20:04 |
| vs |
| |
| Apr 28 - 22:04 |
| vs |
| |
Starting Goalies
Top Skater Views
| Players | Team | |
|---|---|---|
| AUSTON MATTHEWS |
| |
| SETH JARVIS |
| |
| MATTHEW TKACHUK |
| |
| ZACH HYMAN |
| |
| WYATT JOHNSTON |
| |
Top Goalie Profile Views
LINE COMBOS
| Frequency |
| |
|---|---|---|
| 12.9 | OWEN TIPPETT SCOTT LAUGHTON TRAVIS KONECNY | |
| 11.8 | TYSON FOERSTER JOEL FARABEE SEAN COUTURIER | |
| 11.8 | RYAN POEHLING GARNET HATHAWAY NOAH CATES | |
DobberHockey Podcasts

Fantasy Hockey Life: Salary Cap Basics Remix
If you missed last year’s series on salary leagues, this is a remix with some bonus material. Jesse and Victor discuss the different ways you can step up your dynasty league with a salary component. Our show is part of the Dobber Podcast Network and sponsored by Fantrax.com. Email [email protected] and ask to join our […]

Keeping Karlsson: No. 533 – Ultimate Champion Interview + Playoff Preview
On this week’s Keeping Karlsson Fantasy Hockey Podcast mega-show, Elan and Brian gather and analyze the latest fantasy hockey news, notes and data.
Fantasy Hockey Life: Tim-Eh’s Time in the TIDY Top Tier
When one of the managers in the TIDY league top tier left midseason, Patron Tim volunteered to give up his excellent team to take over a mid-season orphan fighting to escape relegation. And Tim did not go quietly. Ryan, Jesse and Victor welcome Tim to talk through his experience and the trades he made in […]
Keeping Karlsson: Better Off Nedeljkovic
On this week’s Keeping Karlsson Fantasy Hockey Podcast mega-show, Elan and Brian gather and analyze the latest fantasy hockey news, notes and data from the past season to work on projecting the 2023-24 NHL and fantasy hockey season. — Join the Keeping Karlsson patron community! Patrons get guaranteed KKUPL invitations, plus monthly bonus AMA episodes, and full access to […]
Fantasy Hockey Life: FHL Player Cards with Brandon
Our guy Brandon has been doing great work behind the scenes to great Fantasy Hockey Life prospect player cards, visualizations with the metrics we care about most – including BASH. These are a great tool to catch at a glance the stats for upcoming players. Jesse interviews Brandon and Victor on the decisions behind what […]
% is great but in this case, the chance/60 are also very important and the raw numbers too. You could assign the size of the data points to chance/60 to reflect that. Also the colors for the 1st and 3rd plots are great, but for the 2nd they’re too many pink points.
Cheers