Analytics Advantage: Shifts in Player Performance Using PDO and Expected Goals
Stas Pupkov
2024-04-04
In the evolving world of fantasy hockey, understanding the nuances behind player performance is key to gaining a competitive edge. Reflecting on our previous analyses, we’ve explored the complex roles of forwards and defensemen, emphasizing the metrics that capture their on-ice contributions. As the game changes, so too does the data landscape, prompting a fresh examination of these players through the latest statistics. This follow-up analysis aims to update our insights, identifying shifts in player performance and emerging trends that can inform fantasy hockey strategies. Join us as we revisit the metrics that shape our understanding of the NHL’s dynamic, shedding light on the players who are redefining excellence on the ice.
Refresher on Metrics Used
In our quest to dissect player performance with precision, we rely on a select group of advanced metrics that offer deeper insights beyond traditional statistics. Here’s a brief overview of these pivotal metrics for forwards and defensemen, setting the stage for our updated analysis:
For Forwards:
PDO (Shooting Percentage + Save Percentage): A measure often associated with luck, providing insight into the sustainability of a player’s performance.
Individual Points Percentage (IPP): Highlights a player’s direct contribution to team scoring by capturing their involvement in goals.
Total Points: The straightforward tally of a player’s goals and assists, a fundamental metric in fantasy hockey scoring.
Expected Goals For Percentage (xGF%): An advanced stat that predicts a team’s goal-scoring likelihood with a player on the ice, offering a glimpse into their offensive impact.
For Defensemen:
Blocked Shots: Quantifies a defenseman’s willingness to sacrifice for the team, a simple yet telling sign of defensive engagement.
Takeaways: Measures the ability to regain puck possession, reflecting a player’s defensive acumen and agility.
Expected Goals Against (xGA%): Provides an estimate of the quality of shots against while a player is on the ice, a nuanced view of defensive effectiveness.
Time On Ice (TOI): Reflects the coaching staff’s trust in a player, correlating with their role in crucial situations and overall impact.
These metrics form the backbone of our analysis, offering a comprehensive view of a player’s contribution to their team’s fortunes. As we delve into the latest data, keep these metrics in mind—they are the keys to unlocking the secrets of player performance in the fast-paced world of NHL hockey.
Forward Analysis
Overall Trends:
The landscape for forwards is marked by an increasing emphasis on speed and versatility, with teams valuing players who can transition quickly and contribute across various facets of the game. This shift is mirrored in the metrics, where players demonstrating a balanced blend of high IPP and xGF% are increasingly becoming pivotal to their teams’ success. Moreover, the fluctuation in PDO across the board highlights the unpredictable nature of luck in the game, reminding us that performance analysis must account for both skill and serendipity.
Interpreting the Forward Graphs:
As we progress through the graphs, keep these metrics in mind, focusing on how players’ performances align or deviate from these indicators of success.
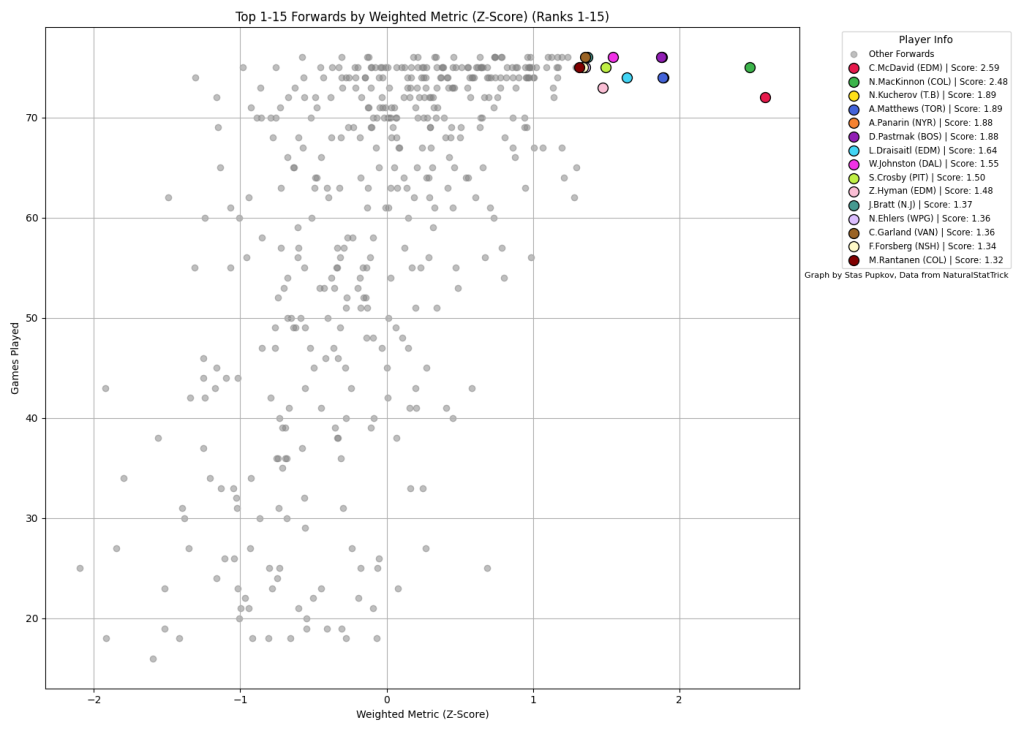
Graph 1: The Elite Protectors – Top 15 Forwards
This graph showcases the crème de la crème of NHL forwards, those whose metrics not only soar above the average but also demonstrate a consistent ability to drive their team's offensive engine. Key aspects to note are their balanced performance across all metrics, especially their high IPP and xGF%, which indicate both direct scoring contributions and their role in generating quality scoring chances. The elite status of these players is affirmed by their ability to influence the game’s outcome, making them invaluable in fantasy leagues.
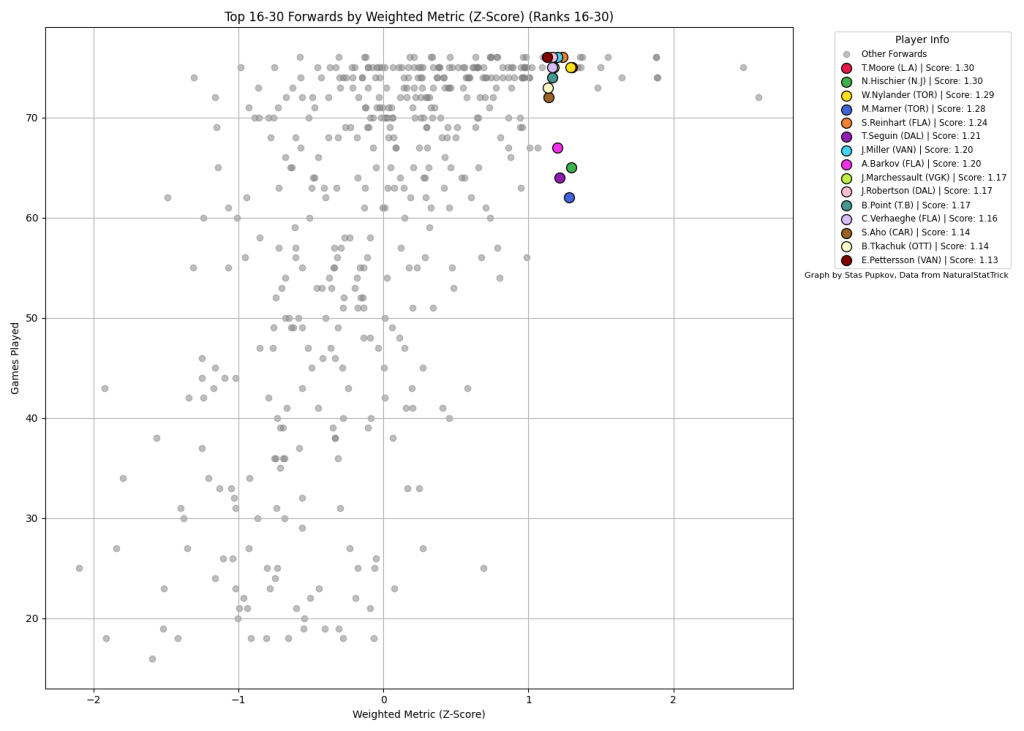
Graph 2: The Ascent of the Steadfast – Forwards Ranked 16-30
Our second graph focuses on the middle tier of forwards, the steadfast contributors on the brink of elite status. These players, often showing a significant improvement in specific metrics like IPP or xGF%, represent the potential for breakout seasons. For fantasy managers, this group is particularly intriguing, offering a mix of reliability and the promise of untapped potential. Identifying players in this tier who exhibit an upward trajectory in their performance metrics can offer strategic advantages in fantasy trades.
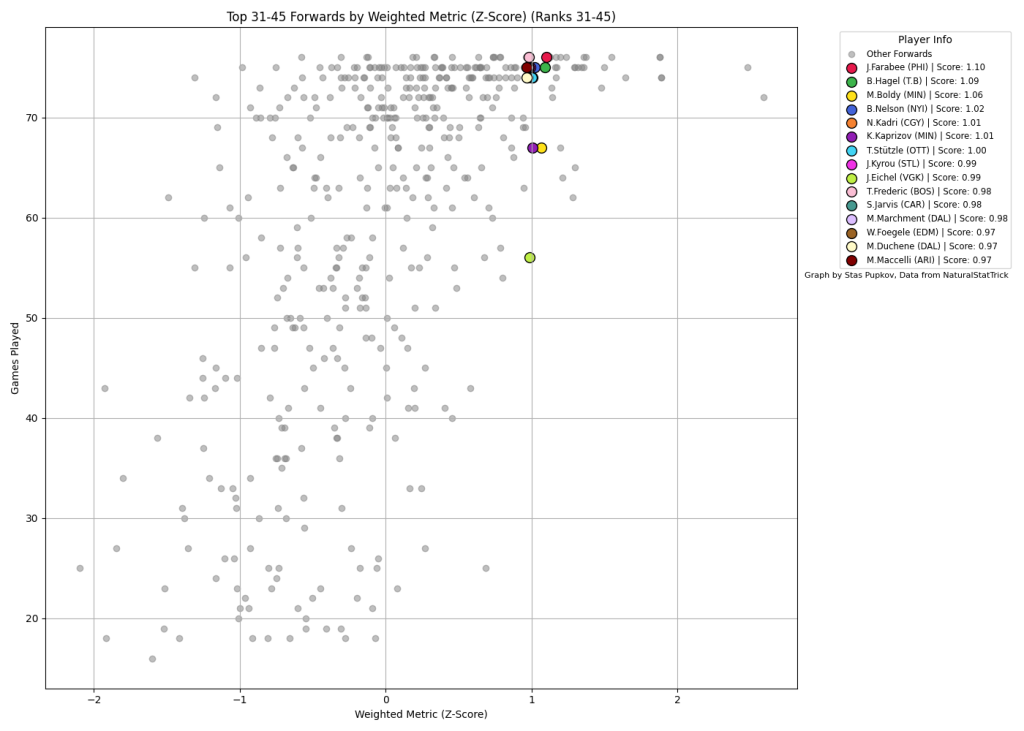
Graph 3: The Underrated Workhorses – Forwards Ranked 31-45
The final graph rounds out our analysis with forwards ranked 31 to 45, the workhorses of their teams. While they may not garner as much spotlight as their elite counterparts, their contributions are no less critical. Look for players in this tier with high PDO scores, indicating a blend of skill and favorable circumstances, or those with an xGF% suggesting they are often part of high-quality scoring plays.
Defensemen Analysis:
Overall Trends:
Recent data indicate a growing appreciation for defensemen who not only excel in traditional defensive duties but also contribute offensively. The blurring lines between defensive and offensive roles are evident in the evolving metrics, with an increased focus on aspects like xGA% and TOI. These trends highlight the NHL’s shift towards more versatile, mobile defensemen capable of influencing the game on both ends of the ice.
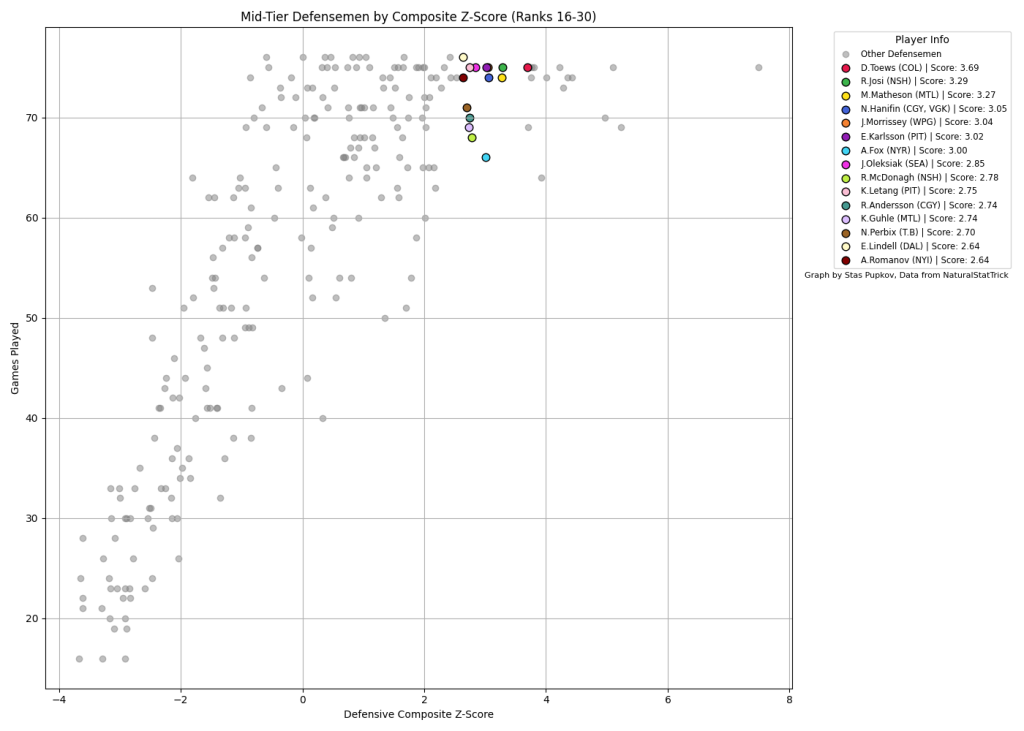
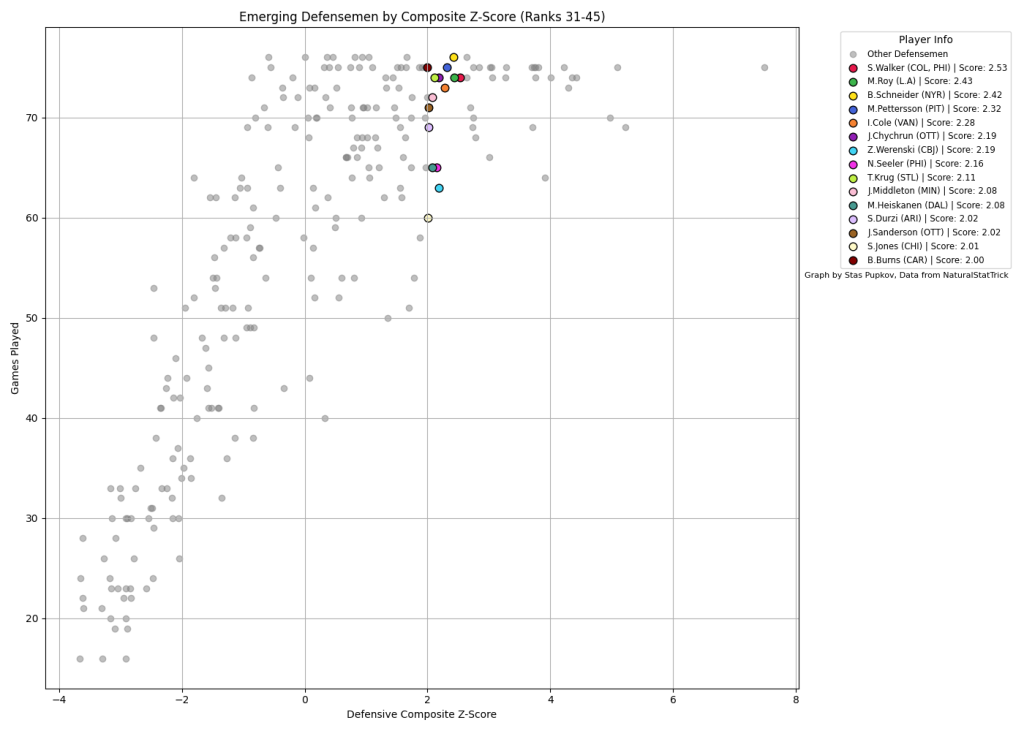
Interpreting the Defensemen Graphs:
As we progress through the graphs, consider the balance between offensive contributions (reflected in metrics like blocked shots and takeaways) and defensive stability (xGA% and TOI). The most valuable defensemen in fantasy leagues are often those who excel in both arenas, offering a blend of reliability and scoring potential.
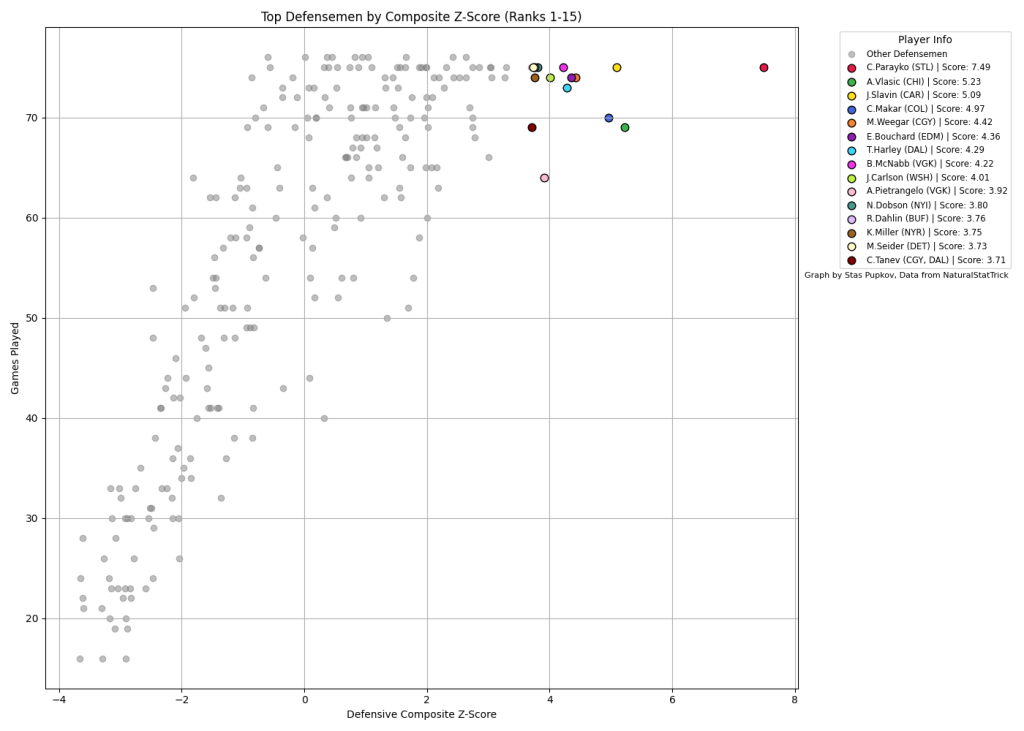
Graph 4: The Elite Protectors – Top 15 Defensemen
This first graph spotlights the elite defensemen whose performances set them apart. What is notable are their high TOI, indicating trust from coaching staff and involvement in critical game moments, and their balanced contribution to both defense and offense. These players are the backbone of their teams, and their consistency and versatility make them top picks in fantasy leagues.
Graph 5: The Ascent of the Steadfast – Defensemen Ranked 16-30
The second graph focuses on mid-tier defensemen, those on the verge of breaking into the top tier. Here, we see players with significant improvements in defensive metrics like xGA% and an increasing presence in offensive plays. Identifying these rising stars can be crucial for fantasy managers looking for players with growth potential and the ability to contribute valuable points.
Graph 6: The Underrated Workhorses – Defensemen Ranked 31-45
Our final graph rounds out the analysis with a look at the workhorses of defense. These players, while not always in the spotlight, provide steady, reliable performances that can anchor a fantasy team’s defense. Pay special attention to players with high blocked shots and takeaways, as they often contribute critical defensive plays that, while not always reflected in traditional fantasy scoring, are invaluable to team success.
Through this detailed examination of defensemen, we uncover the layers of strategy behind player selection and roster construction in fantasy hockey. The updated metrics and trends revealed in these graphs offer a roadmap for identifying defensemen who can provide a competitive edge, underscoring the importance of versatility, reliability, and the often-overlooked contributions that solidify a team’s defense.
Conclusion
Diving into the latest NHL data, we’ve pinpointed key performers among forwards and defensemen, revealing trends that can sharpen your fantasy hockey strategy. Embrace these insights for a competitive edge, scouting for both standout names and hidden gems. Stay adaptive, stay informed, and may your fantasy team thrive.
Thank you for reading and have a great rest of your day!
Twitter/X – @DH_staspup for any questions, corrections, or comments
If you want to see how your team looks on the graph, DM me a list/photo of your roster
Player Data sourced from NaturalStatTrick
Related Posts

UPCOMING GAMES
| Apr 30 - 19:04 |
| vs |
| |
| Apr 30 - 19:04 |
| vs |
| |
| Apr 30 - 21:04 |
| vs |
| |
| Apr 30 - 22:04 |
| vs |
| |
Starting Goalies
Top Skater Views
Top Goalie Profile Views
LINE COMBOS
| Frequency |
| |
|---|---|---|
| 26.5 | TIMO MEIER NICO HISCHIER JESPER BRATT | |
| 20.4 | DAWSON MERCER ALEXANDER HOLTZ ERIK HAULA | |
| 10.2 | ONDREJ PALAT TOMAS NOSEK NOLAN FOOTE | |
DobberHockey Podcasts

Keeping Karlsson: April Patroncast Gone Partially Public!
Hi, all! We’re feeling a little guilty about not having a show out for you since the playoffs began, so we’re sharing the first 40 minutes or so of our patrons-only exclusive bonus episode for the month of April. This is our 109th Patroncast, which is a monthly “ask us anything” episode based on patron […]

Fantasy Hockey Life: Salary Cap Remix Part 2
This is part two of a remix of Jesse and Victor’s talk about salary cap strategy. How do you balance talent and cost in these leagues? Have a listen. Our show is part of the Dobber Podcast Network and sponsored by Fantrax.com. Email [email protected] and ask to join our free discord. Join our Patreon at […]
Fantasy Hockey Life: Salary Cap Basics Remix
If you missed last year’s series on salary leagues, this is a remix with some bonus material. Jesse and Victor discuss the different ways you can step up your dynasty league with a salary component. Our show is part of the Dobber Podcast Network and sponsored by Fantrax.com. Email [email protected] and ask to join our […]
Keeping Karlsson: No. 533 – Ultimate Champion Interview + Playoff Preview
On this week’s Keeping Karlsson Fantasy Hockey Podcast mega-show, Elan and Brian gather and analyze the latest fantasy hockey news, notes and data.
Fantasy Hockey Life: Tim-Eh’s Time in the TIDY Top Tier
When one of the managers in the TIDY league top tier left midseason, Patron Tim volunteered to give up his excellent team to take over a mid-season orphan fighting to escape relegation. And Tim did not go quietly. Ryan, Jesse and Victor welcome Tim to talk through his experience and the trades he made in […]