Analytics Advantage: Save Percentage, Goals Against, and Valuing Goaltenders
Stas Pupkov
2023-11-23
In fantasy hockey, the performance of goalies is crucial yet complex to predict. As the NHL season progresses, understanding the intricacies of goalie performance becomes increasingly important for fantasy hockey managers. Goalies, distinct from other players in their impact and evaluation, can significantly influence the outcome of fantasy leagues. This season, the variability in goalie performance has been particularly pronounced. Factors such as team defensive strength, individual workload, and adapting strategies in the league have made the analysis of goalies more challenging yet crucial. This article seeks to provide a comprehensive analysis of goalie performance, utilizing advanced metrics and current trends to offer insights that go beyond traditional statistics like wins and save percentage. Our focus will be on identifying key indicators of goalie performance, understanding how changes in the NHL are impacting them, and providing actionable insights for fantasy hockey managers. By examining a range of data points, we aim to equip fantasy managers with the knowledge needed to make informed decisions about their goalie roster. In fantasy hockey, goalies can be a deciding factor in a team’s success. As such, a deeper understanding of their performance is essential for those looking to gain a competitive edge in their fantasy leagues.
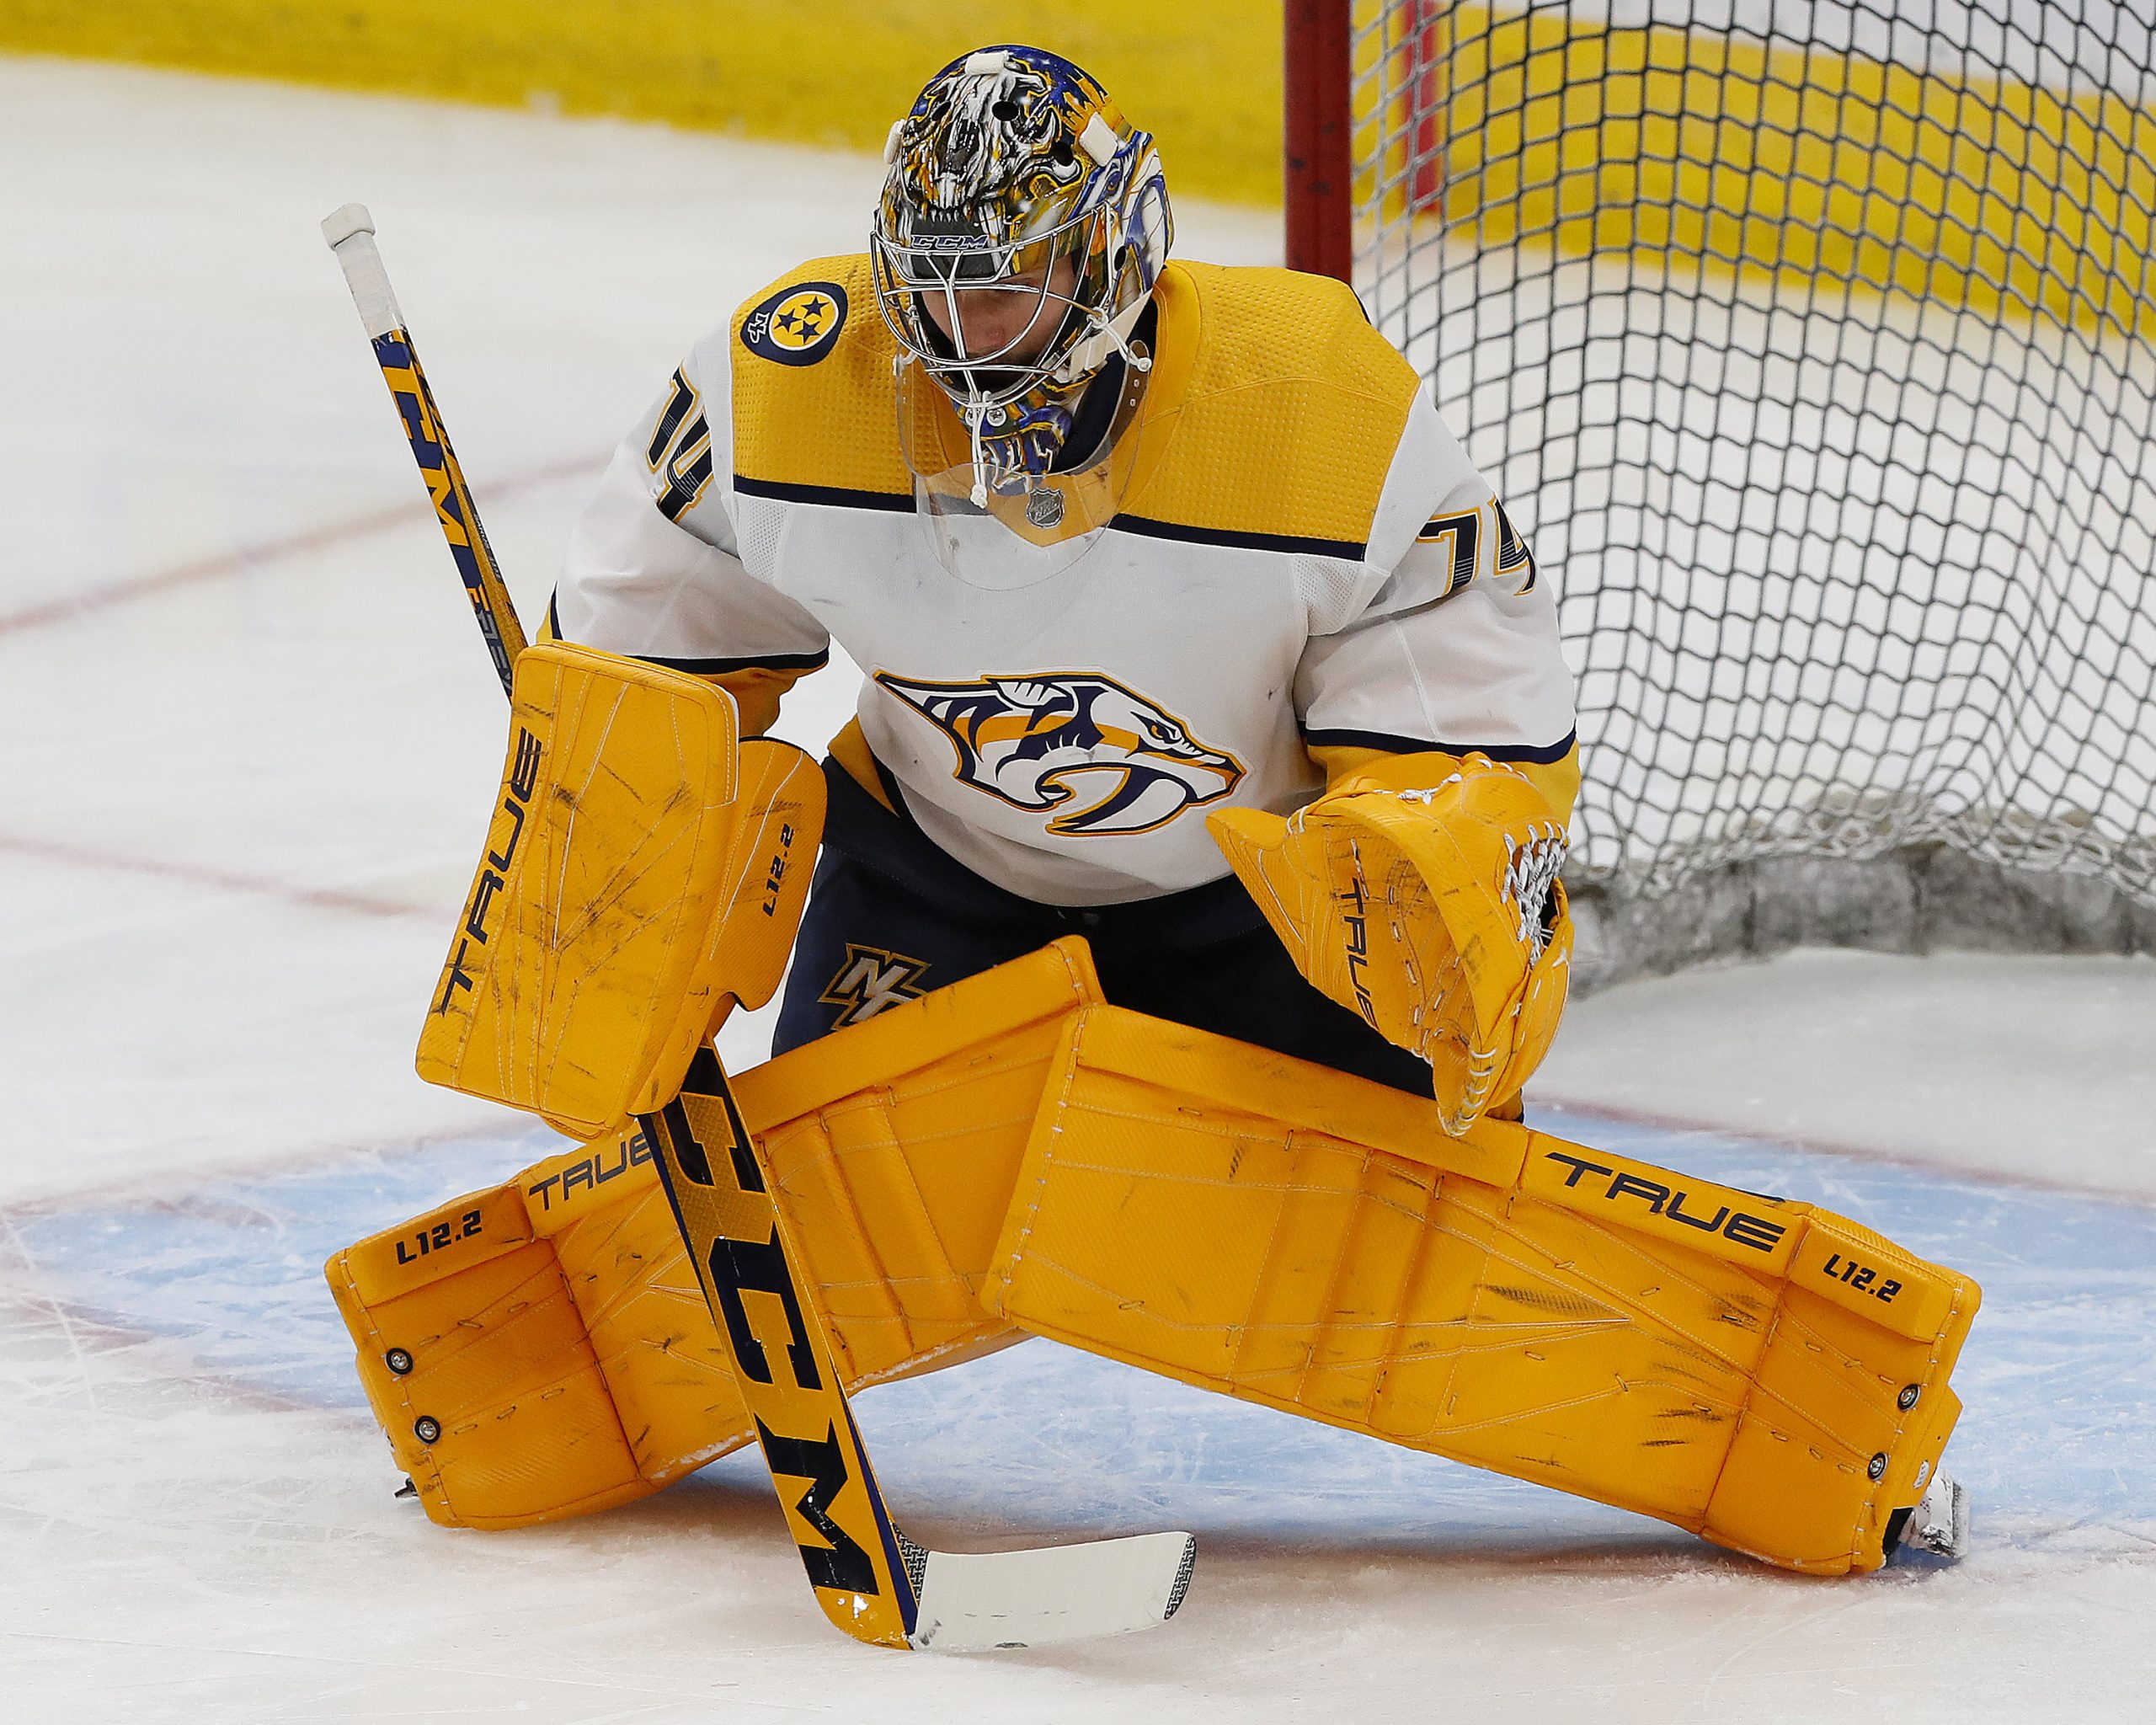
Understanding SV% and GAA
In the world of fantasy hockey, two metrics often take center stage in evaluating goalies: Save Percentage (SV%) and Goals Against Average (GAA). These traditional statistics, while straightforward, offer significant insights into a goalie’s performance and are crucial for making informed decisions in fantasy hockey.
Save Percentage (SV%)
SV% measures the percentage of shots a goalie stops and is a direct indicator of their efficiency in the net. It’s a valuable metric because it focuses solely on the goalie’s ability to prevent goals. Analytical Perspective: High SV% is often associated with better goalie performance. However, it’s essential to consider the volume of shots faced, as goalies with a high number of shots against might have a slightly lower SV% but are still performing well under pressure.
Goals Against Average (GAA)
GAA calculates the average number of goals a goalie allows per 60 minutes. It’s a quick reference to gauge a goalie’s effectiveness but is more team-dependent than SV%. Contextual Analysis: While a lower GAA is generally desirable, it’s important to contextualize this stat within the team’s overall defensive performance. Goalies on defensively stronger teams might have an advantage in maintaining a lower GAA.
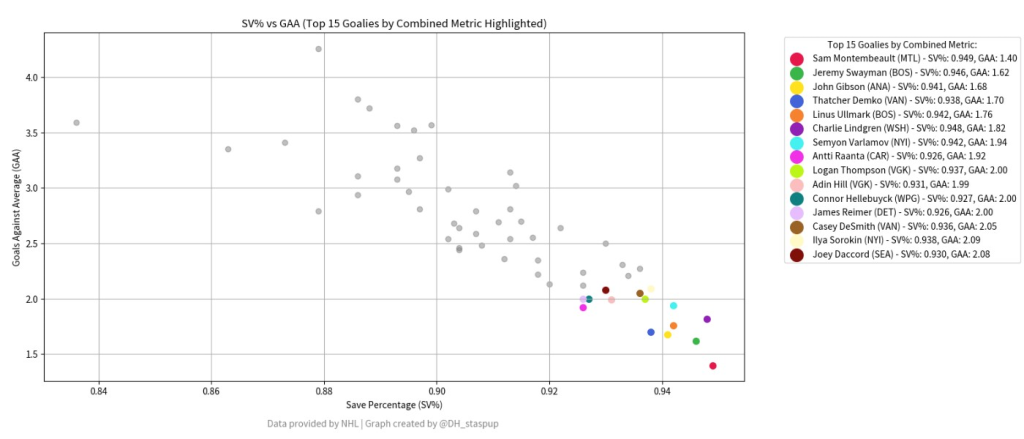
Each goalie is plotted based on their SV% (X-axis) and GAA (Y-axis). Ideally, we’re looking for goalies with high SV% and low GAA, as they indicate top-tier performance.
The top 15 goalies, selected based on a combined metric of SV% and GAA, stand out in distinct colors. This metric gives us a rounded perspective, balancing shot-saving ability with the rate of goals conceded.
The Standouts – Goalies in the bottom right quadrant are the cream of the crop. Excelling in both SV% and GAA, they are pivotal players for our fantasy teams, likely bringing consistent high performance.
Hidden Gems – There might be goalies who, despite not making the top 15, show promising positions on the plot. These could be the underrated players in fantasy leagues, poised to bring value to our teams.
Trends in the League – The general spread of goalies gives us a snapshot of league trends. A concentration in a particular area might signal a broader trend that we can capitalize on.
Roster Moves – Understanding where goalies stand in terms of SV% and GAA is key to making smart roster decisions – whom to start, whom to bench, and whom to target in trades.
Spotting Trends – Keeping an eye on updated versions of this plot can help us spot emerging talents or declining veterans, allowing us to adapt our strategies in real time. This plot isn’t just a one-time snapshot; it’s a dynamic tool reflecting ongoing shifts in goalie performances. As we progress through the season, it will continue to be a vital asset in guiding our fantasy hockey decisions, ensuring we stay ahead of the curve.
In fantasy hockey, where every decision can impact the outcome of a season, the importance of rigorous, data-driven analysis cannot be overstated. The detailed examination of NHL goalies, through the lens of SV% and GAA, represents a critical endeavor in understanding a notoriously unpredictable aspect of the game: goalie performance.
Unpredictable Terrain of Goalie Performance
Goalies, perhaps more than any other player in hockey, are subject to streaks of both brilliance and struggle. Their performances can fluctuate due to a multitude of factors, from changes in team dynamics and defensive schemes to personal form and injury recovery. This inherent volatility makes predicting their future performance a challenging, yet crucial, aspect of fantasy hockey strategy. The scatter plot analysis provided aims to offer clarity in this complex scenario. By focusing on current performance metrics, we can identify goalies who are excelling and those who are underperforming. However, it’s important to remember that these metrics are snapshots of a dynamic, evolving season. A goalie riding a hot streak might regress to the mean, just as an underperformer could suddenly find their form. In fantasy hockey, success often hinges on the ability to anticipate these shifts and act on them before they become common knowledge. Staying informed, regularly revisiting the data, and being ready to adapt strategies are essential practices for staying ahead.
Data courtesy of Natural Stat Trick | Graphs crafted by @DH_staspup
Related Posts
UPCOMING GAMES
| Apr 27 - 14:04 |
| vs |
| |
| Apr 27 - 17:04 |
| vs |
| |
| Apr 27 - 20:04 |
| vs |
| |
| Apr 27 - 22:04 |
| vs |
| |
Starting Goalies
Top Skater Views
Top Goalie Profile Views
LINE COMBOS
| Frequency |
| |
|---|---|---|
| 24.9 | ALEXANDER NYLANDER JOHNNY GAUDREAU JUSTIN DANFORTH | |
| 22.0 | MATHIEU OLIVIER JAMES MALATESTA SEAN KURALY | |
| 18.7 | ALEXANDRE TEXIER COLE SILLINGER KIRILL MARCHENKO | |
DobberHockey Podcasts

Fantasy Hockey Life: Salary Cap Basics Remix
If you missed last year’s series on salary leagues, this is a remix with some bonus material. Jesse and Victor discuss the different ways you can step up your dynasty league with a salary component. Our show is part of the Dobber Podcast Network and sponsored by Fantrax.com. Email [email protected] and ask to join our […]

Keeping Karlsson: No. 533 – Ultimate Champion Interview + Playoff Preview
On this week’s Keeping Karlsson Fantasy Hockey Podcast mega-show, Elan and Brian gather and analyze the latest fantasy hockey news, notes and data.
Fantasy Hockey Life: Tim-Eh’s Time in the TIDY Top Tier
When one of the managers in the TIDY league top tier left midseason, Patron Tim volunteered to give up his excellent team to take over a mid-season orphan fighting to escape relegation. And Tim did not go quietly. Ryan, Jesse and Victor welcome Tim to talk through his experience and the trades he made in […]
Keeping Karlsson: Better Off Nedeljkovic
On this week’s Keeping Karlsson Fantasy Hockey Podcast mega-show, Elan and Brian gather and analyze the latest fantasy hockey news, notes and data from the past season to work on projecting the 2023-24 NHL and fantasy hockey season. — Join the Keeping Karlsson patron community! Patrons get guaranteed KKUPL invitations, plus monthly bonus AMA episodes, and full access to […]
Fantasy Hockey Life: FHL Player Cards with Brandon
Our guy Brandon has been doing great work behind the scenes to great Fantasy Hockey Life prospect player cards, visualizations with the metrics we care about most – including BASH. These are a great tool to catch at a glance the stats for upcoming players. Jesse interviews Brandon and Victor on the decisions behind what […]