Analytics Advantage: Using Expected Goals and PDO to Identify High-End and Low-End Performers
Stas Pupkov
2024-01-25
In the dynamic world of NHL, the ability to dissect and understand player performance is key to grasping the finer nuances of the game. Advanced analytics have opened new horizons, offering insights that go beyond the surface of traditional statistics. This week, our focus turns to two such groundbreaking metrics: PDO and xGF (Expected Goals For). While PDO gives us a glimpse into the elements of luck and chance, xGF offers a measure of offensive skill and ingenuity. Our exploration delves into how these metrics, when combined, can reveal much about a player’s true impact on the ice. Through an innovative quadrant analysis, we aim to uncover the hidden layers of player performance, offering a fresh perspective on what it takes to excel in the NHL.
Understanding the Metrics
PDO: Deciphering Luck and Performance in Hockey
In the intricate tapestry of NHL analytics, PDO stands out as a pivotal metric that offers a unique glimpse into the often-overlooked aspects of luck and chance in a player’s performance. Centered around the norm of 1.0, PDO combines a team’s shooting and save percentages, serving as a barometer for potential fluctuations in a player’s fortunes. Values soaring above this benchmark might hint at a fortunate streak, perhaps an unsustainably high level of success. Conversely, a PDO below 1.0 could suggest an impending upswing, signaling a period of underperformance where luck hasn’t favored the player. Crucially, PDO’s power lies in its predictive nature, hinting at whether a player’s current performance is sustainable or likely to regress to the league’s average.
While xGF (Expected Goals For) is a familiar metric to our readers, providing insights into the offensive effectiveness and quality of scoring opportunities, PDO offers a complementary perspective. It allows us to delve deeper into the elements of chance that can influence a player’s statistical output, from goaltenders’ save percentages to the team’s overall shooting efficiency.
Together, these metrics form a more complete picture of a player’s impact on the ice, extending our understanding beyond mere goal counts and assist tallies. They allow us to appreciate the nuances of player performance, influenced by both skill and the often-unpredictable nature of luck in the sport.
Methodology: The Quadrant Approach
In our quest to unravel the complexities of player performance in the NHL, we employ a quadrant analysis that combines PDO and xGF. This method allows us to categorize players into four distinct groups based on their statistical profiles, offering a multifaceted view of their abilities and roles on the ice.
Crafting the Quadrants
The quadrant approach hinges on the intersection of PDO and xGF, plotted against each other. The mean values of PDO and xGF create a central point, around which the players are distributed. Each quadrant represents a unique combination of the two metrics:
Top-Right Quadrant (High PDO, High xGF): Players here are enjoying both luck and effectiveness. High PDO indicates good fortune, while high xGF points to a player's ability to create quality scoring chances. Players in this quadrant are often in a sweet spot of performance.
Top-Left Quadrant (Low PDO, High xGF): This quadrant is for the strategically sound yet seemingly unlucky players. Despite creating high-quality scoring opportunities (high xGF), their PDO suggests a lack of favorable outcomes, indicating potential for future improvement.
Bottom-Left Quadrant (Low PDO, Low xGF): Players in this quadrant might be struggling both in terms of luck and creating scoring chances. This group could be ripe for further analysis to identify areas for development.
Bottom-Right Quadrant (High PDO, Low xGF): These players might be riding a wave of luck (high PDO) without effectively generating quality scoring opportunities (low xGF), which raises questions about the sustainability of their performance.
Analytical Focus
Our analysis is geared towards identifying players who excel in their respective quadrants, as well as those who defy expectations. By doing so, we aim to spotlight not just the high performers but also those whose contributions might be undervalued or overlooked.
In our quadrant analysis, we focus on the most severe cases in each category, highlighting players who exemplify the extremes of PDO and xGF metrics. This approach allows us to understand the outliers within each quadrant and their unique impact on the game.
Top-Right Quadrant: The Exceptional Talents
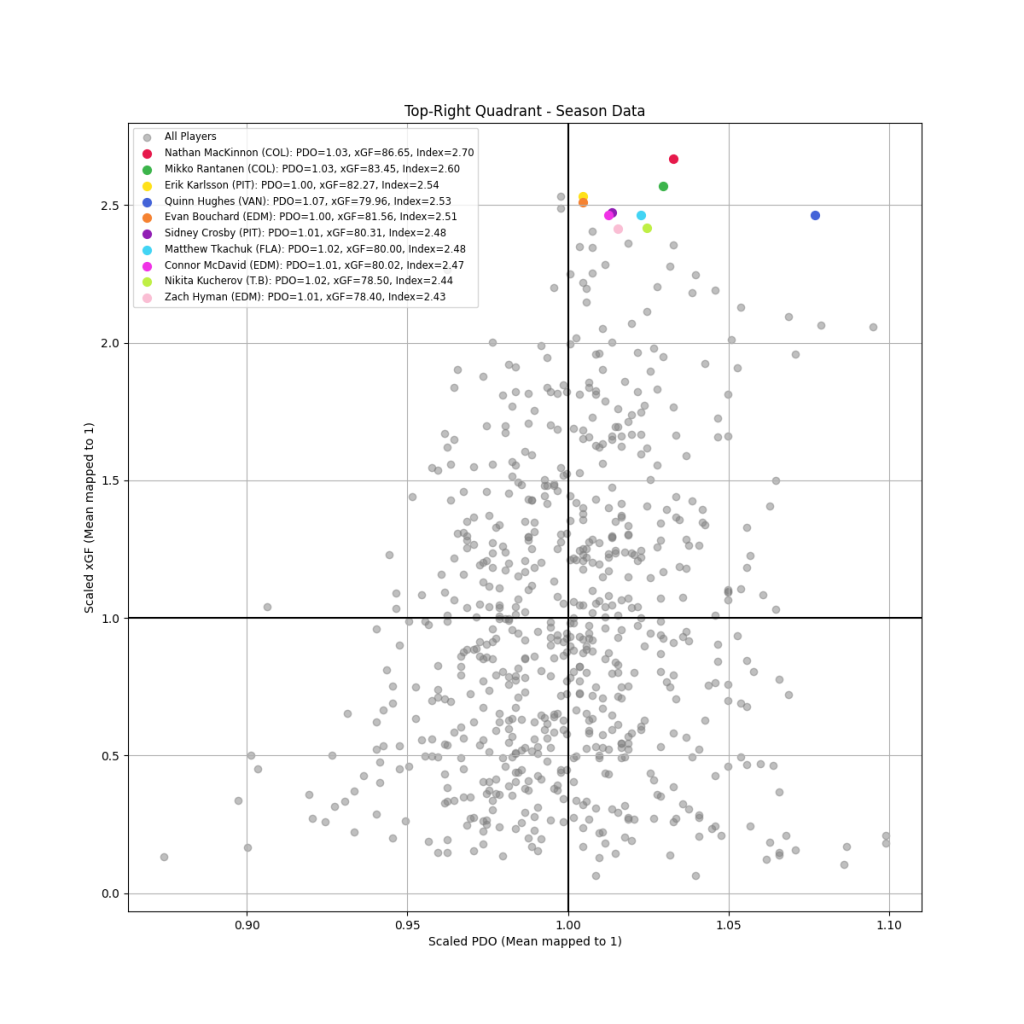
Players in this quadrant are at the pinnacle of performance, combining favorable luck with a high ability to create quality scoring opportunities. These exceptional talents are not only riding the crest of fortune (high PDO) but also consistently generating valuable plays (high xGF). They represent the ideal blend of skill and serendipity, often leading their teams in both statistics and on-ice impact.
Top-Left Quadrant: The Unrewarded Maestros
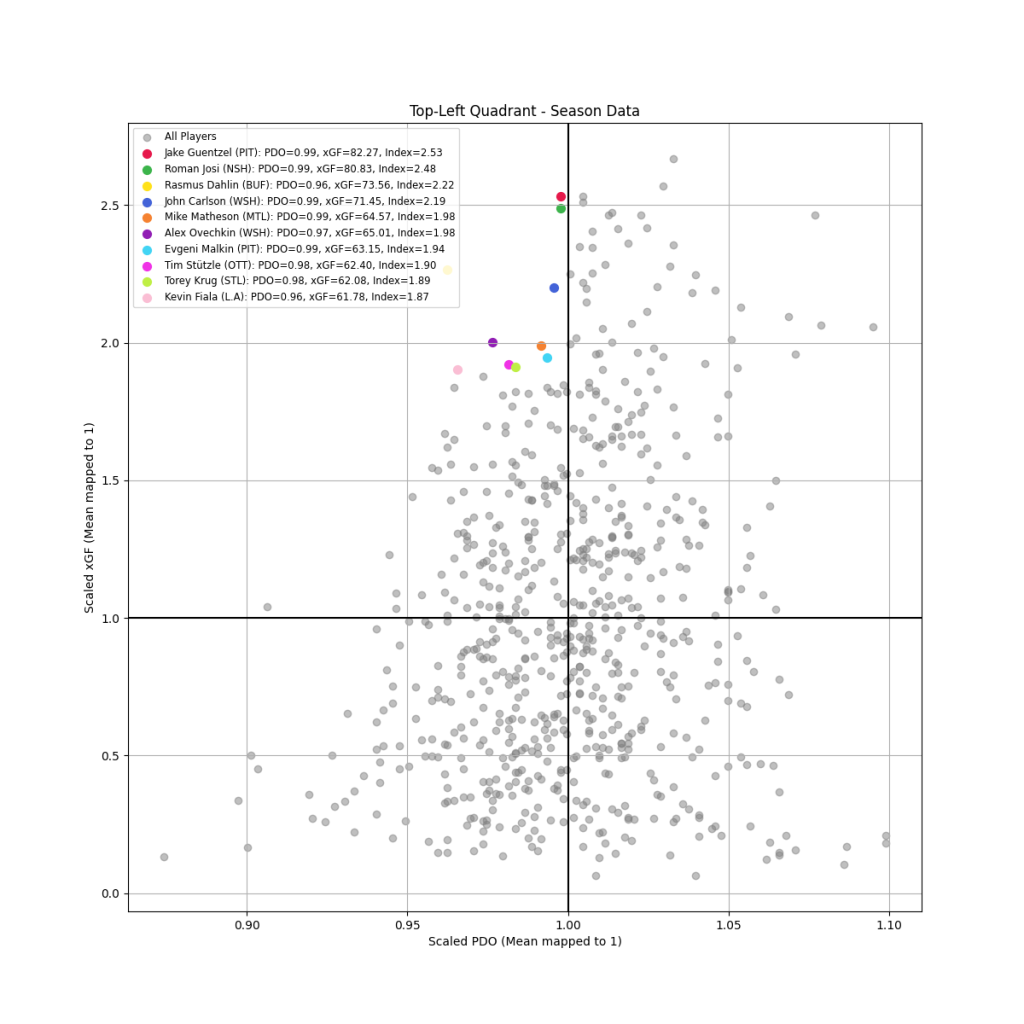
This quadrant is a testament to skill overshadowed by a streak of misfortune. Players here exhibit high xGF, indicating their effectiveness in creating scoring chances, but their low PDO suggests these efforts are not yet yielding the rewards they deserve. These players are often the hidden gems, whose true value may be underappreciated due to a temporary lapse in luck.
Bottom-Left Quadrant: The Strugglers
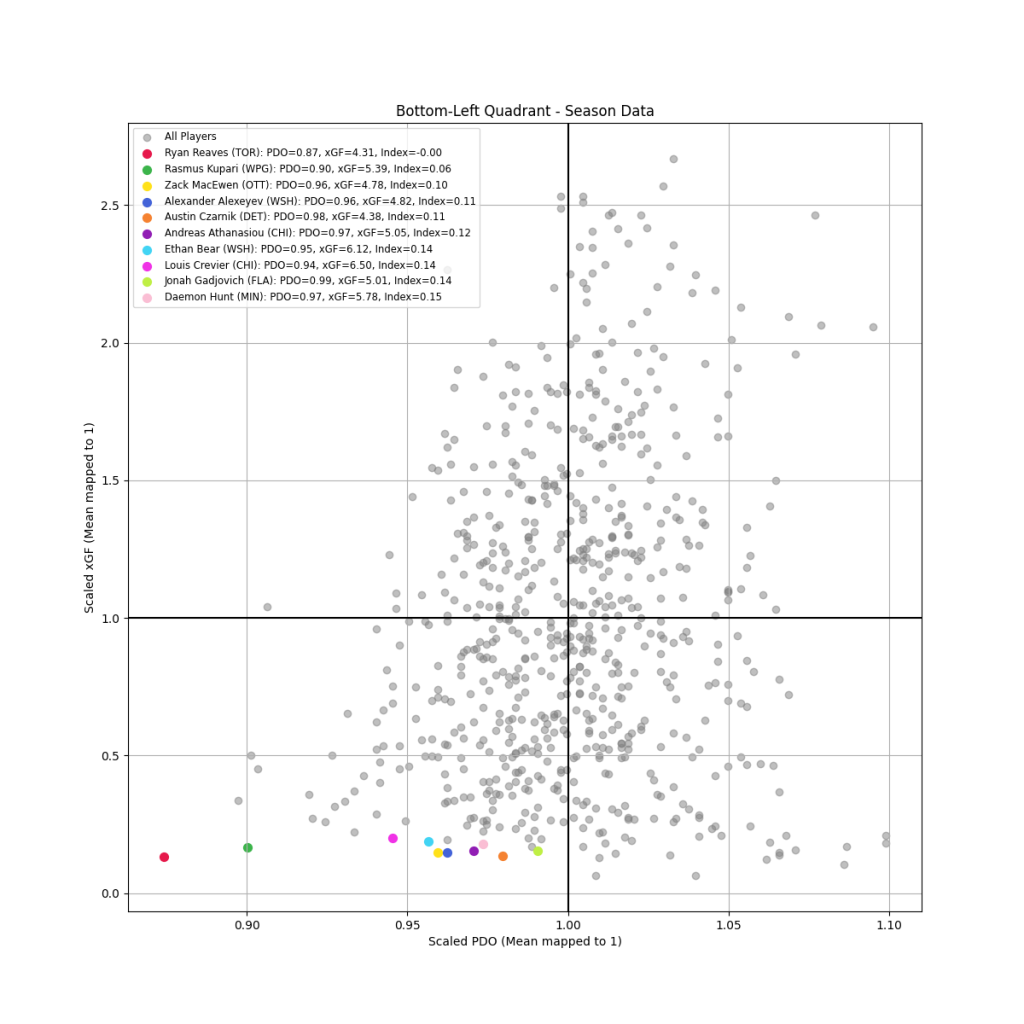
In this quadrant, players face a double challenge: a low PDO coupled with a low xGF. This group may include players who are struggling to find their rhythm in the league, whether due to skill gaps, adapting to the team’s playing style, or other factors. These players represent potential areas for focused development and coaching intervention.
Bottom-Right Quadrant: Riding the Wave
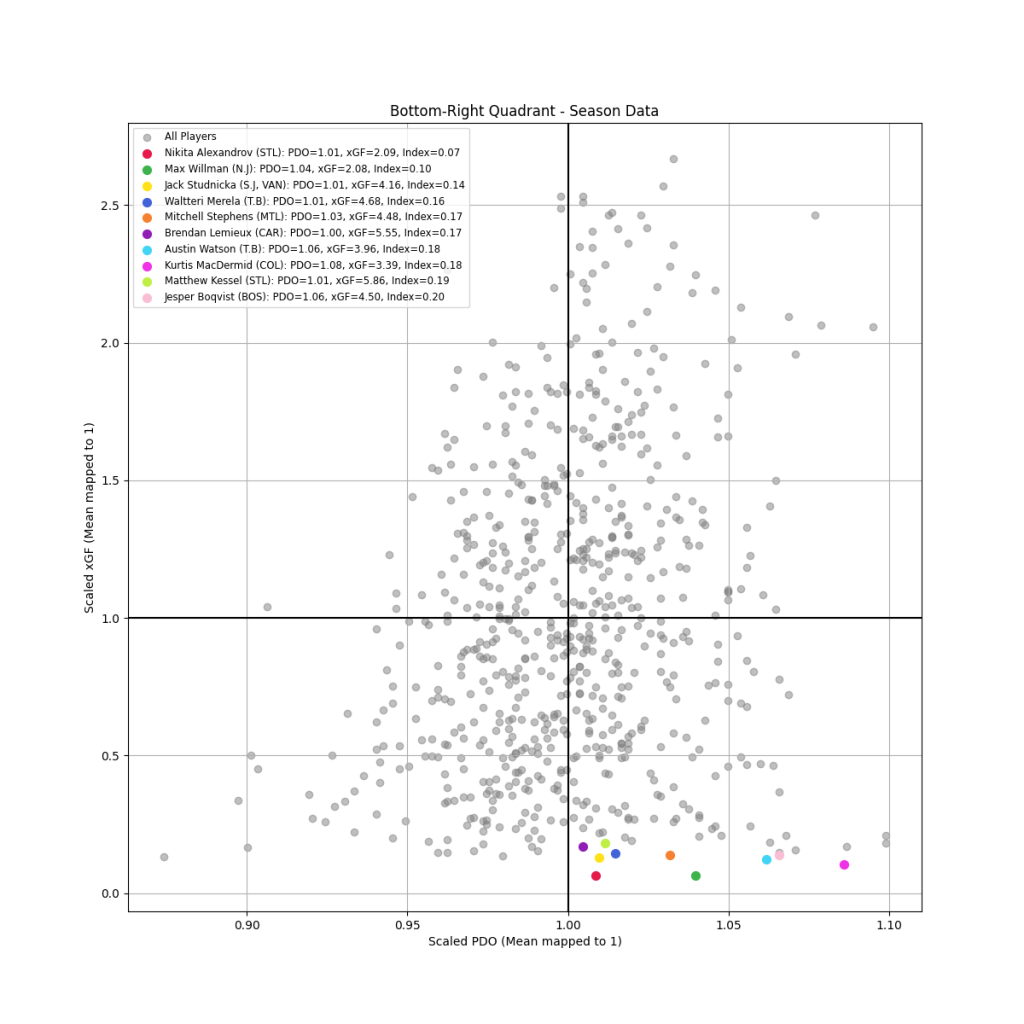
Here are players whose performance is currently bolstered by high PDO, masking a lower xGF. This scenario suggests a reliance on luck or external factors, rather than consistent offensive prowess. While enjoying a favorable phase, these players might need to enhance their playmaking and scoring abilities to sustain their performance in the long run.
Summary
The exploration of PDO and xGF through quadrant analysis transcends traditional hockey statistics, offering a more nuanced understanding of player performance in the NHL. This method not only sheds light on the factors of luck and skill but also tells a broader story about each player’s impact on the ice.
Through this analytical approach, we gain valuable insights into player capabilities, challenging and enriching our perception of what contributes to success in hockey. This method of analysis is a narrative device, weaving together numbers and gameplay to reveal the multifaceted nature of player performance.
The quadrant analysis is more than just a tool for evaluation; it’s a window into the intricacies of the sport, resonating with team managers, players, fans, and analysts. It highlights the evolving sophistication of sports analytics and its significant role in deepening our appreciation and understanding of hockey.
This approach to analytics does not merely quantify player performance; it brings to life the stories hidden within the game, showcasing the intricate blend of skill, strategy, and chance that defines the essence of the NHL.
Thank you for reading and have a great rest of your day!
Twitter/X – @DH_staspup for any questions, corrections, or comments
If you want to see how your team looks on the graph, DM me a list/photo of your roster*Data from Natural Stat Trick
Related Posts
UPCOMING GAMES
| Apr 27 - 14:04 |
| vs |
| |
| Apr 27 - 17:04 |
| vs |
| |
| Apr 27 - 20:04 |
| vs |
| |
| Apr 27 - 22:04 |
| vs |
| |
Starting Goalies
Top Skater Views
Top Goalie Profile Views
LINE COMBOS
| Frequency |
| |
|---|---|---|
| 12.9 | OWEN TIPPETT SCOTT LAUGHTON TRAVIS KONECNY | |
| 11.8 | TYSON FOERSTER JOEL FARABEE SEAN COUTURIER | |
| 11.8 | RYAN POEHLING GARNET HATHAWAY NOAH CATES | |
DobberHockey Podcasts

Fantasy Hockey Life: Salary Cap Basics Remix
If you missed last year’s series on salary leagues, this is a remix with some bonus material. Jesse and Victor discuss the different ways you can step up your dynasty league with a salary component. Our show is part of the Dobber Podcast Network and sponsored by Fantrax.com. Email [email protected] and ask to join our […]

Keeping Karlsson: No. 533 – Ultimate Champion Interview + Playoff Preview
On this week’s Keeping Karlsson Fantasy Hockey Podcast mega-show, Elan and Brian gather and analyze the latest fantasy hockey news, notes and data.
Fantasy Hockey Life: Tim-Eh’s Time in the TIDY Top Tier
When one of the managers in the TIDY league top tier left midseason, Patron Tim volunteered to give up his excellent team to take over a mid-season orphan fighting to escape relegation. And Tim did not go quietly. Ryan, Jesse and Victor welcome Tim to talk through his experience and the trades he made in […]
Keeping Karlsson: Better Off Nedeljkovic
On this week’s Keeping Karlsson Fantasy Hockey Podcast mega-show, Elan and Brian gather and analyze the latest fantasy hockey news, notes and data from the past season to work on projecting the 2023-24 NHL and fantasy hockey season. — Join the Keeping Karlsson patron community! Patrons get guaranteed KKUPL invitations, plus monthly bonus AMA episodes, and full access to […]
Fantasy Hockey Life: FHL Player Cards with Brandon
Our guy Brandon has been doing great work behind the scenes to great Fantasy Hockey Life prospect player cards, visualizations with the metrics we care about most – including BASH. These are a great tool to catch at a glance the stats for upcoming players. Jesse interviews Brandon and Victor on the decisions behind what […]