Analytics Advantage: High-Danger Save Percentage, Goals Saved Above Average, and Top Goalie Performances
Stas Pupkov
2024-02-08
The role of goaltenders in hockey is undeniably crucial, influencing the outcome of games and seasons. While traditional statistics like Save Percentage (SV%) and Goals Against Average (GAA) have dominated performance evaluations, they fall short of capturing the full spectrum of a goalie’s impact. This article pivots to advanced analytics, particularly High-Danger Save Percentage (HDSV%) and Goals Saved Above Average (GSAA), to offer a deeper dive into goalie performance. Focusing on players with over 15 games, we aim to uncover insights that redefine elite goaltending metrics in the modern era.
Understanding the Metrics: High-Danger Save Percentage (HDSV%) and Goals Saved Above Average (GSAA)
In the domain of hockey analytics, High-Danger Save Percentage (HDSV%) and Goals Saved Above Average (GSAA) emerge as pivotal metrics for evaluating goaltender efficacy. HDSV% quantifies a goaltender’s capability to thwart attempts originating from high-danger areas—specific zones on the ice with a statistically elevated likelihood of resulting in goals. This parameter sheds light on a goaltender’s proficiency in neutralizing potentially decisive shots, offering an intricate perspective on their performance under exigent conditions.
Conversely, GSAA provides an aggregate measure of a goaltender’s performance relative to the league’s average, delineating the disparity in goals allowed by a goaltender against the expected outcomes based on an average league counterpart, adjusted for shot volume. GSAA encapsulates a comprehensive evaluation of a goaltender’s overarching impact, incorporating the quality of shots faced and yielding a holistic view of their ability to surpass average performance benchmarks.
Collectively, HDSV% and GSAA facilitate a multifaceted analysis of goaltenders, transcending traditional metrics to afford a sophisticated examination of their contributions to team dynamics. This advanced analytical approach not only highlights top-tier performers but also reveals goalies who significantly influence outcomes in high-stakes scenarios, thereby contributing to a deeper and more rigorous understanding of goaltending prowess in contemporary hockey.
Methodology: The Quadrant Approach Expanded
In this analysis, we dive deeper into understanding goalie performances by breaking it down into a simple yet effective method: the quadrant approach. This method plots two key indicators of a goalie’s skill on a chart: how well they stop the most challenging shots (HDSV%) and their effectiveness in saving more goals than what’s expected of an average goalie (GSAA).
By examining goalies with a minimum of 15 games, we ensure our analysis is both meaningful and reliable. The chart then divides goalies into four categories, each highlighting different strengths and weaknesses. This quadrant system doesn’t just point out the best performers; it also helps identify goalies who excel in specific areas, offering a clearer picture of their unique contributions to the game.
This approach lets us see beyond traditional stats, providing a richer, more detailed view of what makes a goalie stand out. Whether it’s their knack for stopping high-danger shots or their consistent performance above the norm, the quadrant method brings these insights into focus, making it easier for fans, coaches, and analysts alike to appreciate the complexities of goaltending.
Crafting the Quadrants: Insights into Goalie Performance
Once we apply the quadrant approach, goalies are placed into four distinct groups based on their High-Danger Save Percentage (HDSV%) and Goals Saved Above Average (GSAA). This categorization offers a nuanced view of their abilities and contributions on the ice.
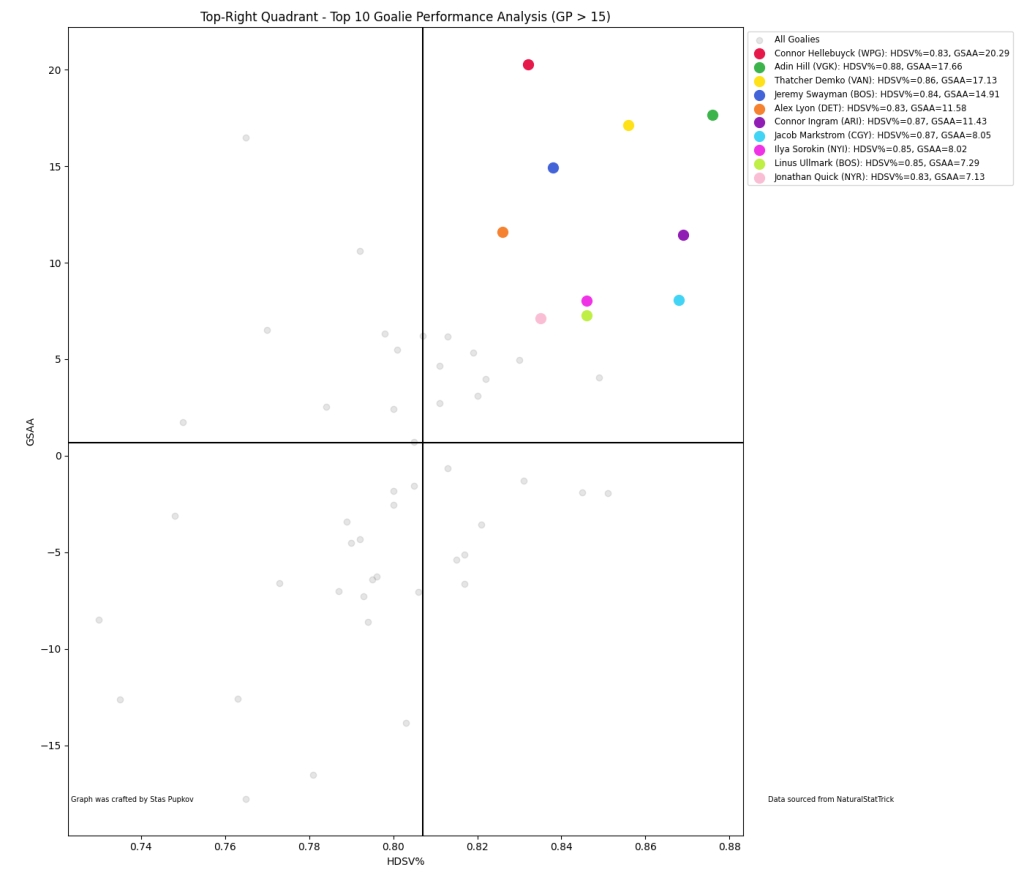
Elite Performers (Top-Right Quadrant): Goalies here excel in both metrics, demonstrating not only their skill in handling the toughest shots but also their overall superiority in preventing goals compared to their peers. They are the backbone of their teams, often turning potential losses into wins.
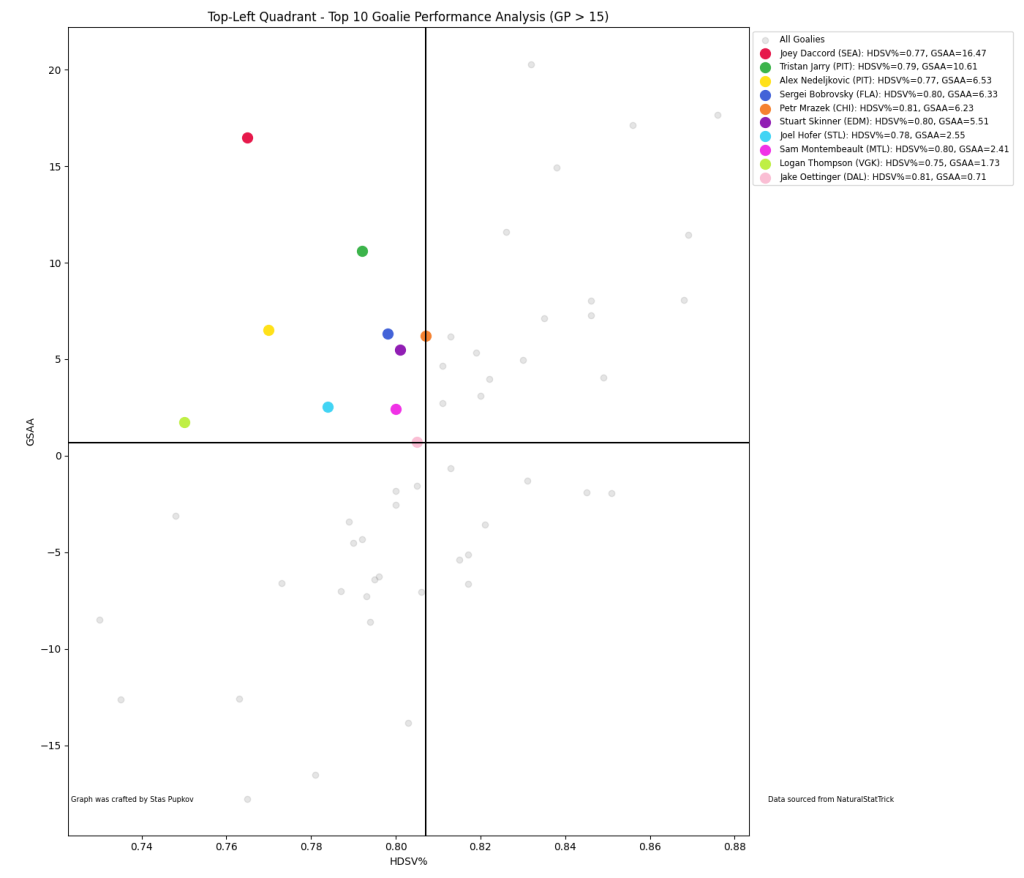
Under Pressure (Top-Left Quadrant): These goalies have high GSAA but lower HDSV%, indicating they save more goals than average but struggle slightly with high-danger shots. Their performance suggests resilience and the ability to make crucial saves, even if they face challenges with the most challenging attempts.
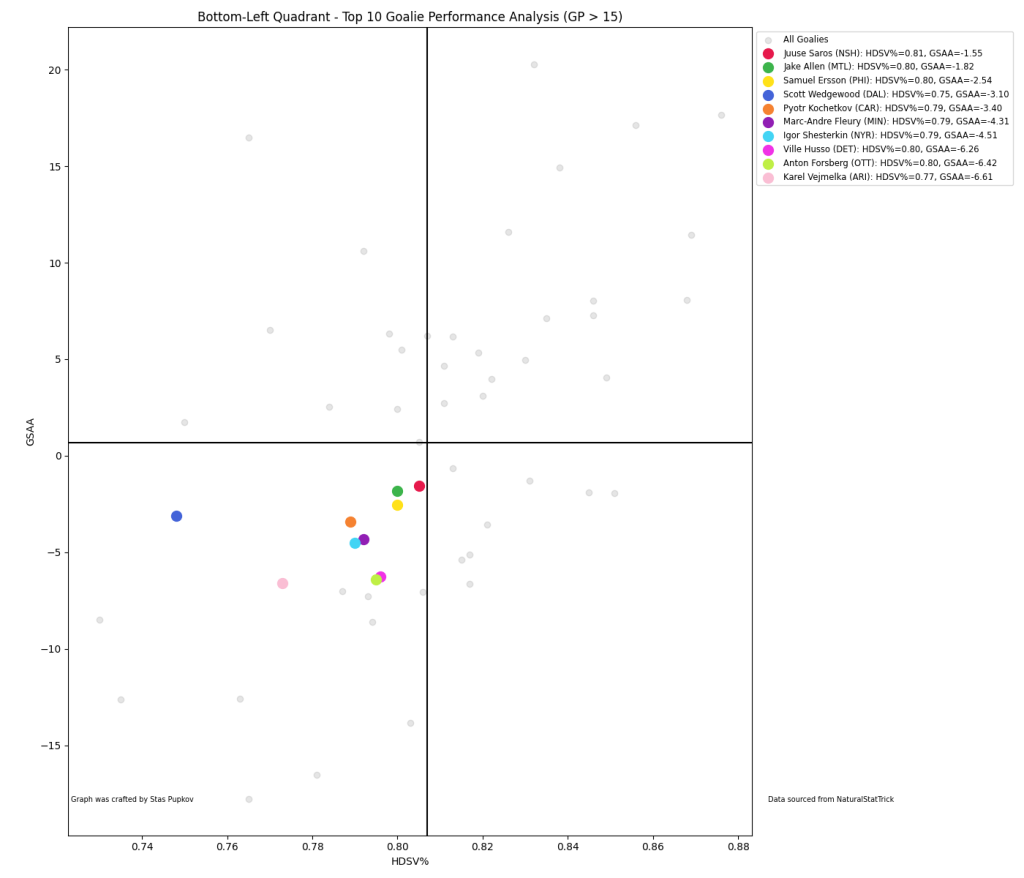
High Concern (Bottom-Left Quadrant): Occupants of this quadrant show below-average performance in both metrics. They face difficulties both in general play and in high-pressure situations, signaling areas where improvement is needed to enhance team success.
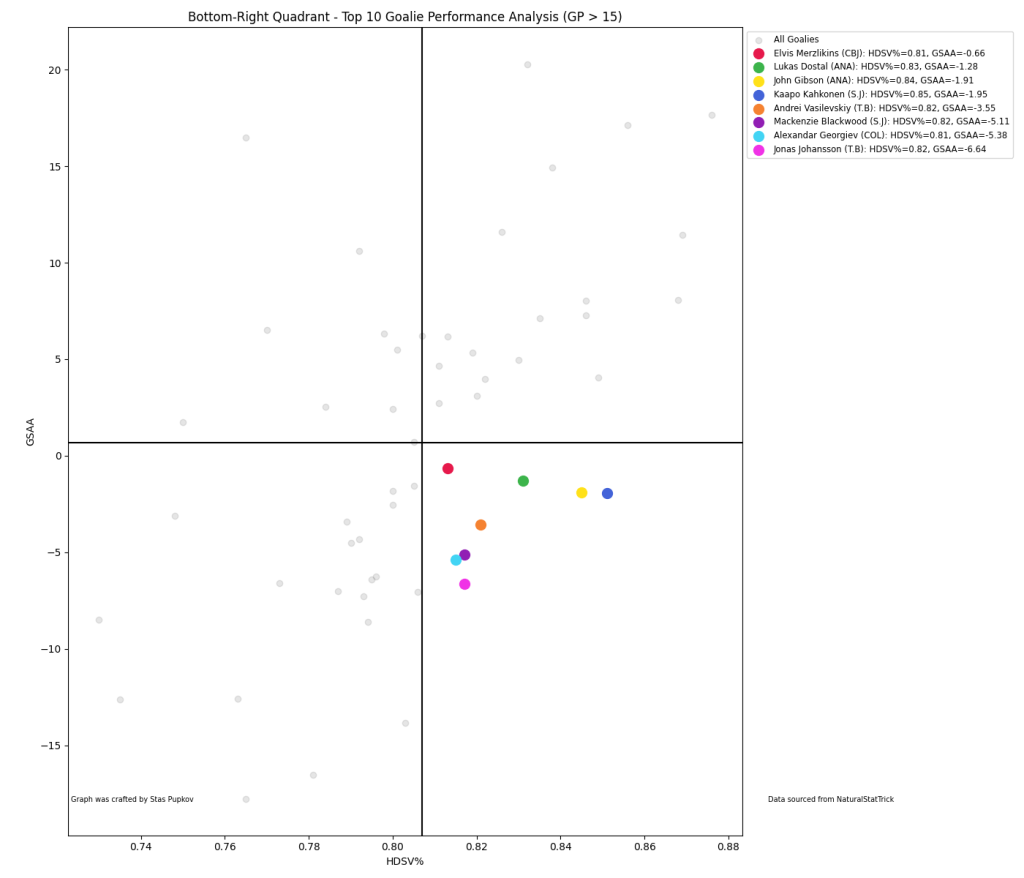
High Risk, High Reward (Bottom-Right Quadrant): Here, goalies perform well against high-danger shots but have a lower overall GSAA, suggesting inconsistency. They can make spectacular saves but might allow easier goals, making their play unpredictable but potentially game changing.
This methodology not only identifies the top performers but also highlights goalies who excel under pressure, those who may be struggling, and those with the potential for game-changing plays. It offers a comprehensive understanding of goalie performance beyond traditional statistics, aiding teams, analysts, and fans in appreciating the complex dynamics of goaltending.
Implications for Teams and Fantasy Managers
The quadrant analysis offers strategic insights for team management and fantasy hockey. For teams, identifying goalies in the “Elite Performers” quadrant can highlight reliable starters. Those in the “Under Pressure” category might benefit from targeted training on high-danger situations. Goalies in the “High Concern” quadrant could indicate a need for defensive adjustments or a backup plan. Fantasy managers can use this analysis to spot undervalued assets, particularly goalies in the “High Risk, High Reward” quadrant who may turn in game-winning performances. This nuanced understanding of goaltending can inform smarter decisions, from drafting to daily fantasy lineup adjustments, enhancing competitive strategies in real and fantasy realms.
Conclusion
This analysis transcends traditional goaltending metrics, offering a multifaceted view of performance through the quadrant approach. By examining HDSV% and GSAA, we gain deeper insights into the true impact of goalies beyond basic statistics. This methodology not only identifies elite talent but also highlights those with potential for improvement or with a propensity for high-risk, high-reward play. As the hockey landscape evolves, so does our understanding of player contributions, emphasizing the need for advanced analytics in strategic decision-making for teams and fantasy managers alike.
Thank you for reading and have a great rest of your day!
Twitter/X – @DH_staspup for any questions, corrections, or comments
If you want to see how your team looks on the graph, DM me a list/photo of your roster
Related Posts
UPCOMING GAMES
| Apr 27 - 14:04 |
| vs |
| |
| Apr 27 - 17:04 |
| vs |
| |
| Apr 27 - 20:04 |
| vs |
| |
| Apr 27 - 22:04 |
| vs |
| |
Starting Goalies
Top Skater Views
Top Goalie Profile Views
LINE COMBOS
| Frequency |
| |
|---|---|---|
| 24.0 | GABRIEL VILARDI MARK SCHEIFELE KYLE CONNOR | |
| 17.7 | NINO NIEDERREITER ADAM LOWRY MASON APPLETON | |
| 16.3 | TYLER TOFFOLI SEAN MONAHAN NIKOLAJ EHLERS | |
DobberHockey Podcasts

Fantasy Hockey Life: Salary Cap Basics Remix
If you missed last year’s series on salary leagues, this is a remix with some bonus material. Jesse and Victor discuss the different ways you can step up your dynasty league with a salary component. Our show is part of the Dobber Podcast Network and sponsored by Fantrax.com. Email [email protected] and ask to join our […]

Keeping Karlsson: No. 533 – Ultimate Champion Interview + Playoff Preview
On this week’s Keeping Karlsson Fantasy Hockey Podcast mega-show, Elan and Brian gather and analyze the latest fantasy hockey news, notes and data.
Fantasy Hockey Life: Tim-Eh’s Time in the TIDY Top Tier
When one of the managers in the TIDY league top tier left midseason, Patron Tim volunteered to give up his excellent team to take over a mid-season orphan fighting to escape relegation. And Tim did not go quietly. Ryan, Jesse and Victor welcome Tim to talk through his experience and the trades he made in […]
Keeping Karlsson: Better Off Nedeljkovic
On this week’s Keeping Karlsson Fantasy Hockey Podcast mega-show, Elan and Brian gather and analyze the latest fantasy hockey news, notes and data from the past season to work on projecting the 2023-24 NHL and fantasy hockey season. — Join the Keeping Karlsson patron community! Patrons get guaranteed KKUPL invitations, plus monthly bonus AMA episodes, and full access to […]
Fantasy Hockey Life: FHL Player Cards with Brandon
Our guy Brandon has been doing great work behind the scenes to great Fantasy Hockey Life prospect player cards, visualizations with the metrics we care about most – including BASH. These are a great tool to catch at a glance the stats for upcoming players. Jesse interviews Brandon and Victor on the decisions behind what […]