Analytics Advantage: Corsi-For Percentage and Average Draft Position
Stas Pupkov
2024-02-15
In today’s NHL, the fusion of traditional scouting and advanced analytics offers a multifaceted view of player evaluation, transcending beyond simple goal counts and assist tallies. Central to this analytical revolution is the Corsi For Percentage (CF%), a metric that sheds light on a player’s ability to influence game play positively. This analysis seeks to juxtapose players’ CF% against their Average Draft Positions (ADP) to unveil potential gaps between perceived value and actual on-ice performance. By identifying discrepancies, we aim to spotlight undervalued talents and question potential overvaluations, providing a nuanced perspective to player drafting strategies in fantasy hockey leagues.
Understanding the Metrics
In the realm of hockey analytics, CF% stands as a pivotal metric, offering a deeper insight into a player’s effectiveness during their ice time. It measures the share of shot attempts (goals, saves, misses, and blocks) a team produces compared to its opponents when a specific player is on the ice. A higher CF% indicates a player’s ability to drive possession and create offensive opportunities, marking them as a valuable asset to their team.
Parallel to CF% in its importance for analysis, ADP serves as a crucial benchmark within fantasy hockey circles. It reflects the collective valuation of players based on their expected performance, aggregated from numerous fantasy drafts. ADP acts as a guiding star for fantasy managers, helping navigate through the drafting process by highlighting perceived player values.
By examining both CF% and ADP, this analysis aims to bridge the gap between statistical performance metrics and fantasy sports valuation, offering readers a comprehensive understanding of where real-world effectiveness and fantasy perceptions align or diverge.
Methodology: Combining Analytics with Draft Insights
Our methodology intertwines rigorous data analysis with insights drawn from fantasy sports, creating a comprehensive framework for evaluating NHL player performance. We begin by aggregating ADP from three leading fantasy sports platforms: Yahoo, ESPN, and CBS. This approach ensures a balanced and representative understanding of a player’s perceived value across the fantasy sports community.
Simultaneously, we delve into the statistical heart of hockey analytics, focusing on CF%. By filtering our dataset to include only players with more than 15 games played and over 150 minutes of time on ice, we ensure that our analysis is grounded in substantial, consistent performance data. This filtration process underscores our commitment to accuracy and relevance, providing a solid foundation for our comparative analysis.
The crux of our methodology lies in the comparative analysis of CF% against ADP. By ranking players based on their CF% and then juxtaposing these rankings with their ADP, we uncover disparities that highlight both undervalued gems and potential overvaluations in fantasy drafts. This process not only reveals the dynamics of player valuation but also sheds light on the strategic considerations fantasy managers and NHL teams alike must navigate.
To incorporate the numbers and provide evidence behind each player’s ranking discrepancy, consider adding specific details like the following to the Analytical Insights section. This enhancement will offer readers concrete examples to understand the valuation dynamics better:
Analytical Insights with Evidence
Top Positive Jumps illustrate players like M. Bunting, whom, with a CF% rank of 13 and an ADP of 234, showcases a significant undervaluation by 221 ranks. Similarly, T. Teravainen’s CF% rank of 18 versus an ADP of 222 results in a 204-rank discrepancy, and S. Jarvis moves from a CF% rank of 36 to an ADP of 238, underscoring a 202-rank difference. These examples highlight players whose on-ice contributions are not fully captured by their draft valuations.
Top Negative Jumps spotlight M. Seider, whose CF% rank at 238 starkly contrasts with an ADP of 56, revealing a 182-rank overestimation. A. Pietrangelo and J. Carlson exhibit similar trends, with ADPs that far precede their CF% contributions by 172 and 171 ranks, respectively, suggesting potential overvaluations within fantasy leagues.
Minimal Movement is demonstrated by players like:
- Q. Hughes perfectly aligns in valuation with both his CF% rank and ADP sitting at 37, showing a zero rank difference. This indicates an accurate valuation by the market.
- R. Sandin mirrors this precision, with both his CF% rank and ADP at 222, also resulting in a zero rank difference.
- Fantilli exhibits a strikingly precise valuation, with his CF% rank at 159 and his ADP also at 159, indicating no discrepancy.
- For K. Hayes, the CF% rank is 202 and the ADP is 201, demonstrating a minimal rank difference of 1, showcasing nearly perfect market alignment.
- C. Giroux has a CF% rank of 93 compared to an ADP of 94, leading to a very slight rank difference of 1.
These detailed insights, grounded in specific numerical evidence, enhance the narrative by clearly demonstrating the discrepancies and alignments between players’ statistical performance metrics and their fantasy draft rankings.
Visual Analysis: CF% vs. ADP
The visual analysis segment delves into the nuanced relationship between players’ Corsi For Percentage (CF%) and their Average Draft Position (ADP), employing scatter plots for a clear, comparative display. By plotting CF% on the y-axis against ADP on the x-axis, these charts vividly highlight both the discrepancies and alignments within player valuations. This methodical approach serves not only to bolster the depth of our analytical insights but also to render complex statistical relationships accessible and engaging for a diverse audience, enhancing their understanding of NHL player performance evaluation.
Deep Dive into Player Performance: CF% vs ADP Analysis
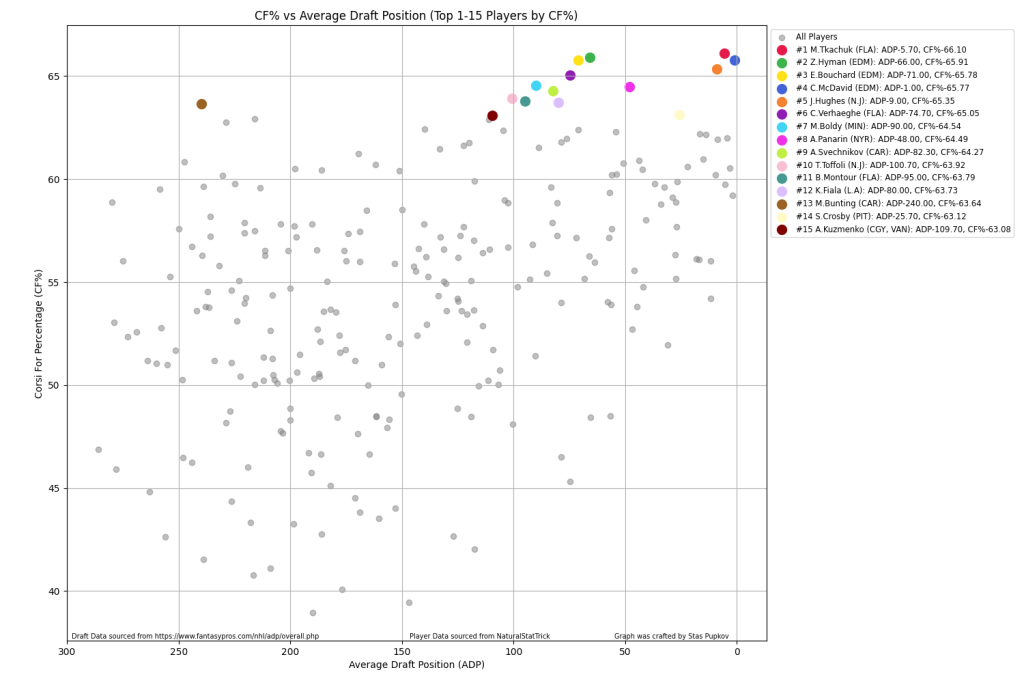
The scatter plots depicting CF% against ADP for the top 45 players yield a revealing narrative:
Elite Performers (1-15): The first graph focuses on the crème de la crème, where CF% leaders are expected to have lower ADPs. Any significant deviations here spotlight the underappreciated elite who's on-ice influence isn’t mirrored in their draft rankings:
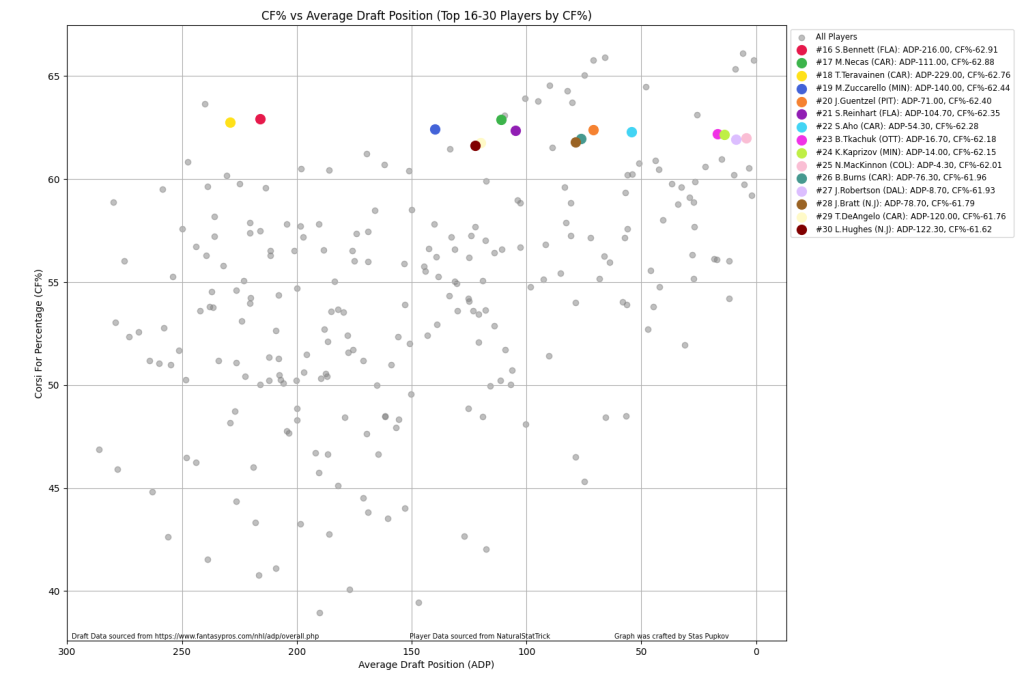
Middle Pack (16-30): The second graph covers players who perform well but may not be superstars. Disparities in this group can indicate players poised for a breakout or those who are not living up to heightened expectations:
Potential Undervalued (31-45): The final graph captures those who may be flying under the radar. A higher CF% rank with a lower ADP in this bracket suggests players who might be the key to winning a fantasy league by outperforming their draft position:
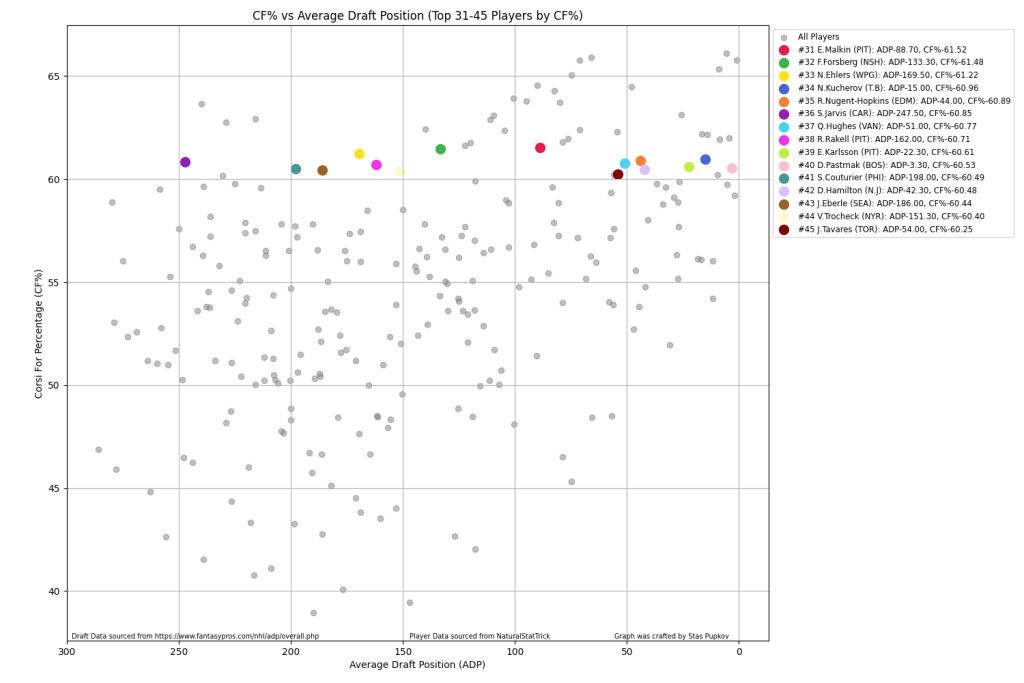
These visual analyses, broken down by ranking tiers, provide a granular look at how well fantasy draft rankings align with a key on-ice performance metric, guiding strategic decision-making.
Conclusion
As we draw the curtain on our analytical odyssey, the interaction between CF% and ADP unravels a compelling story. From the undercurrents of underappreciation to the crests of potential overvaluation, the data lays bare the art and science of player valuation. This deep dive into the numbers beckons a strategic shift in fantasy hockey drafts and offers NHL teams a lens through which to view the complex market of player performance. We extend an invitation to our readers to delve into these insights, fostering a dialogue that could illuminate future drafts and strategies.
Thank you for reading and have a great rest of your day!
Twitter/X – @DH_staspup for any questions, corrections, or comments
If you want to see how your team looks on the graph, DM me a list/photo of your roster
Draft data sourced from fantasypros
Player Data sourced from NaturalStatTrick
Related Posts
UPCOMING GAMES
| Apr 27 - 14:04 |
| vs |
| |
| Apr 27 - 17:04 |
| vs |
| |
| Apr 27 - 20:04 |
| vs |
| |
| Apr 27 - 22:04 |
| vs |
| |
Starting Goalies
Top Skater Views
Top Goalie Profile Views
LINE COMBOS
| Frequency |
| |
|---|---|---|
| 23.3 | ALEX KILLORN CUTTER GAUTHIER LEO CARLSSON | |
| 20.2 | TROY TERRY ISAC LUNDESTROM SAM COLANGELO | |
| 16.7 | TREVOR ZEGRAS FRANK VATRANO RYAN STROME | |
DobberHockey Podcasts

Fantasy Hockey Life: Salary Cap Basics Remix
If you missed last year’s series on salary leagues, this is a remix with some bonus material. Jesse and Victor discuss the different ways you can step up your dynasty league with a salary component. Our show is part of the Dobber Podcast Network and sponsored by Fantrax.com. Email [email protected] and ask to join our […]

Keeping Karlsson: No. 533 – Ultimate Champion Interview + Playoff Preview
On this week’s Keeping Karlsson Fantasy Hockey Podcast mega-show, Elan and Brian gather and analyze the latest fantasy hockey news, notes and data.
Fantasy Hockey Life: Tim-Eh’s Time in the TIDY Top Tier
When one of the managers in the TIDY league top tier left midseason, Patron Tim volunteered to give up his excellent team to take over a mid-season orphan fighting to escape relegation. And Tim did not go quietly. Ryan, Jesse and Victor welcome Tim to talk through his experience and the trades he made in […]
Keeping Karlsson: Better Off Nedeljkovic
On this week’s Keeping Karlsson Fantasy Hockey Podcast mega-show, Elan and Brian gather and analyze the latest fantasy hockey news, notes and data from the past season to work on projecting the 2023-24 NHL and fantasy hockey season. — Join the Keeping Karlsson patron community! Patrons get guaranteed KKUPL invitations, plus monthly bonus AMA episodes, and full access to […]
Fantasy Hockey Life: FHL Player Cards with Brandon
Our guy Brandon has been doing great work behind the scenes to great Fantasy Hockey Life prospect player cards, visualizations with the metrics we care about most – including BASH. These are a great tool to catch at a glance the stats for upcoming players. Jesse interviews Brandon and Victor on the decisions behind what […]