Advanced Analytics: Fantasy Contributions and High-, Medium-, and Low-Danger Goals
Stas Pupkov
2024-02-22
Building upon our journey through the intricate world of hockey analytics from an earlier article, this article serves as a continuation of our initial exploration, and delves further into the nuanced metrics that reveal the hidden layers of player performance. With a foundation laid in understanding expected goals-for percentages, as well as high-, medium-, and low-danger goals-for metrics (xGF%, HDGF%, MDGF%, and LDGF%) we now extend our analysis, focusing on nine insightful graphs that deepen our comprehension of these statistics. This piece is designed for readers versed in the basics of hockey analytics, aiming to enrich their knowledge and application of advanced metrics in assessing player impact and strategizing for fantasy hockey. Join us as we navigate through this advanced analytical landscape, uncovering the subtle dynamics that influence player valuation and team success.
Advanced Metrics in Action
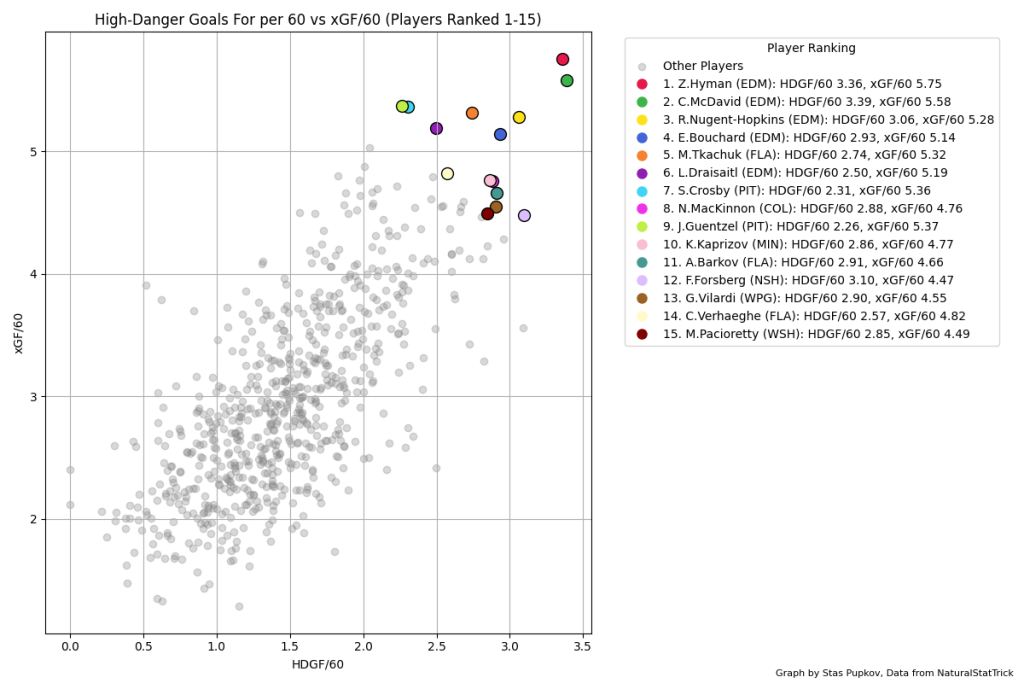
Following our introduction, we embark on a detailed examination of player performance through the lens of goal danger levels. These initial graphs shine a spotlight on the critical metrics of HDGF/60, MDGF/60, and LDGF/60, offering a granular view of how players contribute to their team’s offensive output in high-stakes situations.
Graph 1: HDGF/60 – This graph ranks players based on their ability to score or contribute to high-danger goals, juxtaposed against their xGF/60 to evaluate their efficiency and effectiveness in generating high-quality scoring chances.
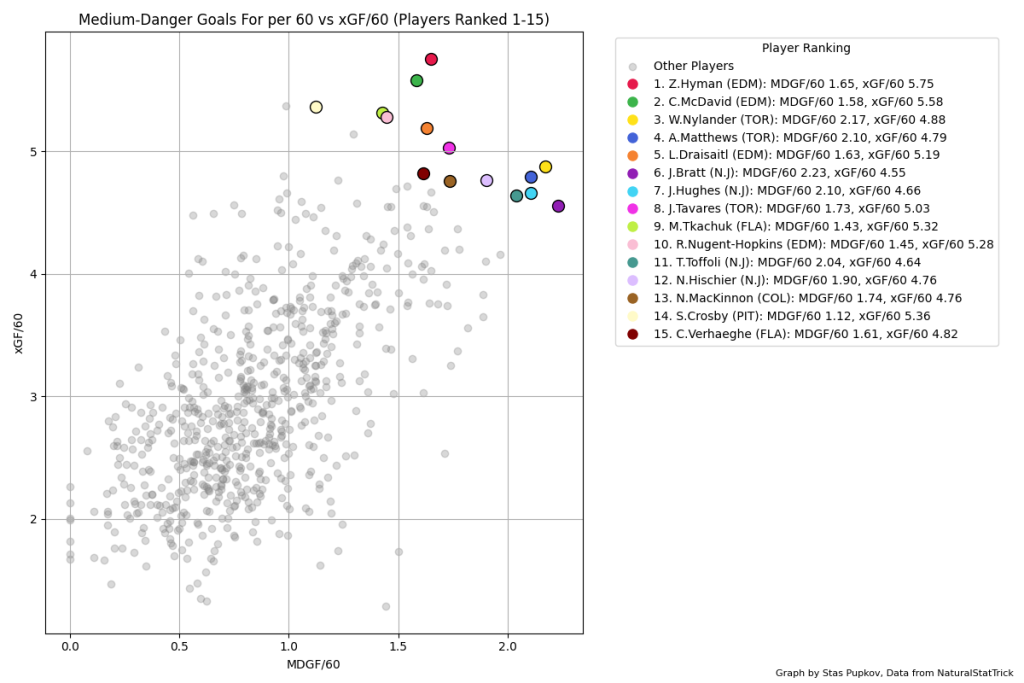
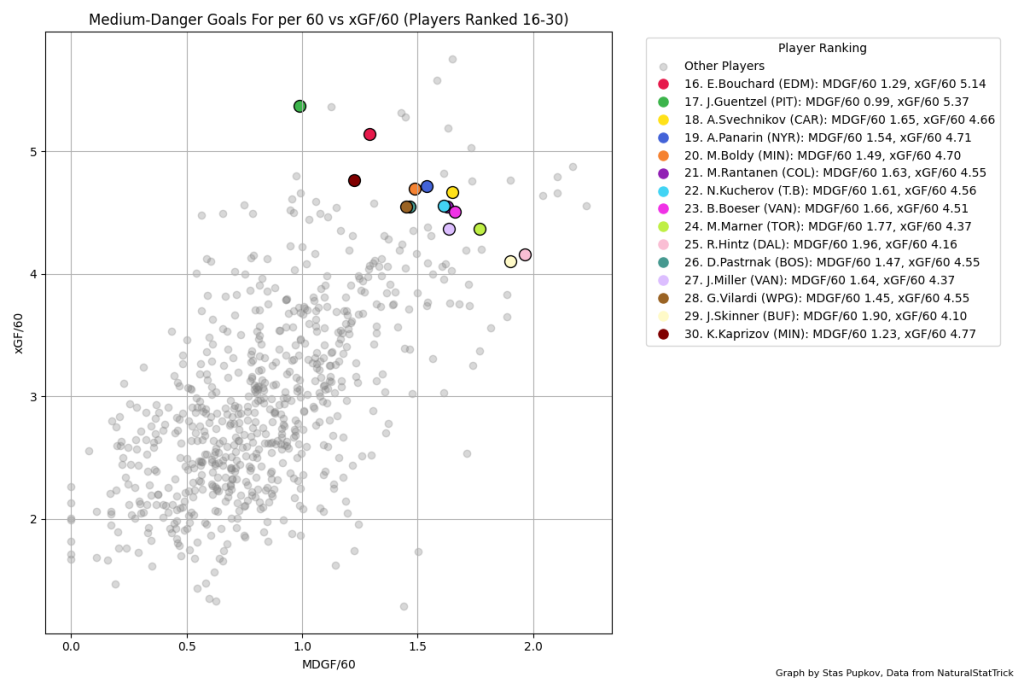
Graph 2: MDGF/60 – By examining medium-danger goals, we gain insight into a player’s versatility and contribution to the team’s overall scoring depth, assessing their performance in moderately challenging scoring scenarios.
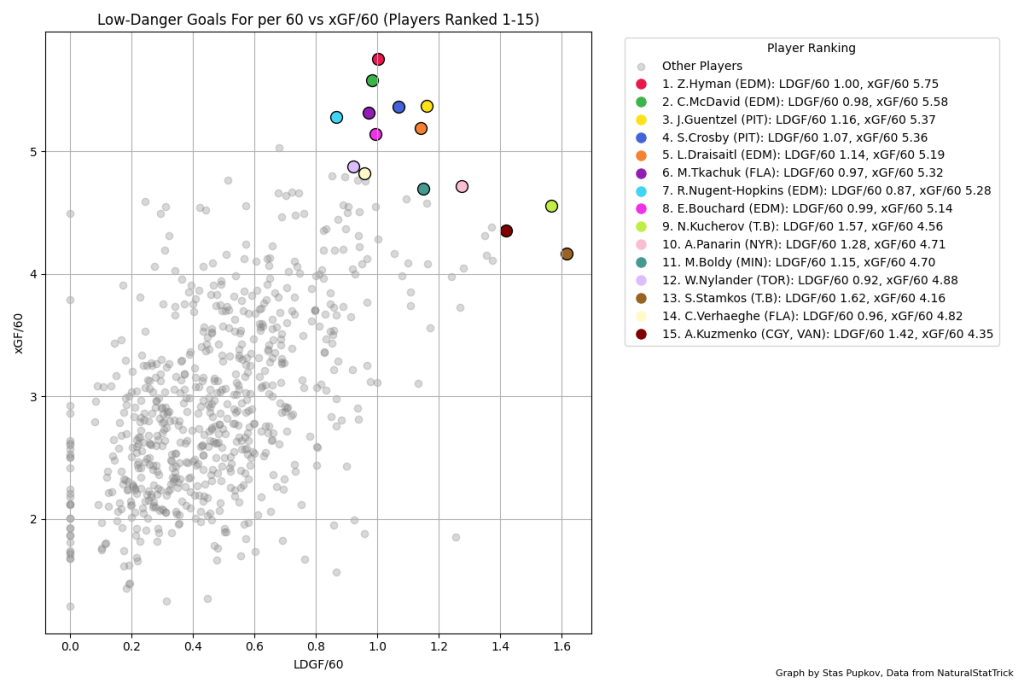
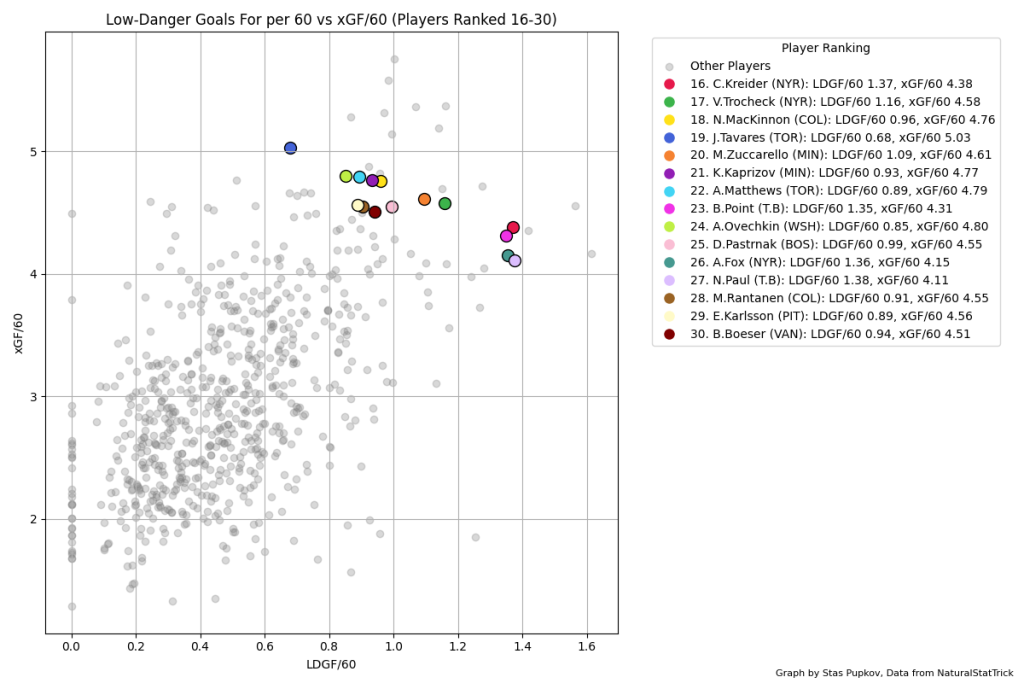
Graph 3: LDGF/60 – The analysis of low-danger goals reveals players who capitalize on every opportunity, highlighting those with the skill to contribute under less pressure, which cumulatively enhances team performance.
Each graph not only identifies leaders in each category but also contextualizes their contributions within the team’s offensive framework, emphasizing the multifaceted nature of player performance beyond traditional statistics.
Graphs 4-6: Exploring Mid-Tier Player Performance
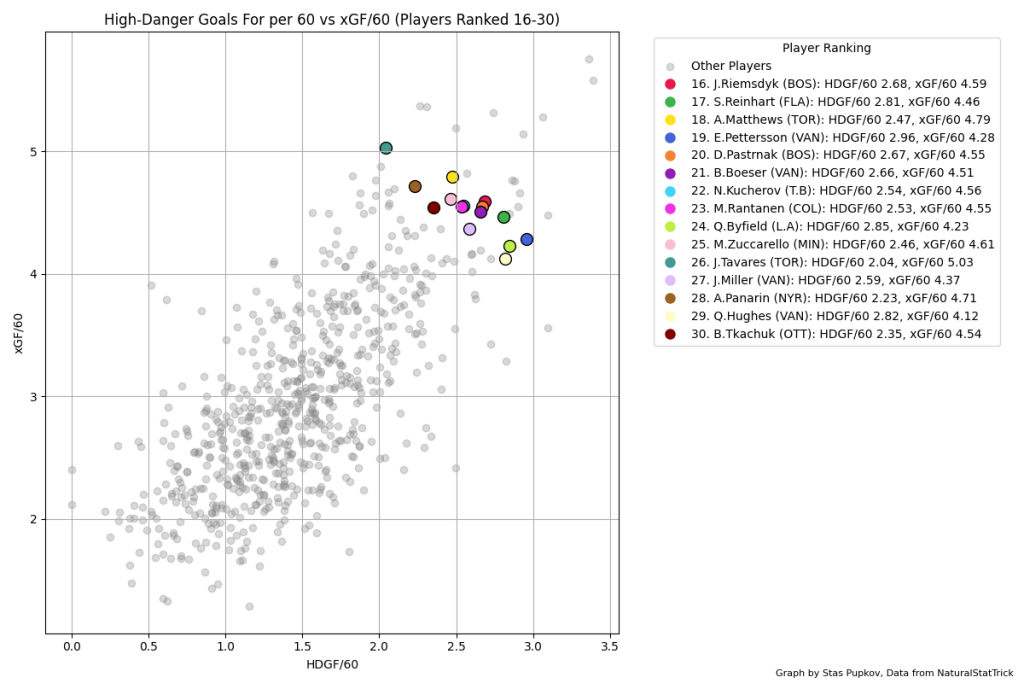
As we explore the middle ranks, focusing on players positioned 16-30 based on their HDGF/60, MDGF/60, and LDGF/60 metrics, we uncover the potential value that may be overlooked by conventional statistics. These graphs offer a nuanced perspective on players who, while not always in the limelight, significantly contribute to their team’s offensive capabilities and possess the potential for breakout seasons.
Graph 4: HDGF/60 for Players Ranked 16-30 – This analysis highlights those who excel in creating high-danger opportunities, suggesting potential targets for fantasy managers seeking high-upside players.
Graph 5: MDGF/60 for Players Ranked 16-30 – By focusing on medium-danger contributions, we identify players with consistent performance, essential for teams seeking reliability and depth in scoring.
Graph 6: LDGF/60 for Players Ranked 16-30 – This graph reveals players adept at capitalizing on lower-danger scoring chances, underscoring the importance of versatility and opportunism in player evaluation.
This segment emphasizes the depth of talent across the league and the importance of advanced metrics in identifying undervalued assets in fantasy hockey.
Graphs 7-9: Uncovering Hidden Gems Among Players Ranked 31-45
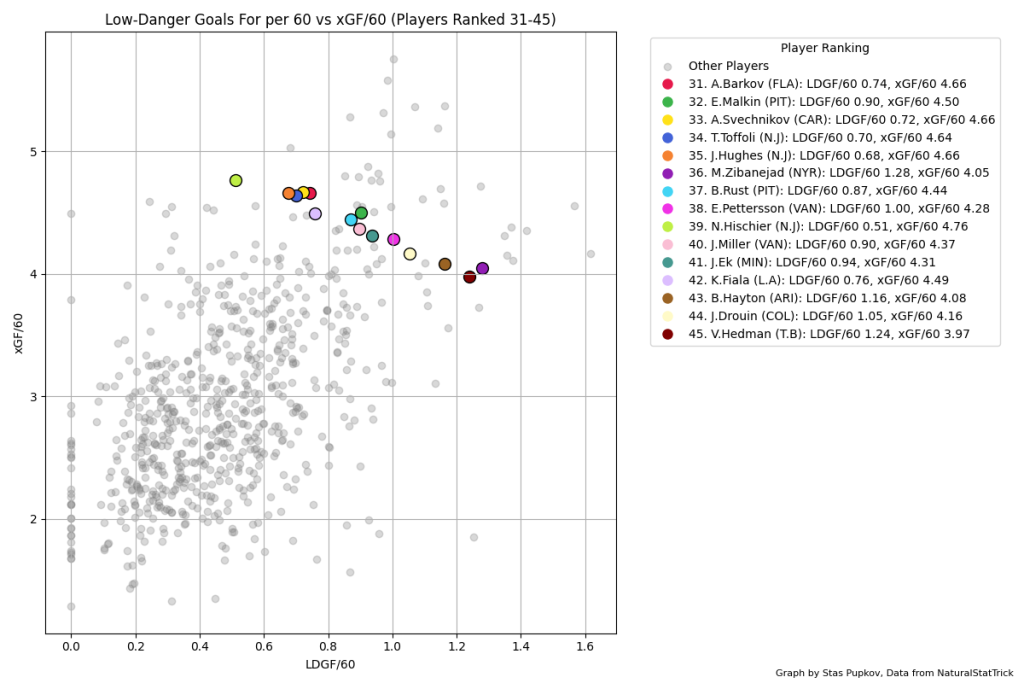
In our final set of analyses, we turn our attention to players ranked 31-45 in HDGF/60, MDGF/60, and LDGF/60. This segment is crucial for identifying players who may be flying under the radar but have shown glimpses of high potential. These players could be sleeper picks in fantasy hockey or undervalued assets by their teams.
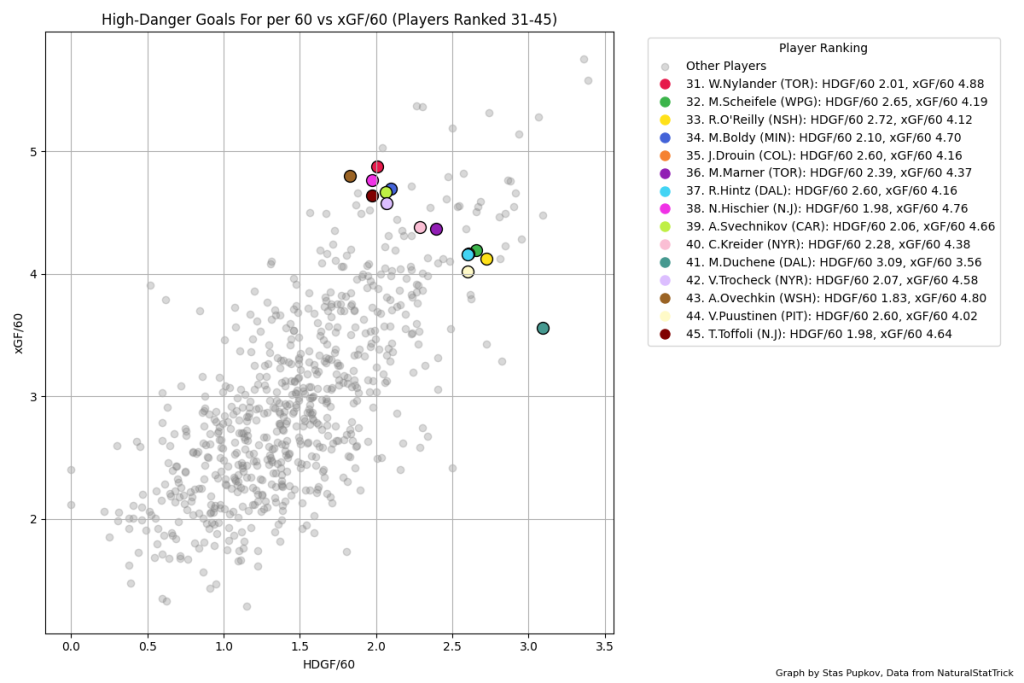
Graph 7: HDGF/60 for Players Ranked 31-45 – Highlights players who are on the cusp of breaking out, especially those capable of executing high-danger plays, potentially signaling untapped potential.
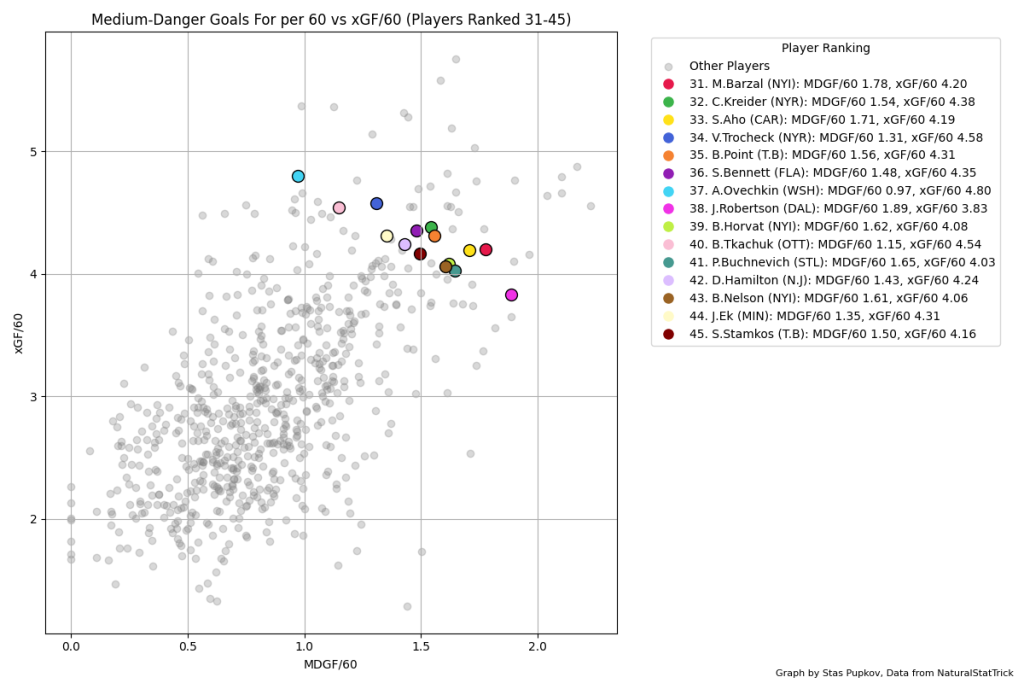
Graph 8: MDGF/60 for Players Ranked 31-45 – Focuses on consistency in medium-danger situations, pointing to players with solid performance metrics that could translate to increased production with more ice time or a change in role.
Graph 9: LDGF/60 for Players Ranked 31-45 – Reveals those who contribute even in low-danger contexts, suggesting reliability and a steady presence that could be critical for team depth and stability.
This exploration underscores the value of deep analytics in hockey, demonstrating that significant contributions often come from beyond the top-tier players. It highlights the importance of a comprehensive evaluation strategy that includes advanced metrics to uncover the full spectrum of player impact.
Conclusion
Our analytic voyage reveals that hockey’s competitive edge often lies hidden within the layers of advanced metrics. As we’ve journeyed from high-danger plays to the often-overlooked contributions in low-danger contexts, it’s clear that every tier of player performance holds value. By integrating these insights, teams and fantasy managers alike can gain a multidimensional view of player potential, fine-tuning their strategies for success both on the ice and in the fantasy arena.
Related Posts
UPCOMING GAMES
| Apr 27 - 14:04 |
| vs |
| |
| Apr 27 - 17:04 |
| vs |
| |
| Apr 27 - 20:04 |
| vs |
| |
| Apr 27 - 22:04 |
| vs |
| |
Starting Goalies
Top Skater Views
Top Goalie Profile Views
LINE COMBOS
| Frequency |
| |
|---|---|---|
| 18.7 | BRAYDEN POINT NIKITA KUCHEROV BRANDON HAGEL | |
| 15.9 | STEVEN STAMKOS ANTHONY DUCLAIR ANTHONY CIRELLI | |
| 15.0 | NICHOLAS PAUL MICHAEL EYSSIMONT MITCHELL CHAFFEE | |
DobberHockey Podcasts

Fantasy Hockey Life: Salary Cap Basics Remix
If you missed last year’s series on salary leagues, this is a remix with some bonus material. Jesse and Victor discuss the different ways you can step up your dynasty league with a salary component. Our show is part of the Dobber Podcast Network and sponsored by Fantrax.com. Email [email protected] and ask to join our […]

Keeping Karlsson: No. 533 – Ultimate Champion Interview + Playoff Preview
On this week’s Keeping Karlsson Fantasy Hockey Podcast mega-show, Elan and Brian gather and analyze the latest fantasy hockey news, notes and data.
Fantasy Hockey Life: Tim-Eh’s Time in the TIDY Top Tier
When one of the managers in the TIDY league top tier left midseason, Patron Tim volunteered to give up his excellent team to take over a mid-season orphan fighting to escape relegation. And Tim did not go quietly. Ryan, Jesse and Victor welcome Tim to talk through his experience and the trades he made in […]
Keeping Karlsson: Better Off Nedeljkovic
On this week’s Keeping Karlsson Fantasy Hockey Podcast mega-show, Elan and Brian gather and analyze the latest fantasy hockey news, notes and data from the past season to work on projecting the 2023-24 NHL and fantasy hockey season. — Join the Keeping Karlsson patron community! Patrons get guaranteed KKUPL invitations, plus monthly bonus AMA episodes, and full access to […]
Fantasy Hockey Life: FHL Player Cards with Brandon
Our guy Brandon has been doing great work behind the scenes to great Fantasy Hockey Life prospect player cards, visualizations with the metrics we care about most – including BASH. These are a great tool to catch at a glance the stats for upcoming players. Jesse interviews Brandon and Victor on the decisions behind what […]